Abstract—This paper presents the analysis of satellite image based on Normalized Difference Vegetation Index (NDVI). The method employs the multi-spectral remote sensing data technique to find spectral signature of different objects such as vegetation index, land cover classification, concrete structure, Built-up Land, Crop Land, Water bodies, fellow land and remaining areas presented in the image. For land cover classification, some band combinations of the remote sensed data are exploited and the spatial distribution such as road, urban area, agriculture land and water resources are easily Interpreteted by computing their normalized difference vegetation index. Different values of threshold of NDVI are used for generating the false colour composite of the classified objects. The simulation results show that the NDVI is highly useful in detecting the surface features of the visible area which are extremely beneficial for municipal planning and management. The vegetation analysis can be used for the situation of unfortunate natural disasters to provide humanitarian aid, damage assessment and furthermore to device new protection strategies.
.
Key Words: Land use, Remote Sensing, NDVI
I. INTRODUCTION
Land use involves the management and modification of Natural environment or wilderness into built environment such as settlements and semi-natural habitats such as arable fields, pasture , and managed wood . It also has been defined as "the arrangements, activities and inputs people undertake in a certain land cover type to produce, change or maintain it". In this Study focus the analysis of various object threw NDVI.
1.2 Over view of NDVI
The Normalized Difference Vegetation Index (NDVI) is an index of plant ―greenness‖ or photosynthetic activity, and is one of the most commonly used vegetation indices. Vegetation indices are based on the observation that different surfaces reflect different types of light differently. Photosynthetically active vegetation, in particular, absorbs most of the red light that hits it while reflecting much of the near infrared light. Vegetation that is dead or stressed reflects more red light and less near infrared light. Likewise,
non-vegetated surfaces have a much more even reflectance across the light spectrum.
Fig 1.NDVI reflectance
By taking the ratio of red and near infrared bands from a remotely-sensed image, an index of vegetation ―greenness‖ can be defined. The Normalized Difference Vegetation Index (NDVI) is probably the most common of these ratio indices for vegetation. NDVI is calculated on a per-pixel basis as the normalized difference between the red and near infrared
bands from an image:
Where NIR is the near infrared band value for a cell and RED is the red band value for the cell. NDVI can be calculated for any image that has a red and a near infrared band. The biophysical interpretation of NDVI is the fraction of absorbed photo synthetically active radiation. Many factors affect NDVI values like plant photosynthetic activity, total plant cover, biomass, plant and soil moisture, and plant stress. Because of this, NDVI is correlated with many ecosystem attributes that are of interest to researchers and managers (e.g., net primary productivity, canopy cover, bare ground cover). Also, because it is a ratio of two bands, NDVI helps compensate for differences both in illumination within an image due to slope and aspect, and differences between images due things like time of day or season when
Feature Extraction using Normalized Difference
Vegetation Index (NDVI): a Case Study of
Panipat District
Seema Rani1, Rajeev2, Ravindra Prawasi3
the images were acquired. Thus, vegetation indices like NDVI make it possible to compare images over time to look for ecologically significant changes. Vegetation indices like NDVI, however, are not a panacea for rangeland assessment and monitoring. The limitations of NDVI are discussed below.
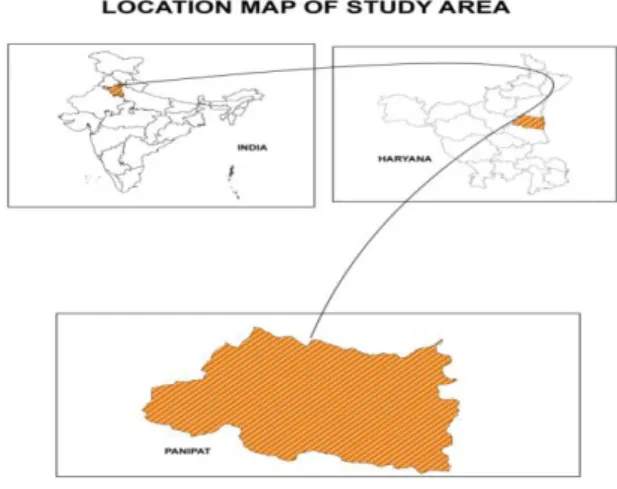
Study area
Panipat district first came into existence on November 1, 1989. It was carved out of Karnal district. The district status to Panipat sub division of Karnal was again restored on First of January, 1992. The district has one sub divisions namely Panipat and Five development blocks namely Panipat, Samalkha, Madlauda, Israna and Bapauli. It is located at 29.80 N parallel and 76.380 E meridians, with an average elevation of 220 M (721 feet). This city has strategic at National Highway No. 1, just 89 Km. from the national capital. The city has one of the best rail and road connectivity to the state capital Chandigarh and other important commercial hubs of the adjoining states. Panipat is a historical place and was the gateway of India in medieval times. Three battles were fought here and winner of course occupied the Delhi Throne.
Panipat is situated in North Eastern Haryana, flanked by River Yamuna on the estern10 border.. The Panipat district is surrounded by Karnal in North, Panipat in West and Sonipat district in South and Mujarfarnagar district of Uttar Pradesh in the East. It has a total geographical area of 130437.2 hectare. As of 2001 Indian census Panipat had a population of 967449 with a sex ratio of 829. Panipat district has an average literacy rate of 69.17%.The district has adequate drainage facilities. The important Babarpur drain prevents the district from floods. The water of the river and drains can be harvested for crop production
.
3. Methodology based on NDVI
In this section, the NDVI technique is used for extracting the various features presented in the 3-band satellite image of Panipat region. Vegetation cover is the one of most important biophysical indicator to soil erosion, which can be estimated using vegetation indices derived from the satellite images. Vegetation indices allow us to delineate the distribution of vegetation and soil based on the characteristic reflectance patterns of green vegetation. The NDVI is a simple numerical indicator that can be used to analyze the remote sensing measurements, from a remote platform and assess whether the target or object being observed contains Live green vegetation .The NDVI is calculated as
NDVI = NIR -RED/ NIR +RED
And in Geomatica Software ndvi is Calculate threw
Modeling: - if % empty channel( NIR BAND-RED BAND/ NIR BAND+RED BAN *100+100+0.5)
Table .1 Wavelength bandwidth Resolution Swath Width Revisit Time Bands (μm) (m) (km) (days) Band 1 (VIS) 0,52 to 0,59 23,5 142 24 Band 2 (VIS) 0,62 to 0,68 23,5 142 24 Band 3 (NIR) 0,77 to 0,86 23,5 142 24 Band 4 (SWIR) 1,55 to 1,7 70,5 142 24
Fig.2. indicates the visible ranges of the visible blue, visible green, visible red, near infrared, middle
infrared, thermal infrared and middle infrared. All visible ranges are captured by the satellite camera in form of bands through which features can be extracted after applying the NDVI method for different characteristics.
Result
The NDVI have been used widely to examine the relation between spectral variability and the vegetation. The pixel-based supervised classification is also carried out to make the comparison. Since the class involved small clusters, the line sampling at the training site will be considered. The results from both traditional pixel-based maximum likelihood classification and object-oriented classification as shown below: Map No 1
Map. 1 Land use Mask of different object of Panipat District
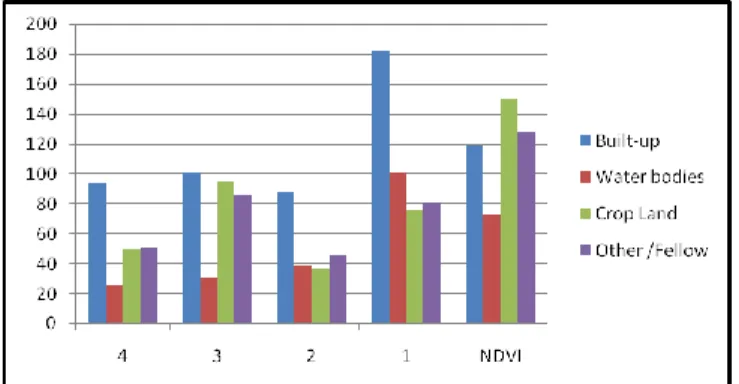
Table.2. Different features of the first study area of Panipat District extracted
Fig 4. Different features of the first study area of Panipat District extracted
Map. 2 Analysis separate band (LISS-3) of Panipat District
CONCLUSION
In this paper, the result of object oriented analysis is satisfied for land use classification as well as feature extraction and towards produce the land use map. The possibility of performing classification based of
Relative Accuracy Assents for improved the classification result obtained at the second level. Discriminating among the different confusion classes
was possible using the contextual and spectral information supplied by the images.
All steps involved in the image analysis could be recorded as a complete procedure.
Thus, the whole strategy for solving a particular problem can be applied to other data of the same type especially applying onto time series data. No. of Bands Built-up Water bodies Crop Land Other /Fellow 4 94 25 50 51 3 100 31 95 86 2 88 38 36 45 1 182 101 76 80 NDVI 119 73 150 128
integration of remote sensing and GIS, by providing operational means of interpretation high-resolution data. This technique is recommended to test on LISS-data .
REFERENCES
AVERY, T.E. and BERLIN, G.L. (1992). Fundamentals of Remote Sensing and Airphoto Interpretation.. Prentice Hall, Upper Saddle River, New Jersey. Chapter 6.
A.K. Bhandaria , A. Kumara, and G. K. Singhb
BAATZ, M.A.S. (1999). Object-Oriented and Multi-Scale Image Analysis in Semantic Networks. In: Proc. Of the 2nd International Symposium on Operationalization of Remote Sensing(Enschede. ITC).
BAATZ, M.A.S. (2000). Multiresolution segmentation - an optimization approach for high quality multi-scale image
segmentation. Angewandte Geographische
Informationsverarbeitung XI.
CAMPBELL, J. (1998). Map Use and Analysis. WCB/McGraw Hill. 3rd Ed., Chapter 18, pp 286-295. CAMPBELL, J.B. (1996). Introduction to Remote Sensing.
New York: Guilford Publications. 622 p.
CURRAN, P.J. (1985). Principles of Remote Sensing. Longman Scientific and Technical Group, Essex, England. 282pp.
HOFMANN, T. PUZICHA, J, and BUHMANN, J. (1998). Unsupervised texture segmentation in a deterministic annealing framework. In: IEEE Transactions on Pattern Analysis and Machine Intelligence, Vol. 13: 478-482. HUMANO, A. (2000). eCogntition and Change
Detection-Integrating Aerial Photos and Satellite Images. http://www.definins.com. eCognition
Hanqiu Xu “Extraction of Urban Built-up Land Features
from Landsat Imagery Using a Thematicoriented o Index Combination Technique”
Application Notes, Vol. 1, No. 2, September 2000. JENSEN, J. R. (1996). Introductory Digital Image
Processing – A Remote Sensing Perspective Prentice Hall, Upper Saddle River, New Jersey. 2
nd Ed. Wong T. H.1, S. B. Mansor 1 , M. R. Mispan 2 , N. Ahmad 1 , W. N. A. Sulaiman ‖‖‖‖‖ ― FEATURE EXTRACTION BASED ON OBJECT ORIENTED ANALYSIS‖