www.oncotarget.com
Differential genomics and transcriptomics between tyrosine
kinase inhibitor-sensitive and -resistant BCR-ABL-dependent
chronic myeloid leukemia
Neetu Singh1,*, Anil Kumar Tripathi2,*, Dinesh Kumar Sahu1,*, Archana Mishra3, Margaret Linan4, Bianca Argente4, Julia Varkey4, Niranjan Parida1, Rebecca Chowdhry5, Hari Shyam1, Nawazish Alam1, Shivani Dixit1, Pratap Shankar1, Abhishek Mishra1, Avinash Agarwal6, Chris Yoo4, Madan Lal Brahma Bhatt7 and Ravi Kant8
1Molecular Biology Unit, Center for Advance Research, King George’s Medical University, Lucknow, India 2Department of Clinical Hematology, King George’s Medical University, Lucknow, India
3Department of Cardio Thoracic and Vascular Surgery, King George’s Medical University, Lucknow, India 4Systems Imagination, Scottsdale, Arizona, USA
5Department of Periodontics, King George’s Medical University, Lucknow, India 6Department of Medicine, King George’s Medical University, Lucknow, India 7Department of Radiotherapy, King George's Medical University, Lucknow, India 8All India Institute of Medical Sciences, Rishikesh, India
*These authors have contributed equally to this work
Correspondence to: Neetu Singh, email: [email protected]
Keywords: tyrosine kinase inhibitors; chronic myeloid leukemia; molecular-inversion-probe based array; human-transcriptome
array 2.0; axiom biobank array
Received: February 01, 2018 Accepted: May 28, 2018 Published: July 13, 2018
Copyright: Singh et al. This is an open-access article distributed under the terms of the Creative Commons Attribution License 3.0 (CC BY 3.0), which permits unrestricted use, distribution, and reproduction in any medium, provided the original author and source are credited.
ABSTRACT
Previously, it has been stated that the BCR-ABL fusion-protein is sufficient to induce Chronic Myeloid Leukemia (CML), but additional genomic-changes are required for disease progression. Hence, we profiled control and tyrosine kinase inhibitors (TKI) alone or in combination with other drug-treated CML-samples in different phases, categorized as drug-sensitive and drug-resistant on the basis of BCR-ABL transcripts, the marker of major molecular-response. Molecular-profiling was done using the molecular-inversion probe-based-array, Human Transcriptomics-Array2.0, and Axiom-Biobank genotyping-arrays. At the transcript-level, clusters of control, TKI-resistant and TKI-sensitive cases were correlated with BCR-ABL transcript-levels. Both at the gene- and exon-levels, up-regulation of MPO, TPX2, and TYMS and down-regulation of STAT6, FOS, TGFBR2, and ITK lead up-regulation of the cell-cycle, DNA-replication, DNA-repair pathways and down-regulation of the immune-system, chemokine- and interleukin-signaling, TCR, TGF beta and MAPK signaling pathways. A comparison between TKI-sensitive and TKI-resistant cases revealed up-regulation of LAPTM4B, HLTF, PIEZO2, CFH, CD109, ANGPT1 in CML-resistant cases, leading to up-regulation of autophagy-, protein-ubiquitination-, stem-cell-, complement-, TGFβ- and homeostasis-pathways with specific involvement of the Tie2 and Basigin signaling-pathway. Dysregulated pathways were accompanied with low CNVs in CP-new and CP-UT-TKI-sensitive-cases with undetectable BCR-ABL-copies. High CNVs (previously
www.oncotarget.com Oncotarget, 2018, Vol. 9, (No. 54), pp: 30385-30418
www.oncotarget.com
reported gain of 9q34) were observed in BCR-ABL-independent and -dependent TKI, non-sensitive-CP-UT/AP-UT/B-UT and B-new samples. Further, genotyping CML-CP-UT cases with BCR-ABL 0-to-77.02%-copies, the identified, rsID239798 and rsID9475077, were associated with FAM83B, a candidate for therapeutic resistance. The presence of BCR-ABL, additional genetic-events, dysregulated-signaling-pathways and rsIDs associated with FAM83B in TKI-resistant-cases can be used to develop a signature-profile that may help in monitoring therapy.
INTRODUCTION
Response to tyrosine kinase inhibitors (TKI) is usually monitored by measurement of hematologic, cytogenetic, and molecular responses [1, 2]. BCR-ABL mRNA transcripts are the major parameter used to assess the TKI molecular response and are usually measured in the peripheral blood at diagnosis, every 3 months until BCR-ABL transcripts are <0.1%, and then every 3-6 months thereafter [3]. According to the National Comprehensive Cancer Network (NCCN), Imatinib therapy is working if BCR-ABL transcripts are ≤10% after 3 months, <1% after 6 months, or undetectable after 18 months of therapy.
However, TKI-treated patients in which the BCR-ABL gene is no longer found or is un-detacted copies do not seem to be cured. In most of the cases, either the CML moves towards to the advanced phase, or BCR-ABL and CML cells show remission in more than half of the people who cease TKI treatment [4, 5].
Hence, genome-wide profiling of different phases of Imatinib-treated CML is expected to uncover signaling pathways and molecular mechanisms involved in Imatinib treatment at different phases of CML. Recent studies have suggested that clonal Copy Number Aberrations (CNAs) are rare or even absent in pediatric/adult-CML-chronic phase (CML-CP) and are relatively common at progressed stages [7, 12–14]. At the transcript level, signature genes identified in whole blood and leukemic stem cells have been shown to distinguish chronic phase (CP) from blast crisis (BC) [6] and to predict major cytogenetic response and non-response in chronic-phase CML patients treated with Imatinib [7]. However, an in vitro study and found no alteration in genomic changes of bone marrow-derived HSCs and HPCs from CML patients on Imatinib treatment [8].
Activation of ERK/MAPK, JAK-STAT, ErbB, cell surface genes, genes of oxidative metabolism and DNA repair pathways, activation of inflammatory cytokines and dysregulation of key cancer signaling pathways, as well as down-regulation of pro-differentiation and TGF-β/ BMP signaling pathways have also been responsible for proliferation in CML [8–10].
In addition to copy number variations (CNVs) and expression profiling, genome-wide scoring of SNPs in different phases of Imatinib-treated CML will further help us to understand the resistance mechanism to TKIs.
At the transcript level, we were able to cluster TKI-sensitive and TKI-resistant cases and, after comparing, we identified the up-regulation of autophagy, complement, Tie-2 and Basigin signaling mediated homeostasis, protein ubiquitination, stem cell and down-regulation of immune system and TGF-beta pathways. Deregulation of these pathways was accompanied by low CNVs in CP-new and CP-UT-TKI-sensitive cases with undetectable BCR-ABL copies. High CNVs (previously reported gain of 9q34) were observed in BCR-ABL-independent and -dependent TKI, non-sensitive-CP-UT/AP-UT/B-UT and B-new samples. Further, using genotyping arrays, we assessed associations between individual SNPs and CML-resistance risk using odds ratios (ORs) and 95% confidence intervals (CIs) derived from logistic regression models. We identified that rsID239798 and 9475077 associated with the FAM83B gene, which may be directly related to treatment resistance in Imatinib-treated unrelated CML cases versus controls.
This analysis will be useful for a large segment of the medical research community for clinical screening of TKI-resistant and TKI-sensitive CML cases and develop a signature profile, which may help in monitoring therapy.
RESULTS
Differential gene expression levels among 35 CML-samples
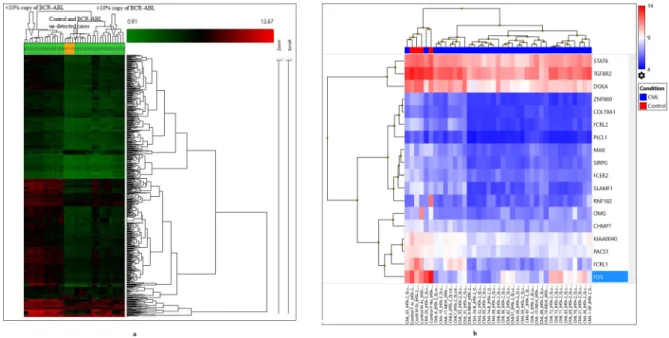
To identify significant differential gene expression levels between 4 control and 35 CML samples (including both TKI-treated and newly diagnosed cases), a one-way between-subjects ANOVA algorithm was used. Differentially expressed coding and non-coding transcript clusters were identified using default filtering criteria (fold-change (linear) < -2 or fold-change (linear) > 2 and ANOVA p value ≤0.05). The array that was used measures 67,528 genes, including both coding (44,699) and non-coding (22,829) genes. Out of the total number of genes, only 2,073 genes were differentially expressed (1,425 coding and 648 non-coding). Compared to control among all CML samples, 69 genes were up-regulated (49 coding and 20 non-coding), and 2,004 genes were down-regulated (1,376 coding and 628 non-coding). Hierarchical clustering of the gene-level data revealed distinct clustering of 35 CML samples, including tri-phasic-TKI-treated, new cases and four normal controls (p=0.01, Figure 1a, Table 1 ). When comparing clusters
www.oncotarget.com
with copies of BCR-ABL, samples with un-detected copies of BCR-ABL (UT, AP-UT and some of CP-new cases) were classified under the first cluster as non-sensitive cases (p=0.01). The second cluster-sub-cluster-I included all control samples, and the second cluster-sub-cluster-II included CP new cases and cases in which copies of BCR-ABL were undetectable. The third cluster included samples showing ≥1-10% copies of BCR-ABL (CP-UT, AP-UT and new blast cases) (Table 1).
In the first cluster-sub-cluster-II, the CML-55, 56, 57, 58, 59 samples were all from patients treated with Hydroxyurea, Zyloric and Imatinib and were non-sensitive to treatment but for shorter time period (all within one year). In the third cluster sub-cluster-I, one patient was initially treated with Myeleron (Busulfan 15 years earlier), Hydab, and Zyloric and then later with Imatinib and then developed resistance. The third cluster sub-cluster-II contained samples treated with Droxygel (Antacid), Unidrea/Hydab and Imatinib for a longer time period (3.8 years-7.1 years).
Supplementary Table 1 shows the differential expression of genes between 4 control and 35 CML samples, including both TKI-treated and fresh diagnosed cases (p=0.01, fold-change=2, default FDR p value). These differentially expressed genes showed highly significant involvement with the Retinoblastoma (RB) (24 up-regulated and 1 down-regulated), cell cycle (14 up-regulated and 2 down-regulated), DNA replication (8 up-regulated), DNA IR-damage and cellular response
via ATR (9 up-regulated and 1 down-regulated), allograft rejection (10 down-regulated), T cell antigen receptor (TCR) signaling pathway (9 down-regulated), Vitamin D receptor pathway (12 down-regulated), histone modifications (7 up-regulated), gastric cancer networks 1 and 2 (5 and 6 genes up-regulated, respectively), G1 to S cell cycle control (6 up-regulated and 1 down-regulated), mitotic G1-G1/S phases (12 up-regulated), spinal cord injury (2 up-regulated and 6 down-regulated), hair follicle development: cyto-differentiation (1 up-regulated and 6 down-regulated) and TGF-beta signaling pathways (2 up-regulated and 6 down-regulated, Supplementary Table 2a).
With strict criteria (fold-change=2, p=0.001, and FDR p value=0.05) and considering only NM IDs on gene level differential expression between 4 control and 35 CML samples, a highly significant down-regulation of 18 genes was identified upon which the following three clusters were formed: the first cluster included control samples CML-20 and CML-63; the second cluster included CML-4, 7, 91, 93, 1, 11, 19, 6 and 10; and the third cluster included three sub-clusters-I (21, 36,72, 73, 71, 83, 65, and 70), sub-cluster-II (32, 55, 9, 58, 14, 34, and 69) and sub-cluster-III (56, 59, 86, 62, 57, 2, 13, 68, and 87, Figure 1b).
At a significance level of p=0.001 and an FDR p value=0.05, 18 genes showed significant down-regulation (p=0.05) among 36 pathways in CML, including the highly significant PDGFR-beta pathway (significance
Figure 1: (a) Hierarchical clustering of the gene-level data revealed a distinct clustering of subgroups of all CML cases (35) and control
(4) using default filtering criteria (fold-change (linear) < -2 or fold-change (linear) > 2 and ANOVA p value ≤0.05). (b) Gene level
differential expression between 4 control and 35 CML samples using strict criteria (fold-change=2, p=0.001, and FDR p value=0.05) and considering only NM IDs, a highly significant down-regulation of 18 genes based upon which three clusters were formed.
www.oncotarget.com
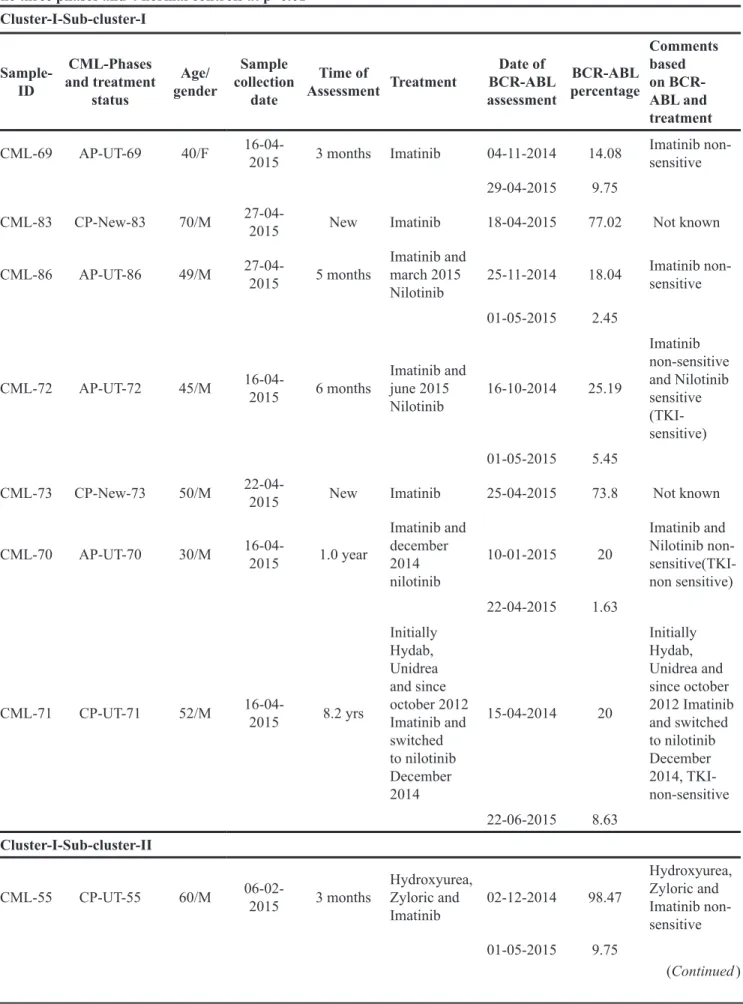
Table 1: Hierarchical clustering of the gene-level data revealed distinct clustering of 35 samples of CML including all the three phases and 4 normal controls at p=0.01
Sample-ID CML-Phases and treatment status Age/ gender Sample collection date Time of Assessment Treatment Date of BCR-ABL assessment BCR-ABL percentage Comments based on BCR-ABL and treatment
CML-69 AP-UT-69 40/F 16-04-2015 3 months Imatinib 04-11-2014 14.08 Imatinib non-sensitive 29-04-2015 9.75
CML-83 CP-New-83 70/M 27-04-2015 New Imatinib 18-04-2015 77.02 Not known
CML-86 AP-UT-86 49/M 27-04-2015 5 months Imatinib and march 2015
Nilotinib 25-11-2014 18.04
Imatinib non-sensitive 01-05-2015 2.45
CML-72 AP-UT-72 45/M 16-04-2015 6 months Imatinib and june 2015
Nilotinib 16-10-2014 25.19 Imatinib non-sensitive and Nilotinib sensitive (TKI-sensitive) 01-05-2015 5.45
CML-73 CP-New-73 50/M 22-04-2015 New Imatinib 25-04-2015 73.8 Not known
CML-70 AP-UT-70 30/M 16-04-2015 1.0 year Imatinib and december 2014 nilotinib 10-01-2015 20 Imatinib and Nilotinib non- sensitive(TKI-non sensitive) 22-04-2015 1.63 CML-71 CP-UT-71 52/M 16-04-2015 8.2 yrs Initially Hydab, Unidrea and since october 2012 Imatinib and switched to nilotinib December 2014 15-04-2014 20 Initially Hydab, Unidrea and since october 2012 Imatinib and switched to nilotinib December 2014, TKI-non-sensitive 22-06-2015 8.63 Cluster-I-Sub-cluster-II
CML-55 CP-UT-55 60/M 06-02-2015 3 months Hydroxyurea, Zyloric and
Imatinib 02-12-2014 98.47 Hydroxyurea, Zyloric and Imatinib non- sensitive 01-05-2015 9.75 (Continued ) Cluster-I-Sub-cluster-I
www.oncotarget.com Sample-ID CML-Phases and treatment status Age/ gender Sample collection date Time of Assessment Treatment Date of BCR-ABL assessment BCR-ABL percentage Comments based on BCR-ABL and treatment
CML-56 CP-UT-56 43/F 09-02-2015 1.0 yr Hydroxyurea, Zyloric and
Imatinib 29-02-2014 89.5 Hydroxyurea, Zyloric and Imatinib non-sensitive 24-03-2015 1.2
CML-58 CP-UT-58 32/F 09-02-2015 9 months Hydroxyurea, Zyloric and
Imatinib 12-04-2015 58.75 Hydroxyurea, Zyloric and Imatinib non-sensitive 12-04-2015 9.8 CML-62 AP-UT-62 42/M 09-04-2015 4.4 yrs Unidrea, Imatinib and since February 2014 Nilotinib 06-06-2014 14.96 Uridrea, Imatinib and Nilotinib non-sensitive (TKI-non-sensitive) 22-06-2015 4.03 CML-65 CP-UT-65 43/M 20-04-2015 7.9 yrs Hydroxyurea, Zyloric and Imatinib later Nilotinib 24-06-2014 18.95 Hydroxyurea, Zyloric Imatinib and Nilotinib was sensitive (TKI-non-sensitive) 22-04-2015 4.63
CML-57 CP-UT-57 42/F 09-02-2015 7 months Hydroxyurea, Zyloric and
Imatinib 22-07-2014 67.45 Hydroxyurea, Zyloric and Imatinib non-sensitive 22-04-2015 8
CML-59 CP-UT-59 15/M 01-04-2015 3 months Hydroxyurea, Zyloric and
Imatinib 11-12-2014 15.75 Hydroxyurea, Zyloric and Imatinib non-sensitive 29-04-2015 9.75
CML-14 B-New-14 35/F 29-05-2014 New Hydroxyurea, Zyloric and
Imatinib 09-06-2014 85.56 Not known
(Continued )
www.oncotarget.com Sample-ID CML-Phases and treatment status Age/ gender Sample collection date Time of Assessment Treatment Date of BCR-ABL assessment BCR-ABL percentage Comments based on BCR-ABL and treatment All controls Cluster-2-sub cluster-II
CML-10 CP-New-10 20/M 28-05-2014 New Imatinib 28-05-2014 120 Not known
06-02-2015 0.95
CML-07 CP-UT-07 41/M 22-05-2014 7.2 yrs Imatinib 28-02-2007 100% Imatinib sensitive 22-07-2014 detected not
CML-6 CP-UT-6 24/M 22-05-2014 7 months Imatinib 21-11-2013 75 Imatinib sensitive 17-06-2014 detected not
CML-04 CP-UT-4 14/M 22-05-2014 1.2 year Imatinib 15-03-2013 100 Imatinib sensitive 06-09-2014 detected not CML-02 CP-UT-2 50/M 22-05-2014 4 yrs Initially with Droxygel (Antacid), Unidrea and later with Imatinib 14-02-2013 100% Initially with Droxygel (Antacid), Unidrea and later with Imatinib-sensitive 20-03-2014 detected not
CML-1 AP-UT-1 35/M 22-05-2014 1.8 yrs Imatinib 30-08-2012 26 Imatinib sensitive
CML-20 CP-UT-20 33/F 05-06-2014 1 month Imatinib 21-05-2014 97.54 NA
Cluster-3-sub cluster-I CML-34 B-New-34 24/M 12-06-2014 New Imatinib and since February 2015 Nilotinib
20-06-2014 35.63 Imatinib non-sensitive 27-11-2014 95.37
CML-09 CP-New-9 46/M 28-05-2014 New Imatinib 28-05-2014 100 Not known
(Continued )
www.oncotarget.com Sample-ID CML-Phases and treatment status Age/ gender Sample collection date Time of Assessment Treatment Date of BCR-ABL assessment BCR-ABL percentage Comments based on BCR-ABL and treatment CML-32 AP-UT-32 27/F 12-06-2014 15 yrs Initially treated with Myeleron, Hydab, Zyloric since may 2005 on Imatinib 13-07-2014 55.63 Initially treated with Myeleron, Hydab, Zyloric since may 2005 on Imatinib-non-sensitive 17-11-2014 35.37 Cluster-3-sub cluster-II CML-13 CP-UT-13 50/M 29-05-2014 7.1 yrs Droxygel (Antacid), Unidrea and Imatinib 20-02-2014 30 Droxygel (Antacid), Unidrea and Imatinib sensitive 12-03-2015 0.1 CML-21 CP-UT-21 60/M 05-06-2014 3.8 yrs Droxygel (Antacid), Unidrea and Imatinib 14-11-2013 75 Droxygel (Antacid), Unidrea and Imatinib sensitive 31-07-2014 0.11
CML-19 B-New-19 28/M 29-05-2014 New Imatinib 15-05-2014 100 Not known
CML-11 CP-UT-11 33/F 28-05-2014 4.2 yrs Hydab and Imatinib 21-04-2010 97.54 Hydab and Imatinib sensitive 21-05-2014 Not detectable CML-36 CP-UT-36 23/M 03-07-2014 6.10 yrs Initially Hydab and presently on Imatinib 20-02-2010 30 Initially Hydab and Imatinib sensitive 30-10-2014 0.11 Cluster-3-sub cluster-III
CML-93 CP-UT-93 60/M 08-06-2015 11 months Imatinib 14-05-2014 100 Imatinib non-sensitive 11-03-2015 70.13
CML-68 CP-UT-68 28/M 16-04-2015 4 months Imatinib 22-09-2014 45.2 Imatinib non-sensitive 22-04-2015 16.1
(Continued )
www.oncotarget.com
of 3.77 at p=0.000171), the TGF-beta receptor signaling pathway (significance of 3.21 at p=0.000618), the spinal cord injury pathway (significance of 2.56 at p=0.002758), the TGF-beta signaling pathway (significance of 2.44 at p=0.003649), and the MAPK signaling pathway (significance of 1.94 at p=0.011546, Supplementary Table 2b).
Exon-specific expression among control and 35-CML samples
Relative exon-specific expression was measured between two conditions (control and all 35-CML samples) after excluding gene level data and passing through default filtering criteria (Splicing Index (linear) < -2 or Splicing Index (linear) > 2, ANOVA p value < 0.05, a gene must be expressed in both conditions, a PSR/Junction must be expressed in at least one condition, and a gene must contain at least one PSR) using the following algorithms: 1.) Splicing Index; 2.) one-way between-subjects ANOVA (unpaired); 3.) false discovery rate < 0.05; 4.) use an eligible PSR to determine gene expression if it presents in >=50% of all transcript isoforms; 5.) a gene is expressed in a sample if >=50% of its eligible PSRs have DABG p value < 0.05; 6.) a condition has this gene expressed if >=50% of its samples express this gene; and 7.) a PSR/ Junction is expressed in a condition if >=50% of samples have DABG p value < 0.05 among the samples analyzed.
However, on applying strict criteria (Exon-Splicing Index (linear) < -10 or Splicing Index (linear) > 10,
exon ANOVA p value < 0.001, exon FDR p value < 0.05, fold-change < -10 or > 10 for genes expressed in both conditions), we observed 7.59-, 15.22- and 5.09-fold down-regulation of IL-2-inducible T cell kinase (ITK-exon SI -10.28, exon p value=0.0000123, exon FDR p value=0.0201), FBJ murine osteosarcoma viral oncogene homolog (FOS-exon SI -12.57, exon p value=0.000000587, exon FDR p value=0.006), and src kinase associated phosphoprotein 1 (SKAP1-exon SI -10.37, (SKAP1-exon p value= 0.0000354, (SKAP1-exon FDR p value=0.031), respectively, among CML samples. However, Myeloperoxidase (MPO-exon SI -30.08, exon p value=0.0001, exon FDR p value=0.044), Thymidylate synthetase (TYMS-exon SI= -15.08, exon p value=0.0000896, exon FDR p value=0.044) and TPX2, microtubule-associated (TPX2-exon SI=13.79, exon p value= 0.0001, exon FDR p value=0.046) showed up-regulation of 121.81-, 10.12- and 7.56-fold, respectively, among CML cases. After submitting these genes to the Reactome Pathway database, we identified ITK, FOS and SKAP1 mediated down-regulation of the immune system (Supplementary Table 3). MPO, TPX2, TYMS specifically up-regulated cell cycle pathways and individually, TPX2 mediated the up-regulation of phosphorylation altering the transcriptional regulation of TP53 activity and TYMS-related G1/S-Specific transcription through interconversion of nucleotide di- and triphosphates. Further, MPO enhanced neutrophil degranulation, thereby affecting the innate immune system (Supplementary Table 3). Sample-ID CML-Phases and treatment status Age/ gender Sample collection date Time of Assessment Treatment Date of BCR-ABL assessment BCR-ABL percentage Comments based on BCR-ABL and treatment
CML-91 CP-UT-91 66/F 08-06-2015 6 months Imatinib 10-09-2014 38.52 Imatinib non-sensitive 22-04-2015 26.1
CML-63 CP-UT-63 37/M 09-04-2015 7 months Imatinib 21-08-2014 100 Imatinib non-sensitive
09-04-2015 80
CML-87 CP-UT-87 45/F 08-06-2015 2.9 yrs Imatinib 01-07-2015 86 Imatinib non-sensitive Both sub-cluster-I and II of I-cluster included non-sensitive cases with un-detected copies of BCR-ABL samples (Chronic Phase under treatment; CP-UT, accelerated phase under treatment; AP-UT and some of Chronic Phase-new; CP-new cases) In cluster-I sub-cluster-II all were treated with Hydroxyurea, Zyloric and Imatinib and were non-sensitive to the treatment. The second cluster-sub-cluster-I included all control samples and second cluster-sub-cluster-II included CP-new cases and cases where copies of BCR-ABL were undetectable. Third cluster included samples showing > or = 1 to 10% copies of BCR-ABL samples (CP-UT, AP-UT and new blast cases). In cluster-3 sub-cluster-I one patient was initially treated with Myeleron (Busulfan-15 years back), Hydab, Zyloric and later with Imatinib and in cluster-3 sub-cluster-II the samples except CML-19 all other were treated with Droxygel (Antacid), Unidrea/Hydab and Imatinib.
www.oncotarget.com
Copy number variation profiling of 34 CML-samples
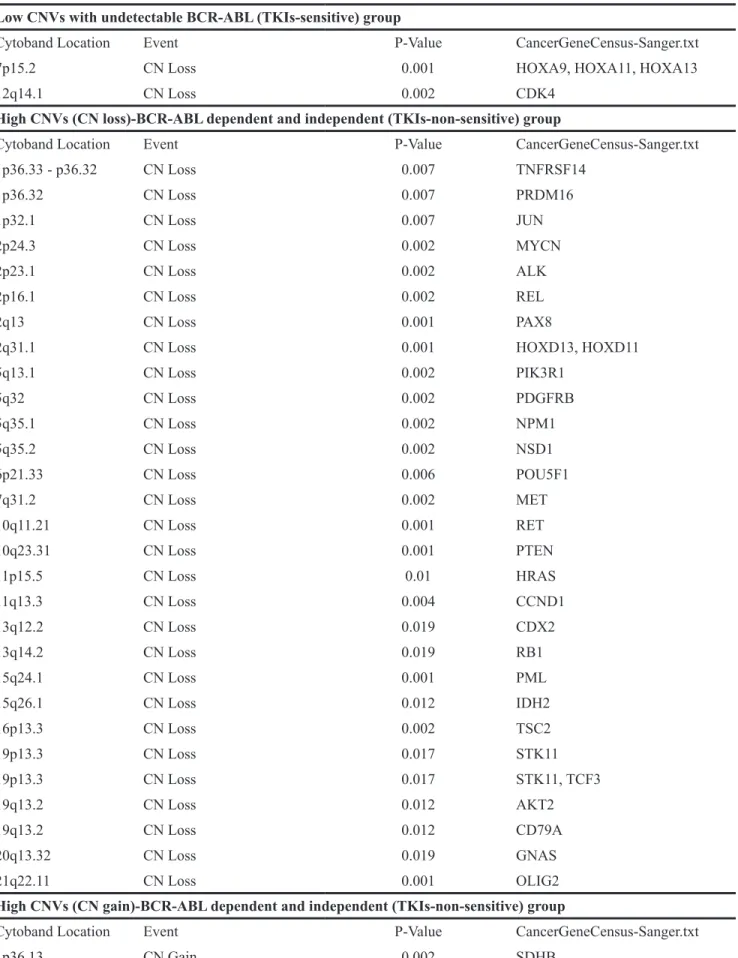
CNV profiling was completed for 39 CML-samples (34 CML and five control samples), and the results were analyzed using Nexus version 7.5 (Biodiscovery, Inc. CA USA). Samples were further categorized on the basis of CNVs, percent loss of heterozygosity (LOH) and percent genome change (Table 2a). In group I, CP-new and B-New cases (CML9, 10, 14) and CP-UT cases with un-detected BCR-ABL levels (CML56, 57, 58, CML55, 59) showed low copy number variation, i.e., there were no significant gains, but there were losses of HOXA9, HOXA11, HOXA13 (7p15.2) and CDK4 (12q14.1, Table 2b and 2c). In group II, high CNVs were observed in both samples with undetectable and <20% BCR-ABL copies, including both sensitive and non-sensitive cases and >20% BCR-ABL copies (AP-UT-22, 37, 38 and B-New-34, B-UT-47, 48)] (Table 2b). On aggregate analysis, the high CNVs-TKIs non-sensitive group showed significant gains of SDHB (1p36.13), FGFR3, WHSC1 (4p16.3), FNBP1, ABL1, NUP214, TSC1, RALGDS (9q34.11 - q34.2), YWHAE (17p13.3), CDK12 (17q12) and U2AF1 (21q22.3), with some important losses as listed in Table 2c. Analysis of 13 CML samples with common transcriptomics and CNV
The 13 CML samples with common transcriptomics and CNV profiles were separately compared to control through TAC using the same filter criteria (p value = 0.001 and FDR value p value = 0.001). CNV-based clustering was similar to transcript-based clustering, except for samples CML 2, 4 and 10. These samples were in the same transcript cluster as undetectable-BCR-ABL transcript (Cluster-II-sub-cluster-II); in the CNV-based cluster, samples 2 and 4 were grouped in the higher CNV group (undetectable/<20% BCR-ABL transcript), and CML-10 was grouped in the CNV group with undetectable BCR-ABL transcript levels, new cases or un-detected BCR-ABL (Table 3).
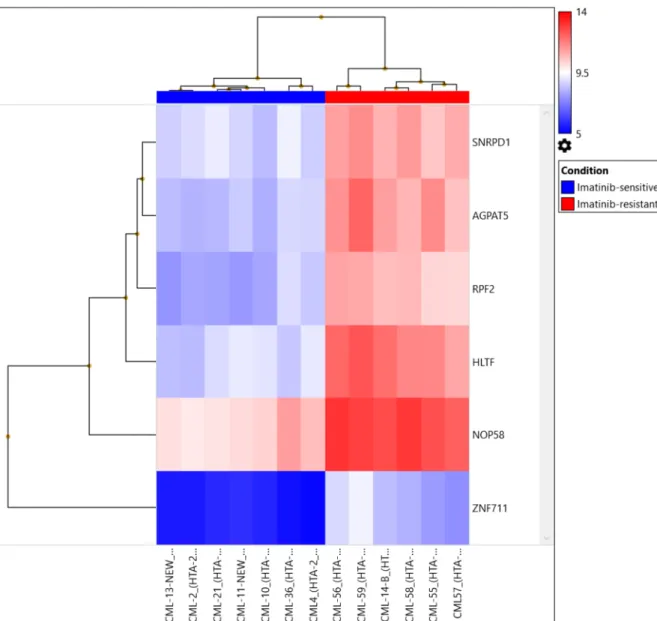
We identified up-regulation of 2,230 genes and down-regulation of 2,683 genes among Imatinib-resistant versus Imatinib-sensitive samples at the gene expression level after applying strict criteria [ANOVA p value < 0.001, FDR p value <0.0001, and gene fold-change < -4 or gene fold-change (linear) > 4, Figure 2, Table 3 ]. We identified highly significant up-regulation of helicase-like transcription factor (HLTF, p= 0.00000000589, FDR p= 0.0000492), small nuclear ribonucleoprotein D1 polypeptide (SNRPD1, p= 0.000000012, FDR p= 0.0000492), 1-acylglycerol-3-phosphate O-acyltransferase 5 (AGPAT5, p= 0.0000000191, FDR p= 0.0000633), NOP58 ribonucleoprotein (NOP58, p= 0.0000000347, FDR p= 0.0000711), ribosome production factor 2 homolog (RPF2, p= 0.0000000502, FDR p= 0.0000865) and zinc finger protein 711 (ZNF711, p= 0.000000058,
FDR p= 0.0000933). The genes were up-regulated in the AGPAT5-mediated triacylglyceride (significance=2.27, p=0.005357), glycerophospholipid synthesis (significance=1.51, p=0.0031133), NOP58-mediated SUMOylation of RNA binding proteins (significance=1.89, p=0.012906), SNRPD1-mediated metabolism of non-coding RNA (significance=1.84, p=0.014454), mRNA processing (significance=1.55, p=0.028078), HLTF-mediated Retinoblastoma (RB) in cancer (significance=1.7, p= 0.019966), and E3 ubiquitin ligases ubiquitinate target proteins pathways (significance=1.63, p=0.023481).
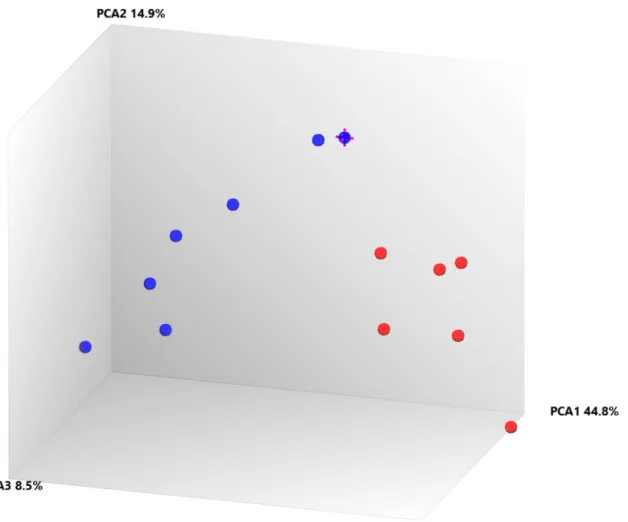
Further, when comparing Cluster III (TKI-resistant cases: CML-CP (CML-CP-UT 55-59, CML-B-14)) and Cluster I+Cluster-II (TKI sensitive cases: CML-CP-UT-2, 4, 10, 13, 21 and 36 and CML-CP-UT-11 as Imatinib/ Imatinib plus other drugs-sensitive){ at the exon level using specific splicing index filter criteria [(1.) Exon Splicing Index (linear) < -4 or Exon Splicing Index (linear and exon expressed in at least one condition) >4; 2.) ANOVA exon p value < 0.001, exon FDR p value <0.001; 3.) gene fold-change (linear and expressed in both conditions) <-5 or Gene fold-change (linear) > 5], approximately 0.01% coding-genes passed filter criteria (Figures 2 and 3). Considering SI at the exon level, lysosomal protein transmembrane 4 beta (LAPTM4B, FC17.99), piezo-type mechanosensitive ion channel component 2 (PIEZO2, FC-8.36), angiopoietin 1 (ANGPT1, FC-6.04), complement factor H (CFH, FC-6.39), helicase-like transcription factor (HLTF, FC-8.44), serine palmitoyltransferase, long-chain base subunit 3 (SPTLC3, FC-5.23), 1-acylglycerol-3-phosphate O-acyltransferase 5 (AGPAT5, FC-7.30), CD109 molecule (CD109 FC-6.07), and zinc finger protein 711 (ZNF711, FC-6.91) were up-regulated in TKI-resistant cases. The up-regulation resulted from the following: a cassette exon splicing event in LAPTM4B (0.46), PIEZO2 (0.32), ANGPT1 (0.29), CFH (0.28), HLTF (0.28), and SPTLC3 (0.26); splicing of an alternative 3' acceptor site in AGPAT5 (0.22); and junctional splicing in CD109 and ZNF711. These genes were further processed using Reactome Pathway analysis software (https://reactome. org/), and hemostasis (Supplementary Figure 1) with specific involvement of Tie2 [11], Basigin-transmembrane glycoprotein signaling [12] (Supplementary Figures 2 and 3), CFH-mediated complement cascade, HTLF-mediated protein-ubiquitination, SPTLC3 mediated sphingolipid metabolism, and ZNF711-mediated RNA polymerase II transcription pathways were overexpressed in TKI-resistant cases.
Validation of array-based transcripts by differential expression analysis
Down-regulated FOS, TGFβR2 and up-regulated TPX2 among all drug-treated CML cases as well as significantly up-regulated LAPTM4B, PIEZO2, ANGPT1, CFH, CD109 and HLTF molecule in TKI-resistant cases
www.oncotarget.com
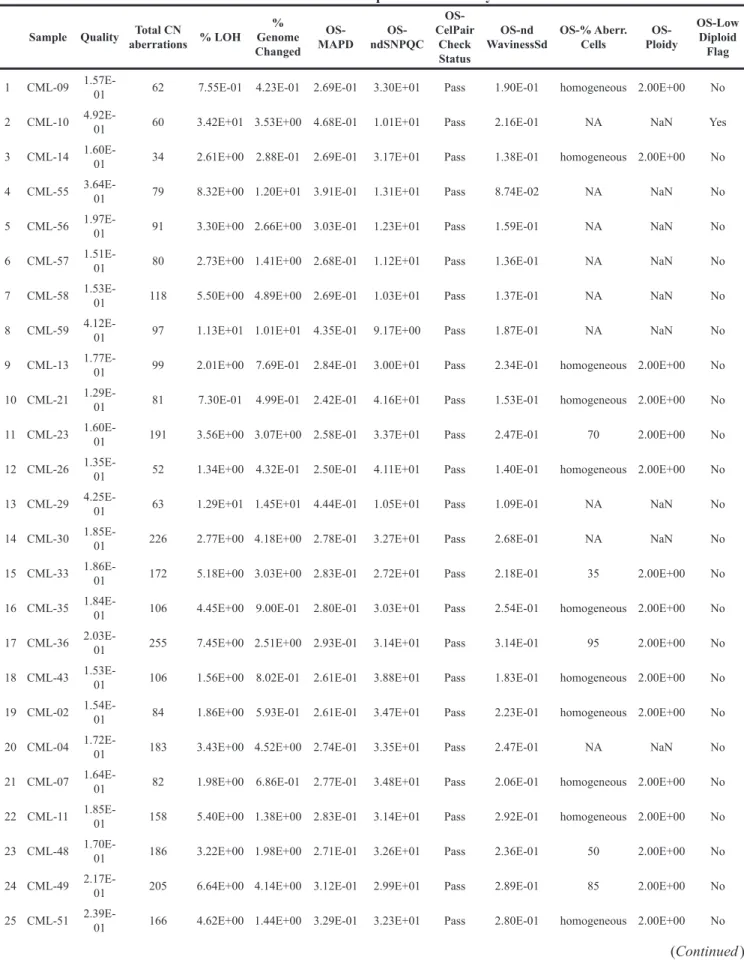
Table 2a: Percent genome change identified in chronic myeloid leukemia samples of different phases undergoing treatment (Chronic Phase under treatment; CP-UT, accelerated phase under treatment; AP-UT and Blast Phase under treatment; B-UT ) and new cases (Chronic Phase-new; CP-new and Blast new; B-new) cases through copy number and somatic mutation related molecular inversion probe based array
Sample Quality Total CN aberrations % LOH Genome % Changed OS-MAPD ndSNPQC OS-CelPair Check Status OS-nd
WavinessSd OS-% Aberr. Cells Ploidy
OS-OS-Low Diploid
Flag 1 CML-09 1.57E-01 62 7.55E-01 4.23E-01 2.69E-01 3.30E+01 Pass 1.90E-01 homogeneous 2.00E+00 No 2 CML-10 4.92E-01 60 3.42E+01 3.53E+00 4.68E-01 1.01E+01 Pass 2.16E-01 NA NaN Yes 3 CML-14 1.60E-01 34 2.61E+00 2.88E-01 2.69E-01 3.17E+01 Pass 1.38E-01 homogeneous 2.00E+00 No 4 CML-55 3.64E-01 79 8.32E+00 1.20E+01 3.91E-01 1.31E+01 Pass 8.74E-02 NA NaN No 5 CML-56 1.97E-01 91 3.30E+00 2.66E+00 3.03E-01 1.23E+01 Pass 1.59E-01 NA NaN No 6 CML-57 1.51E-01 80 2.73E+00 1.41E+00 2.68E-01 1.12E+01 Pass 1.36E-01 NA NaN No 7 CML-58 1.53E-01 118 5.50E+00 4.89E+00 2.69E-01 1.03E+01 Pass 1.37E-01 NA NaN No 8 CML-59 4.12E-01 97 1.13E+01 1.01E+01 4.35E-01 9.17E+00 Pass 1.87E-01 NA NaN No 9 CML-13 1.77E-01 99 2.01E+00 7.69E-01 2.84E-01 3.00E+01 Pass 2.34E-01 homogeneous 2.00E+00 No 10 CML-21 1.29E-01 81 7.30E-01 4.99E-01 2.42E-01 4.16E+01 Pass 1.53E-01 homogeneous 2.00E+00 No 11 CML-23 1.60E-01 191 3.56E+00 3.07E+00 2.58E-01 3.37E+01 Pass 2.47E-01 70 2.00E+00 No 12 CML-26 1.35E-01 52 1.34E+00 4.32E-01 2.50E-01 4.11E+01 Pass 1.40E-01 homogeneous 2.00E+00 No 13 CML-29 4.25E-01 63 1.29E+01 1.45E+01 4.44E-01 1.05E+01 Pass 1.09E-01 NA NaN No 14 CML-30 1.85E-01 226 2.77E+00 4.18E+00 2.78E-01 3.27E+01 Pass 2.68E-01 NA NaN No 15 CML-33 1.86E-01 172 5.18E+00 3.03E+00 2.83E-01 2.72E+01 Pass 2.18E-01 35 2.00E+00 No 16 CML-35 1.84E-01 106 4.45E+00 9.00E-01 2.80E-01 3.03E+01 Pass 2.54E-01 homogeneous 2.00E+00 No 17 CML-36 2.03E-01 255 7.45E+00 2.51E+00 2.93E-01 3.14E+01 Pass 3.14E-01 95 2.00E+00 No 18 CML-43 1.53E-01 106 1.56E+00 8.02E-01 2.61E-01 3.88E+01 Pass 1.83E-01 homogeneous 2.00E+00 No 19 CML-02 1.54E-01 84 1.86E+00 5.93E-01 2.61E-01 3.47E+01 Pass 2.23E-01 homogeneous 2.00E+00 No 20 CML-04 1.72E-01 183 3.43E+00 4.52E+00 2.74E-01 3.35E+01 Pass 2.47E-01 NA NaN No 21 CML-07 1.64E-01 82 1.98E+00 6.86E-01 2.77E-01 3.48E+01 Pass 2.06E-01 homogeneous 2.00E+00 No 22 CML-11 1.85E-01 158 5.40E+00 1.38E+00 2.83E-01 3.14E+01 Pass 2.92E-01 homogeneous 2.00E+00 No 23 CML-48 1.70E-01 186 3.22E+00 1.98E+00 2.71E-01 3.26E+01 Pass 2.36E-01 50 2.00E+00 No 24 CML-49 2.17E-01 205 6.64E+00 4.14E+00 3.12E-01 2.99E+01 Pass 2.89E-01 85 2.00E+00 No 25 CML-51 2.39E-01 166 4.62E+00 1.44E+00 3.29E-01 3.23E+01 Pass 2.80E-01 homogeneous 2.00E+00 No
www.oncotarget.com
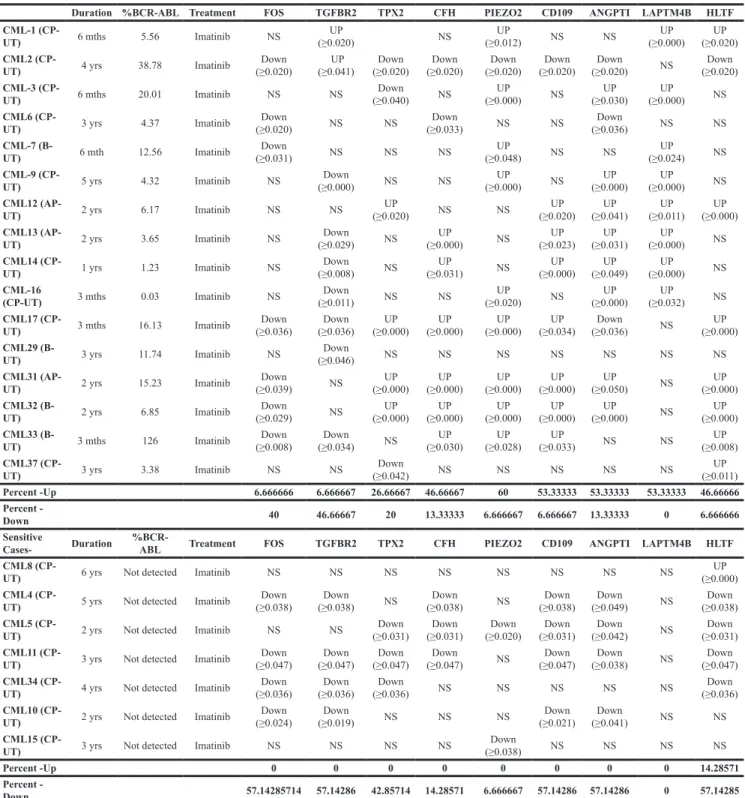
were validated in 23 Imatinib-treated CML cases. The samples were categorized on the basis of major molecular response (>1% and not-detected BCR-ABL copies). FOS and TGFβR2 down-regulated in ~48% of all Imatinib-treated CML cases (Table 4a and 4b). While TPX2 was up-regulated in 21.73% Imatinib-treated cases with >1% BCR-ABL copies and down-regulated or non-significant in most of the Imatinib-treated cases.
LAPTM4B (53.33% cases), PIEZO2 (60% cases), ANGPT1 (53.33% cases), CFH (46.66% cases), CD109 (53.33% cases) and HLTF (46.66% cases) molecule were up-regulated in >1% BCR-ABL copies Imatinib-treated CML cases and 57.14%, 14.28%, 57.14%, 6.66%, 0%, 57.14%, HLTF, CFH, CD109, PIEZO2, LAPTM4B and ANGPT1 respectively down-regulated in not detected BCR-ABL copies (Table 4a and 4b).
Biobank genotyping of CML resistant cases Axiom Biobank genotyping data was analyzed through automated Genotyping Console Software, which includes allele-calling algorithms and user-friendly visualization tools. All analyzed samples passed QC, and 99.571% was the average call rate. An explanation of the SNP metrics summary is provided in Supplementary Table 4. On the basis of gender, 69 samples were from male patients, and 27 samples were from female patients.
pLink software (http://zzz.bwh.harvard.edu/plink/) was used to perform a range of basic, large-scale analyses in a computationally efficient manner. Associations between individual SNPs and CML risk were assessed
using p=0.001 and ORs > 4.0 and 95% CIs derived from logistic regression models.
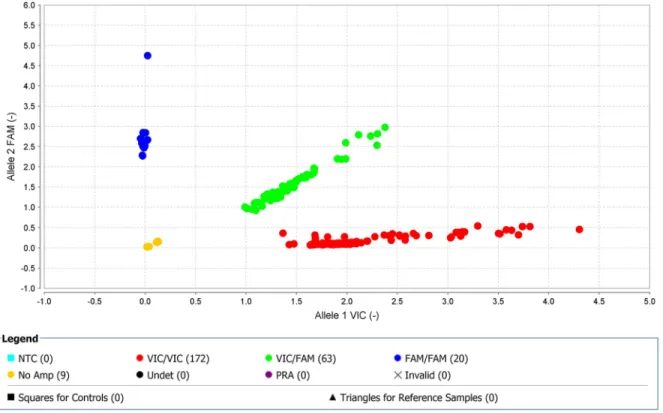
Seventeen SNPs reached genome-wide significance (p=0.001) for TKI-treated CML samples (2 SNPs on chromosome 1, 2 SNPs on chromosome 2, 1 SNP on chromosome 4, 1 SNP on chromosome 5, 4 SNPs on chromosome 6, 1 SNP on chromosome 12, 2 SNPs on chromosome 13, 2 SNPs on chromosome 16, 1 SNP on chromosome 20, and 1 SNP on chromosome 21) (Supplementary Table 5a). Furthermore, regional LD plot was generated for each query SNP (identified through pLink software) through SNAP Proxy search software using r2 threshold=0.8, a distance limit between query and proxy SNP=500, 1000 genomes pilot 1 data-set from the 1000 Genomes Project, which uses phased genotypes for 179 individuals from the HapMap CEU (Utah residents with Northern and Western European ancestry from the CEPH collection), YRI (Yoruba in Ibadan, Nigeria), and JPT+CHB (combined panel of Japanese in Tokyo, Japan and Han Chinese in Beijing, China) panels. From these analyses, rs239798 showed complete correlation with rs9475077, such that r2=1 at a maximum distance of 801 (Supplementary Table 5b). rs12057639 was correlated with rs1327107 (r2=0.934 at a distance of 1, 03, 649) (Supplementary Table 5b). Association plots for rs9475077 and rs12057639 are shown in Supplementary Figure 4a and 4b. Importantly, both rsID239798 (Ch6:54940890) and rsID9475077 (Ch6:54941691) were associated with FAM83B. Hence, we validated rs239798 and rs9475077 with the Taqman genotyping protocol (Figures 4 and 5, Table 5 ) and identified similar allele frequency as observed through Axiom Biobank Array.
Sample Quality Total CN aberrations % LOH Genome % Changed OS-MAPD ndSNPQC OS-CelPair Check Status OS-nd
WavinessSd OS-% Aberr. Cells Ploidy
OS-OS-Low Diploid
Flag 26 CML-24 1.75E-01 295 4.62E+00 3.65E+00 2.69E-01 3.41E+01 Pass 2.84E-01 40 2.00E+00 No 27 CML-01 2.44E-01 197 9.40E+00 5.90E+00 3.18E-01 1.67E+01 Pass 2.74E-01 NA NaN No 28 CML-22 2.40E-01 86 3.80E+00 1.00E+01 3.31E-01 1.82E+01 Pass 1.49E-01 NA NaN No 29 CML-32 2.06E-01 241 7.83E+00 3.12E+00 2.89E-01 2.92E+01 Pass 2.98E-01 65 2.00E+00 No 30 CML-34 4.45E-01 231 1.09E+01 1.26E+01 4.60E-01 2.06E+01 Pass 2.83E-01 NA NaN No 31 CML-37 1.95E-01 135 6.61E+00 1.20E+00 2.83E-01 2.51E+01 Pass 2.73E-01 homogeneous 2.00E+00 No 32 CML-38 2.08E-01 353 5.44E+00 8.73E+00 3.01E-01 3.20E+01 Pass 3.11E-01 NA NaN No 33 CML-47 2.82E-01 153 3.53E+00 1.72E+00 3.56E-01 3.07E+01 Pass 2.86E-01 homogeneous 2.00E+00 No 34 CML- 8 1.94E-01 187 1.04E+01 5.75E+00 2.81E-01 3.04E+01 Pass 3.46E-01 85 2.00E+00 No
www.oncotarget.com
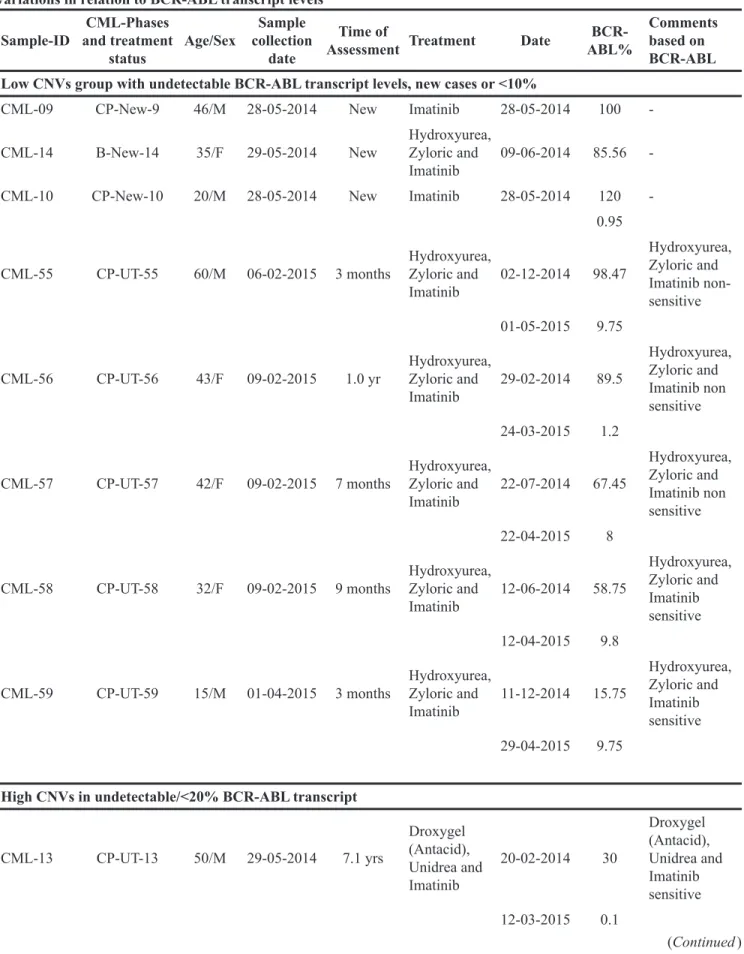
Table 2b: Nexus 7.5 analysed chronic myeloid leukemia samples of different undergoing treatment (Chronic Phase under treatment; CP-UT, accelerated phase under treatment; AP-UT and Blast Phase under treatment; B-UT ) and new cases (Chronic Phase-new; CP-new and Blast new; B-new) cases: clustered on the basis of copy number variations in relation to BCR-ABL transcript levels
Sample-ID and treatment CML-Phases
status Age/Sex
Sample collection
date
Time of
Assessment Treatment Date ABL%
BCR-Comments based on BCR-ABL Low CNVs group with undetectable BCR-ABL transcript levels, new cases or <10%
CML-09 CP-New-9 46/M 28-05-2014 New Imatinib 28-05-2014 100
-CML-14 B-New-14 35/F 29-05-2014 New Hydroxyurea, Zyloric and
Imatinib 09-06-2014 85.56
-CML-10 CP-New-10 20/M 28-05-2014 New Imatinib 28-05-2014 120
-0.95 CML-55 CP-UT-55 60/M 06-02-2015 3 months Hydroxyurea, Zyloric and
Imatinib 02-12-2014 98.47 Hydroxyurea, Zyloric and Imatinib non-sensitive 01-05-2015 9.75
CML-56 CP-UT-56 43/F 09-02-2015 1.0 yr Hydroxyurea, Zyloric and
Imatinib 29-02-2014 89.5 Hydroxyurea, Zyloric and Imatinib non sensitive 24-03-2015 1.2
CML-57 CP-UT-57 42/F 09-02-2015 7 months Hydroxyurea, Zyloric and
Imatinib 22-07-2014 67.45 Hydroxyurea, Zyloric and Imatinib non sensitive 22-04-2015 8
CML-58 CP-UT-58 32/F 09-02-2015 9 months Hydroxyurea, Zyloric and
Imatinib 12-06-2014 58.75 Hydroxyurea, Zyloric and Imatinib sensitive 12-04-2015 9.8
CML-59 CP-UT-59 15/M 01-04-2015 3 months Hydroxyurea, Zyloric and
Imatinib 11-12-2014 15.75 Hydroxyurea, Zyloric and Imatinib sensitive 29-04-2015 9.75
High CNVs in undetectable/<20% BCR-ABL transcript
CML-13 CP-UT-13 50/M 29-05-2014 7.1 yrs Droxygel (Antacid), Unidrea and Imatinib 20-02-2014 30 Droxygel (Antacid), Unidrea and Imatinib sensitive 12-03-2015 0.1 (Continued )
www.oncotarget.com
Sample-ID and treatment CML-Phases
status Age/Sex
Sample collection
date
Time of
Assessment Treatment Date ABL%
BCR-Comments based on BCR-ABL CML-21 CP-UT-21 60/M 05-06-2014 3.8 yrs Droxygel (Antacid), Unidrea and Imatinib 14-11-2013 75 Droxygel (Antacid), Unidrea and Imatinib sensitive 31-07-2014 0.11
CML-23 CP-UT-23 40/M 05-06-2014 2.4 yrs Unidrea and Imatinib,
Nilotinib 31-07-2013 28.35 Unidrea Imatinib and Nilotinib-non-sensitive 13-05-2014 11.9
CML-26 CP-UT-26 32/M 05-06-2014 2.1 yrs Imatinib 26-03-2012 150 Imatinib non-sensitive 10-05-2014 13.6
CML-29 B-UT-29 35F 05-06-2014 1 month Imatinib 04-05-2014 89.12 Imatinib non-sensitive 01-08-2014 15.89
CML-30 CP-New-30 22/M 12-06-2014 - Imatinib 24-06-2014 11 Not known
30-09-2014 12.65
CML-33 AP-UT-33 20/M 28-06-2014 2 yrs Imatinib 24-07-2012 100 Imatinib non-sensitive
27-06-2014 12.18
CML-35 AP-UT-35 28/F 03-07-2014 6.3 yrs Imatinib 24-07-2010 100 Imatinib non-sensitive 13-04-2013 0.02
03-07-2014 8.56
CML-36 CP-UT-36 23/M 03-07-2014 6.10 yrs Hydab and Imatinib 20-02-2010 30 Hydab and Imatinib sensitive 30-10-2014 0.16
CML-43 CP-UT-43 27/M 10-07-2014 7 yrs Initially Hydroxyurea
and Imatinib 23-02-2012 55.89 Hydroxyurea and Imatinib-sensitive 17-06-2014 11.18 14-03-2015 0 CML-24 CP-UT-24 26/F 05-06-2014 8.5 yrs Initially treated with Myeleron, Hydab irocos, Zyloric since may 2005 on Imatinib 24-04-2014 30 Initially treated with Myeleron, Hydab irocos, Zyloric since may 2005 on Imatinib-non-sensitive (Continued )
www.oncotarget.com
Sample-ID and treatment CML-Phases
status Age/Sex
Sample collection
date
Time of
Assessment Treatment Date ABL%
BCR-Comments based on BCR-ABL 21-05-2015 15.85 CML-02 CP-UT-2 50/M 22-05-2014 4 yrs Droxygel (Antacid), Unidrea and Imatinib 14-02-2013 100% Droxygel (Antacid), Unidrea and Imatinib-sensitive 20-03-2014 detected not
CML-04 CP-UT-4 14/M 22-05-2014 1.2 yrs Imatinib 15-07-2013 100 Imatinib sensitive 06-09-2014 detected not
CML-07 CP-UT-7 41/M 22-05-2014 7.2 yrs Imatinib 28-02-2007 100% Imatinib-sensitive 22-07-2014 detected not
CML-11 CP-UT-11 33/F 28-05-2014 4.2 yrs Hydab and Imatinib 21-04-2010 97.54 Hydab and Imatinib sensitive 21-05-2014 detectable Not CML-48 CP-UT48 33/M 31-07-2014 10.4 yrs Initially Hydroxyurea and since December 2004 Imatinib 01-10-2004 100 Initially Hydroxyurea and since December 2004 Imatinib non-sensitive 29-05-2014 9.94
CML-49 Blast-UT-49 15/M 31-07-2014 1.4 yrs Imatinib 06-03-2013 100 Imatinib non-sensitive 30-06-2014 detected not CML-51 CP-UT-51 60/M 31-07-2014 25 yrs Initially treated with Myeleron, Hydab irocos, Zyloric since may 2005 on Imatinib 12-05-2013 30 Initially treated with Myeleron, Hydab irocos, Zyloric since may 2005 on Imatinib non-sensitive 11-06-2014 8.98
CML-01 AP-UT-1 35/M 22-05-2014 1.8 yrs Imatinib 30-08-2012 26 Imatinib sensitive
(Continued )
www.oncotarget.com
DISCUSSION
This study provides evidence to support that, in addition to the BCR-ABL translocation t(9;22) (q34;q11), specific gene abnormalities contribute to the transformation from CML-chronic phase (CML-CP) with no copy number aberrations (CNAs) to CML-blast crisis (CML-BC) in adult and pediatric CML [13–17]. In pediatric CML-BC of lymphoid origin, deletions in IKZF1, PAX5, and/or CDKN2A have been frequently
reported [13, 14]. In adults, Hosoya et al. performed genome-wide screening of DNA in a total of 55 CML patients at different stages using a high-resolution array-based comparative genomic hybridization technique [18]. They identified losses in 2q26.2-q37.3, 5q23.1-q23.3, 5q31.2-q32, 7p21.3-p11.2, 7q31.1-q31.33, 8pter-p12(p11.2), 9p, and 22q13.1-q13.31 and gains in 3q26.2-q29, 6p22.3, 7p15.2-p14.3, 8p12, 8p21.3, 8p23.2, 8q24.13-q24.21, 9q, 19p13.2-p12, and 22q13.1-q13.32 in chronic phase and reported that these alterations occurred
Sample-ID and treatment CML-Phases
status Age/Sex
Sample collection
date
Time of
Assessment Treatment Date ABL%
BCR-Comments based on BCR-ABL High CNVs with BCR-ABL transcript levels >20%
CML-22 AP-UT-22 40/M 05-06-2014 5.2 yrs Hydab and Imatinib 17-11-2013 39.07 Hydab and Imatinib non-sensitive 05-08-2014 20.11 CML-32 AP-UT-32 27/F 12-06-2014 15 yrs Initially treated with Myeleron, Hydab irocos, Zyloric since may 2005 on Imatinib 13-07-2014 55.63 Initially treated with Myeleron, Hydab irocos, Zyloric since may 2005 on Imatinib-non-sensitive 17-11-2014 35.37 CML-34 B-New-34 24/M 12-06-2014 New Imatinib and since February 2015 Nilotinib
20-06-2014 35.63 Imatinib and Nilotinib non-sensitive 27-11-2014 95.37
CML-37 AP-UT-37 27/F 03-07-2014 8 months Imatinib 01-04-2013 100 Imatinib non-sensitive 03-07-2014 50
CML-38 AP-UT-38 60/M 03-07-2014 1.5 yrs Imatinib 29-03-2013 79.01 Imatinib non-sensitive 24-06-2014 35.12
CML-47 B-UT-47 48/M 17-07-2014 3 months Imatinib and 29-05-2014
Uridrea 27-07-2014 40.12
Unidrea and Imatinib non-sensitive 29-10-2014 32.45
CML-08 B-UT-8 24/M 22-05-2014 8 months Imatinib 26-09-2013 100 Imatinib non-sensitive 20-06-2014 26.89
www.oncotarget.com
Table 2c: Aggregate analysis through Nexus 7.5 of low and high copy number variation group in relation to BCR-ABL levels
Low CNVs with undetectable BCR-ABL (TKIs-sensitive) group
Cytoband Location Event P-Value CancerGeneCensus-Sanger.txt
7p15.2 CN Loss 0.001 HOXA9, HOXA11, HOXA13
12q14.1 CN Loss 0.002 CDK4
High CNVs (CN loss)-BCR-ABL dependent and independent (TKIs-non-sensitive) group
Cytoband Location Event P-Value CancerGeneCensus-Sanger.txt
1p36.33 - p36.32 CN Loss 0.007 TNFRSF14 1p36.32 CN Loss 0.007 PRDM16 1p32.1 CN Loss 0.007 JUN 2p24.3 CN Loss 0.002 MYCN 2p23.1 CN Loss 0.002 ALK 2p16.1 CN Loss 0.002 REL 2q13 CN Loss 0.001 PAX8
2q31.1 CN Loss 0.001 HOXD13, HOXD11
5q13.1 CN Loss 0.002 PIK3R1 5q32 CN Loss 0.002 PDGFRB 5q35.1 CN Loss 0.002 NPM1 5q35.2 CN Loss 0.002 NSD1 6p21.33 CN Loss 0.006 POU5F1 7q31.2 CN Loss 0.002 MET 10q11.21 CN Loss 0.001 RET 10q23.31 CN Loss 0.001 PTEN 11p15.5 CN Loss 0.01 HRAS 11q13.3 CN Loss 0.004 CCND1 13q12.2 CN Loss 0.019 CDX2 13q14.2 CN Loss 0.019 RB1 15q24.1 CN Loss 0.001 PML 15q26.1 CN Loss 0.012 IDH2 16p13.3 CN Loss 0.002 TSC2 19p13.3 CN Loss 0.017 STK11 19p13.3 CN Loss 0.017 STK11, TCF3 19q13.2 CN Loss 0.012 AKT2 19q13.2 CN Loss 0.012 CD79A 20q13.32 CN Loss 0.019 GNAS 21q22.11 CN Loss 0.001 OLIG2
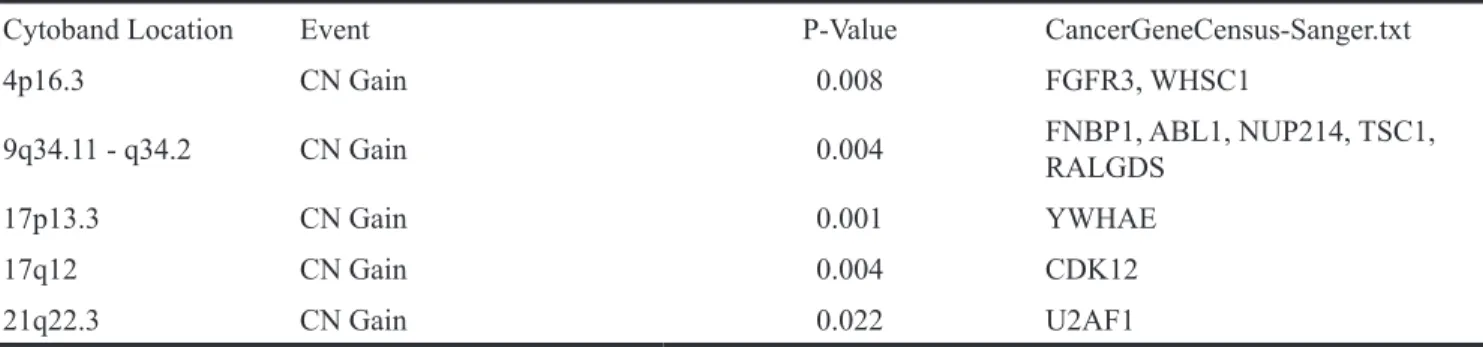
High CNVs (CN gain)-BCR-ABL dependent and independent (TKIs-non-sensitive) group
Cytoband Location Event P-Value CancerGeneCensus-Sanger.txt
1p36.13 CN Gain 0.002 SDHB
www.oncotarget.com
Table 3: Transcriptionally clustered (at the significance level p=0.001 and FDR p=0.0001 and Fold Change<-4 or >4) 13-CML samples (Chronic Phase-new; CP-new and Blast new; B-new and Chronic Phase under treatment; CP-UT) which were also processed for CNVs-profiling
Sample-ID CML-Phases and treatment status Age/ gender Sample collection date Time of Assessment Treatment Date of BCR-ABL assessment BCR-ABL percentage Comments based on BCR-ABL
CML-10 CP-New-10 20/M 28-05-2014 New Imatinib 28-05-2014 120 Not known
06-02-2015 0.95 CML-02 CP-UT-2 50/M 22-05-2014 4 yrs Initially with Droxygel (Antacid), Unidrea and later with Imatinib 14-02-2013 100% Initially with Droxygel (Antacid), Unidrea and later with Imatinib-sensitive (TKI- sensitive) 20-03-2014 0.12
CML-04 CP-UT-4 14/M 22-05-2014 1.2 year Imatinib 15-03-2013 100 Imatinib sensitive (TKI- sensitive) 06-09-2014 0.95 Cluster-II CML-13 CP-UT-13 50/M 29-05-2014 7.1 yrs Droxygel (Antacid), Unidrea and Imatinib 20-02-2014 30 Droxygel (Antacid), Unidrea and Imatinib sensitive (TKI- sensitive) 12-03-2015 0.1 CML-21 CP-UT-21 60/M 05-06-2014 3.8 yrs Droxygel (Antacid), Unidrea and Imatinib 14-11-2013 75 Droxygel (Antacid), Unidrea and Imatinib sensitive (TKI-sensitive) (Continued )
Cytoband Location Event P-Value CancerGeneCensus-Sanger.txt
4p16.3 CN Gain 0.008 FGFR3, WHSC1
9q34.11 - q34.2 CN Gain 0.004 FNBP1, ABL1, NUP214, TSC1, RALGDS
17p13.3 CN Gain 0.001 YWHAE
17q12 CN Gain 0.004 CDK12
21q22.3 CN Gain 0.022 U2AF1
High CNVs (CN gain)-BCR-ABL dependent and independent (TKIs-non-sensitive) group
www.oncotarget.com Sample-ID CML-Phases and treatment status Age/ gender Sample collection date Time of Assessment Treatment Date of BCR-ABL assessment BCR-ABL percentage Comments based on BCR-ABL 31-07-2014 0.11 CML-36 CP-UT-36 23/M 03-07-2014 6.10 yrs Initially Hydab and presently on Imatinib 20-02-2010 30 Initially Hydab and Imatinib sensitive (TKI- sensitive) 30-10-2014 0.11
CML-11 CP-UT-11 33/F 28-05-2014 4.2 yrs Hydab and Imatinib 21-04-2010 97.54 Hydab and Imatinib (TKI-sensitive) 21-05-2014 detectable Not
Cluster-III
CML-55 CP-UT-55 60/M 06-02-2015 3 months Hydroxyurea, Zyloric and
Imatinib 02-12-2014 98.47 Hydroxyurea, Zyloric and Imatinib non- sensitive 01-05-2015 9.75
CML-56 CP-UT-56 43/F 09-02-2015 1.0 yr Hydroxyurea, Zyloric and
Imatinib 29-02-2014 89.5 Hydroxyurea, Zyloric and Imatinib sensitive 24-03-2015 1.2
CML-58 CP-UT-58 32/F 09-02-2015 9 months Hydroxyurea, Zyloric and
Imatinib 12-04-2015 58.75 Hydroxyurea, Zyloric and Imatinib sensitive 12-04-2015 9.8
CML-57 CP-UT-57 42/F 09-02-2015 7 months Hydroxyurea, Zyloric and
Imatinib 22-07-2014 67.45 Hydroxyurea, Zyloric and Imatinib non-sensitive 22-04-2015 8
CML-59 CP-UT-59 15/M 01-04-2015 3 months Hydroxyurea, Zyloric and
Imatinib 11-12-2014 15.75 Hydroxyurea, Zyloric and Imatinib non-sensitive 29-04-2015 9.75
CML-14 B-New-14 35/F 29-05-2014 New Hydroxyurea, Zyloric and
Imatinib 09-06-2014 85.56 Not known
www.oncotarget.com
at a higher frequency in AP and blast crisis [18]. Another study by Brazma et al. [19] reported losses at 1p36, 5q21, and 9p21 and gains at 1q, 8q24, 9q34, 16p, and 22q11 after genome-wide screening at a resolution of 1 Mb among 54 samples at different stages of CML together with 12 CML cell lines. Furthermore, Mullighan et al. [20] found higher CNAs in CML-AP and CML-BC of lymphoid origin (1.14 and 7.8, respectively) compared to CML-CP (0.47) using SNP array analysis of 34 adult CML cases [20].
Compared to the references described above [18–20] in undetectable-BCR-ABL-TKI-sensitive group, we similarly observed the previously reported loss of 7p15.2-HOXA9, HOXA11, and HOXA13. In BCR-ABL-dependent/independent TKI-non-sensitive group, we also observed the previously reported loss of 1p36 (TNFRSF14, PRDM16), 2q31.1 (HOXD13,
HOXD11), 5q32(PDGFRB), and 7q31.2 (MET) and gain of 9q34.11-q34.2 (FNBP1, ABL1, NUP214, TSC1, and RALGDS genes (Table 2b and 2c). Hence, through above references and our study, we conclude that CNAs were absent in CML-CP-New and CML-CP-UT-TKI-sensitive cases. However, these reported variations were relatively common in samples at progressed stages and TKI-non-sensitive cases. These observations support the notion that the BCR-ABL fusion protein is sufficient to induce CML, but additional genomic changes are required for disease progression and play important roles in resistance to TKI [13–17].
Further, genome-wide transcriptomics have also provided insight into the mechanisms of distinction between CP and BC, progression and resistance of CML on the whole blood of different phases of CML-patients, cell
Figure 2: Hierarchical clustering of 13 CML samples (TKI-sensitive cases and TKI resistant cases) common between transcriptomics and CNV analysis were compared to control using the same filter criteria as for all CML cases and control at p=0.01.
www.oncotarget.com
lines, leukemia stem cells, and normal stem and progenitor cell populations [6, 10, 17] Radich et al. [6] showed an association of decreased expression of Jun B and Fos with other deregulated pathways with early accelerated phase and identified 6 genes (NOB1, DDX47, IGSF2, LTB4R, SCARB1, and SLC25A3) that discriminated CP from BC [6]. Later, Wang et al. [17] reported over-expression of early erythroid-related factors [9, 21] transcription factors and activation of proliferative markers like ERK/MAPK, JAK-STAT, and ErbB pathways in K562 cell line [22]. Gerber et al. [10] performed genome-wide transcriptome analysis of CML leukemia stem cells and normal stem and progenitor cell populations using exon arrays. They identified 97 genes that were differentially expressed in CML versus normal stem and progenitor cells. These
included significantly up-regulated cell surface genes and genes involved in oxidative metabolism, DNA repair pathways and the activation of inflammatory cytokines. They also observed down-regulation of pro-differentiation and TGF-β/BMP signaling pathways [10]. However, methylation and down-regulation of 897 genes including tumor-suppressor genes or regulators of cell proliferation were observed during disease progression, i.e., conversion of CP to AP/Blast [23].
We also identified up-regulation of highly significant proliferative (24 genes in the RB pathway, ARG1 and CDK1), cell cycle (6 genes involved in G1 to S cell cycle control and 12 genes involved in Mitotic G1-G1/S phases), replicative (8 genes involved in DNA replication) and DNA repair markers (9 genes involved
Figure 3: PCA plot between Cluster III (TKI-sensitive cases) and Cluster I+II (TKI resistant cases) at exonic-level using specific splicing index filter criteria [(1.) Exon Splicing Index (linear) < -4 or Exon Splicing Index (linear and exon expressed in atleast one condition) >4; 2.) ANOVA Exon p value < 0.001; Exon FDR p value <0.001. 3.) Gene fold change (linear and expressed in both conditions) < -5 or Gene fold change (linear) > 5], 0.01% coding-genes passed filter criteria.
www.oncotarget.com
in DNA repair) and down-regulation of several genes related to the immune system (10 genes involved in allograft rejection and 12 genes involved in the Vitamin D receptor pathway), TCR signaling, TGF-beta signaling (FOS, FOSB, TGFBR2, ETS1, JUNB, and LIMK2) and chemokine signaling pathway (CCR6, CCR4, CCR7,
CX3CR1, XCL1, CXCL16, JAK3, LYN, ITK, and TIAM1) (Supplementary Table 2) in all drug-treated CML samples when compared against control.
At the exon level, high splicing index affected the dysregulation of normal cellular processes in drug-treated CML cases, including up-regulation of Myeloperoxidase
Table 4: Validation of (array-based) FOS, TGFβR2, TPX2, LAPTM4B, PIEZO2, ANGPT1, CFH, CD109 and HLTF transcripts by differential expression analysis in >1% and not detected %BCR-ABL 23 Imatinib-treated CML cases using beta actin and 18s ribosomal house-keeping gene as reference
Duration %BCR-ABL Treatment FOS TGFBR2 TPX2 CFH PIEZO2 CD109 ANGPTI LAPTM4B HLTF CML-1
(CP-UT) 6 mths 5.56 Imatinib NS (≥0.020)UP NS (≥0.012)UP NS NS (≥0.000)UP (≥0.020)UP
CML2
(CP-UT) 4 yrs 38.78 Imatinib (≥0.020)Down (≥0.041) UP (≥0.020)Down (≥0.020)Down (≥0.020)Down (≥0.020)Down (≥0.020)Down NS (≥0.020)Down
CML-3
(CP-UT) 6 mths 20.01 Imatinib NS NS (≥0.040)Down NS (≥0.000)UP NS (≥0.030)UP (≥0.000)UP NS
CML6
(CP-UT) 3 yrs 4.37 Imatinib (≥0.020)Down NS NS (≥0.033)Down NS NS (≥0.036)Down NS NS
CML-7
(B-UT) 6 mth 12.56 Imatinib (≥0.031)Down NS NS NS (≥0.048)UP NS NS (≥0.024)UP NS
CML-9
(CP-UT) 5 yrs 4.32 Imatinib NS (≥0.000)Down NS NS (≥0.000)UP NS (≥0.000)UP (≥0.000)UP NS
CML12
(AP-UT) 2 yrs 6.17 Imatinib NS NS (≥0.020)UP NS NS (≥0.020)UP (≥0.041)UP (≥0.011)UP (≥0.000)UP
CML13
(AP-UT) 2 yrs 3.65 Imatinib NS (≥0.029)Down NS (≥0.000)UP NS (≥0.023)UP (≥0.031)UP (≥0.000)UP NS
CML14
(CP-UT) 1 yrs 1.23 Imatinib NS (≥0.008)Down NS (≥0.031)UP NS (≥0.000)UP (≥0.049)UP (≥0.000)UP NS
CML-16
(CP-UT) 3 mths 0.03 Imatinib NS (≥0.011)Down NS NS (≥0.020)UP NS (≥0.000)UP (≥0.032)UP NS
CML17
(CP-UT) 3 mths 16.13 Imatinib (≥0.036)Down (≥0.036)Down (≥0.000)UP (≥0.000)UP (≥0.000)UP (≥0.034)UP (≥0.036)Down NS (≥0.000)UP
CML29
(B-UT) 3 yrs 11.74 Imatinib NS (≥0.046)Down NS NS NS NS NS NS NS
CML31
(AP-UT) 2 yrs 15.23 Imatinib (≥0.039)Down NS (≥0.000)UP (≥0.000)UP (≥0.000)UP (≥0.000)UP (≥0.050)UP NS (≥0.000)UP
CML32
(B-UT) 2 yrs 6.85 Imatinib (≥0.029)Down NS (≥0.000)UP (≥0.000)UP (≥0.000)UP (≥0.000)UP (≥0.000)UP NS (≥0.000)UP
CML33
(B-UT) 3 mths 126 Imatinib (≥0.008)Down (≥0.034)Down NS (≥0.030)UP (≥0.028)UP (≥0.033)UP NS NS (≥0.008)UP
CML37
(CP-UT) 3 yrs 3.38 Imatinib NS NS (≥0.042)Down NS NS NS NS NS (≥0.011)UP
Percent -Up 6.666666 6.666667 26.66667 46.66667 60 53.33333 53.33333 53.33333 46.66666 Percent -
Down 40 46.66667 20 13.33333 6.666667 6.666667 13.33333 0 6.666666
Sensitive
Cases- Duration %BCR-ABL Treatment FOS TGFBR2 TPX2 CFH PIEZO2 CD109 ANGPTI LAPTM4B HLTF CML8
(CP-UT) 6 yrs Not detected Imatinib NS NS NS NS NS NS NS NS (≥0.000)UP
CML4
(CP-UT) 5 yrs Not detected Imatinib (≥0.038)Down (≥0.038)Down NS (≥0.038)Down NS (≥0.038)Down (≥0.049)Down NS (≥0.038)Down
CML5
(CP-UT) 2 yrs Not detected Imatinib NS NS (≥0.031)Down (≥0.031)Down (≥0.020)Down (≥0.031)Down (≥0.042)Down NS (≥0.031)Down
CML11
(CP-UT) 3 yrs Not detected Imatinib (≥0.047)Down (≥0.047)Down (≥0.047)Down (≥0.047)Down NS (≥0.047)Down (≥0.038)Down NS (≥0.047)Down
CML34
(CP-UT) 4 yrs Not detected Imatinib (≥0.036)Down (≥0.036)Down (≥0.036)Down NS NS NS NS NS (≥0.036)Down
CML10
(CP-UT) 2 yrs Not detected Imatinib (≥0.024)Down (≥0.019)Down NS NS NS (≥0.021)Down (≥0.041)Down NS NS
CML15
(CP-UT) 3 yrs Not detected Imatinib NS NS NS NS (≥0.038)Down NS NS NS NS
Percent -Up 0 0 0 0 0 0 0 0 14.28571
Percent -
Down 57.14285714 57.14286 42.85714 14.28571 6.666667 57.14286 57.14286 0 57.14285
www.oncotarget.com
Figure 4: With high-quality threshold the each sample is clustered on the basis of genotype call. Here the cluster observed shows the presence of FAM-labelled allele-2 (C) in all samples in rs239798. The yellow spots are the negative controls.
Figure 5: With high-quality threshold the each sample is clustered on the basis of genotype call. Here the cluster observed shows the presence of FAM-labelled allele-2 (A) in all samples in rs9475077. The yellow spots are the negative controls.
www.oncotarget.com
(MPO)-induced neutrophil degranulation affecting the innate immune system [24], TPX2 up-regulation, suggesting inhibition of TP53 transcriptional activity [25, 26], and TYMS, suggesting CML cells are more within the G1/S transition through more formation of TMP and dihydrofolate. Overall, these three factors affected the up-regulation of cell cycle (Reactome Analysis). Further, down-regulation of SKAP1 (Src Kinase Associated Phosphoprotein 1), ITK and TGFBR2 and FOS in CML cases led to down-regulation of the TCR signaling and immune system pathways Additionally, the Src-family kinases (SFKs) have been implicated in BCR-ABL signaling and in the progression of CML [27]. ITK and FOS are involved in the down-regulation of TCR signaling and immune system, respectively, as reported by [6, 10]. On validation in more samples, FOS and TGFBR2 were down-regulated in ~ fifty percent cases and were independent of major molecular response. Contrarily, TPX2 was up-regulated in cases with >1% BCR-ABL copies further validate suppression of TP53 transcriptional activity in resistance [25, 26].
Further, CML-resistant versus -sensitive cases at the exon level, due to high splicing index, nine genes were differentially expressed. Out of which six genes were further validated in additional resistant (>1% BCR-ABL copies in CML-CP-UT, CML-AP-UT, CML-B-UT,) and sensitive (undetectable levels BCR-ABL copies in CML-CP-UT) cases. These genes showed specific involvement of Tie2 (Supplementary Figures 1 and 2) and Basigin-transmembrane glycoprotein (Supplementary Figure 3) in Imatinib-resistant CML cases as reported previously [11, 12]. Tie-2 receptor tyrosine kinase and its ligand ANGPT1 are involved in CML progression or resistance [28]. Basigin also plays important role in tumor invasion, as it is co-expressed in the presence of high lactate and
has been reported as a poor prognostic indicator in GIST [35] and imatinib-resistant indicator in CML cells [29]. Amplification of LAPTM4B, which contributes to chemotherapy resistance and recurrence of breast cancer [30, 31] and other solid tumors [32] was over-expressed in our TKI-resistant CML cases. Additionally, inactive EGFR complexes with LAPTM4B recruits Sec5exocyst sub complex which binds to autophagy inhibitor and activates autophagy [33]. Up-regulation of HLTF is associated with tumor progression in hypopharyngeal and cervical cancers [34, 35] was over-expressed in our TKI-resistant CML cases. Recently, Cipolla et al [36] suggested that HLTF repairs DNA damage by acting as a ubiquitin ligase caused by drug-induced reactive oxygen species, leading to resistance [36] and also modulates lysosomal autophagy [37]. CD109 regulates TGF-β receptor endocytosis and degradation to inhibit TGF-β signaling [38] and over-expression of CD109 in Imatinib resistant cases may further down-regulate TGF- β signaling. CFH co-factor for complement factor 1 inhibits C3 activation cascade in alternative pathway by promoting cleavage of C3b to iC3b-over-expression has been reported in cutaneous squamous cell carcinoma cells [39]. Expression of CFH help in immune escape and it has been documented in malignant ovarian and bladder cancers [40]. CFH also controls the stemness of liver cancer cells [41]. PIEZO2 which has been proposed as biomarker for CML stem cells [8] was also over-expressed in our Imatinib resistant cases.
Analysis of CML patients in the chronic phase and under treatment (CML-CP-UT) with BCR-ABL10-77.02% as identified through the genotyping array, which has been designed for a broad range of applications to give us complete flexibility both for identification of genotypic markers and to explore the complexity of diseases [42, 43], we found that rsID239798
Table 5: Genotyping of rs2854344 and rs9475077 through unlabeled PCR primers and TaqMan® MGBprobes
(FAM ™ and VIC® dye-labeled in 40X assay mix
rs239798
Population FrequencyAllele 1
Allele 2 Frequency (Minor Allele Frequency-C)
1/1 Frequency Frequency1/2 Frequency2/2 SquaredChi- P-Value
CML 0.728395062 0.27160494 0.5617284 0.333333333 0.10493827 4.021168 0.044937 Control 0.933333333 0.06666667 0.9 0.066666667 0.03333333 19.40051 0 rs9475077 Population Allele 1 Frequency (Minor Allele Frequency-A) Allele 2
Frequency 1/1 Frequency Frequency1/2 Frequency2/2 SquaredChi- P-Value
CML 0.282978723 0.71702128 0.1021277 0.361702128 0.53617021 2.775499 0.045747
www.oncotarget.com
Table 6: Chronic myeloid leukemia - clinical presentation showing different phases without (Chronic Phase-new; CP-new and Blast Phase-new; B-new) and with (Chronic Phase under treatment; CP-UT, accelerated phase under treatment; AP-UT and Blast Phase under treatment; B-UT ) treatment for the samples being processed for copy number variations and transcriptomics analysis
Sample ID Age/Sex Sample collection date Time of Assessment Date disease initiated Follow up date Treatment Date of BCR-ABL detection BCR-ABL% Comments based on BCR-ABL 1 9 46/M 28-05-2014 New 28-05-2014 28-05-2015 Imatinib 28-05-2014 100 -2 10 20/M 28-05-2014 New 28-05-2014 30-03-2015 Imatinib 28-05-2014 120 -06-02-2015 0.95 -3 30 22/M 12-06-2014 New 24-06-2014 24-06-2014 Imatinib 24-06-2014 100 -30-09-2014 12.65 4 73 50/M 22-04-2015 New 25-04-2015 29-04-2015 Imatinib 25-04-2015 73.8 -5 83 70/M 27-04-2015 New 18-04-2015 01-05-2015 Imatinib 18-04-2015 77.02
-Chronic myeloid Leukemia--Chronic Phase Under Treatment (CML-CP-UT) Sample No Age/Sex Sample collection date Time of Assessment Date disease initiated Follow up date Treatment Date of BCR-ABL detection BCR-ABL% Comments based on BCR-ABL 6 2 50/M 22-05-2014 4 yrs 10-06-2010 20-03-2014 Droxygel (Antacid), Unidrea and Imatinib 14-02-2013 100% Initially with Droxygel (Antacid), Unidrea and later with Imatinib sensitive 20-03-2014 detected not
7 4 14/M 22-05-2014 10 months 04-07-2013 20-04-2015 Imatinib 15-07-2013 100 Imatinib sensitive
06-09-2014 detected Not 18-03-2015 81.88
8 6 24/M 22-05-2014 7 months 21-11-2013 22-06-2015 Imatinib 21-11-2013 75 Imatinib sensitive 17-06-2014 0.09
9 7 41/M 22-05-2014 7.2 yrs 29-03-2007 21-05-2015 Imatinib 28-02-2007 100% Imatinib sensitive
22-07-2014 Detected not
10 11 33/F 28-05-2014 4.2 yrs 21-05-2014 23-04-2015 Hydab and Imatinib 21-04-2010 97.54
21-05-2014 Detectednot Hydab and Imatinib sensitive 11 13 50/M 29-05-2014 7.1 yrs 26-04-2007 06-07-2015 Droxygel (Antacid), Unidrea and Imatinib 20-02-2014 30 Droxygel (Antacid), Unidrea and Imatinib sensitive 12-03-2015 0.1
12 16 30/M 29-05-2014 10 months 23-03-2015 19-03-2015 Imatinib 23-05-2014 43.2 Imatinib non-sensitive (Continued )
www.oncotarget.com Sample ID Age/Sex Sample collection date Time of Assessment Date disease initiated Follow up date Treatment Date of BCR-ABL detection BCR-ABL% Comments based on BCR-ABL 19-03-2015 35 13 20 33/F 05-06-2014 1 month 21-05-2014 05-06-2014 Imatinib 21-05-2014 97.54 NA 14 21 60/M 05-06-2014 3.8 yrs 09-09-2010 11-06-2015 Droxygel (Antacid), Unidrea and Imatinib 14-11-2013 75 Droxygel (Antacid), Unidrea and Imatinib-sensitive 31-07-2014 0.11
15 23 40/M 05-06-2014 2.4 yrs 24-02-2012 05-06-2014 Unidrea and Imatinib,
Nilotinib 31-07-2013 28.35 Unidrea and Imatinib, Nilotinib-non-sensitive (TKI non sensitive) 13-05-2014 11.9 16-02-2015 16.53 16 24 26/F 05-06-2014 8.5 yrs 05-01-2006 21-05-2015 Initially treated with Myeleron, Hydab irocos, Zyloric since may 2005 on Imatinib 24-04-2014 30 Initially treated with Myeleron, Hydab irocos, Zyloric since may 2005 on Imatinib non-sensitive 21-05-2015 15.85
17 26 32/M 05-06-2014 2.1 yrs 10-05-2012 22-09-2014 Imatinib 26-03-2012 100 Imatinib non-sensitive 10-05-2014 13.6
18 36 23/M 03-07-2014 6.10 yrs 08-09-2007 07-05-2015 Hydab and Imatinib 20-02-2010 30 Hydab and Imatinib-sensitive 30-10-2014 detected not
19 43 27/M 10-07-2014 7 yrs 21-07-2007 Initially Hydroxyurea
and Imatinib 23-02-2012 55.89 Imatinib non-sensitive 17-06-2014 11.18 14-03-2015 0 20 48 33/M 31-07-2014 10.4 yrs 16-03-2004 18-09-2014 Initially Hydroxyurea and since December 2004 Imatinib
01-10-2004 100 Imatinib non-sensitive
07-03-2013 60 05-09-2013 41.1 03-09-2013 41.41 29-05-2014 9.94
21 50 21/M 31-07-2014 4.3 yrs 01-04-2010 18-09-2014 Imatinib 20-11-2013 23.3 Imatinib non-sensitive 13-08-2014 10.12
(Continued )
www.oncotarget.com Sample ID Age/Sex Sample collection date Time of Assessment Date disease initiated Follow up date Treatment Date of BCR-ABL detection BCR-ABL% Comments based on BCR-ABL 22 51 60/M 31-07-2014 25 year Initially treated with Myeleron, Hydab irocos, Zyloric since may 2005 on Imatinib 12-05-2013 30 Initially treated with Myeleron, Hydab irocos, Zyloric since may 2005 on Imatinib non-sensitive 11-06-2014 8.98
23 52 40/M 31-07-2014 4.3 yrs 01-04-2010 31-07-2014 Imatinib 10-04-2010 100 Imatinib non-sensitive 01-07-2014 18
24 53 24/M 08-01-2015 3.1 yrs 08-12-2011 08-01-2015 Imatinib 08-12-2011 100 Imatinib non-sensitive 22-02-2015 17.23
25 54 28/M 06-02-2015 4.4 yrs 15-10-2010 22-12-2014 Imatinib 15-05-2014 100 Imatinib non-sensitive 06-11-2014 40.4
26 55 60M 06-02-2015 3 months 02-12-2014 01-05-2015 Hydroxyurea, Zyloric and
Imatinib 02-12-2014 98.47 Hydroxyurea, Zyloric and Imatinib-non- sensitive 01-05-2015 9.75
27 56 43F 09-02-2015 1.0 yr 29-02-2014 24-03-2015 Hydroxyurea, Zyloric and
Imatinib 29-02-2014 89.5 Hydroxyurea, Zyloric and Imatinib non- sensitive 24-03-2015 1.2
28 57 42F 09-02-2015 7 months 22-07-2014 22-04-2015 Hydroxyurea, Zyloric and
Imatinib 22-07-2014 67.45 Hydroxyurea, Zyloric and Imatinib non- sensitive 22-04-2015 8
29 58 32/F 09-02-2015 9 months 12-04-2015 12-04-2015 Hydroxyurea, Zyloric and
Imatinib 12-04-2015 58.75 Hydroxyurea, Zyloric and Imatinib non- sensitive 12-04-2015 9.8
30 59 15/M 01-04-2015 3 months 10-12-2014 13-04-2015 Hydroxyurea, Zyloric and
Imatinib 11-12-2014 15.75 Hydroxyurea, Zyloric and Imatinib non- sensitive 29-04-2015 9.75
31 60 29/F 09-04-2015 4.5 yrs 28-12-2010 Imatinib 08-04-2011 18 Imatinib non-sensitive 24-02-2015 16
32 61 26/F 09-04-2015 9.4 yrs 18-12-2005 Imatinib 08-04-2011 18% Imatinib non-sensitive (Continued )
www.oncotarget.com Sample ID Age/Sex Sample collection date Time of Assessment Date disease initiated Follow up date Treatment Date of BCR-ABL detection BCR-ABL% Comments based on BCR-ABL 24-02-2014 BCR-ABL positive in 200 cells
33 63 37/M 09-04-2015 7 months 21-08-2014 09-04-2015 Imatinib 21-08-2014 100 Imatinib non-sensitive 09-04-2015 80 34 65 43/M 20-04-2015 7.9 yrs 29-06-2007 22-04-2015 Imatinib 24-06-2014 18.95 Imatinib non-sensitive, however, nilotinib sensitive 22-04-2015 4.63
35 66 30/F 20-04-2015 4.4yrs 15-05-2010 22-12-2014 Imatinib 15-05-2014 100 Imatinib non-sensitive 06-01-2015 40.4 36 67 52/M 16-04-2015 6.1 yrs 21-02-2009 01-06-2015 Initially Hydab, Uridrea and since october 2012 Imatinib 15-04-2014 20 Initially Hydab, Uridrea and since october 2012 Imatinib-non-sensitive 01-06-2015 18.63
37 68 28/M 16-04-2015 4 months 01-11-2014 08-06-2015 Imatinib 22-09-2014 45.2 Imatinib non-sensitive 22-04-2015 16.1 38 71 52/M 16-04-2015 8.1 yrs 21-02-2007 21-06-2015 Initially Hydab, Uridrea and since october 2012 Imatinib 15-04-2014 20 Initially Hydab, Uridrea and since october 2012 Imatinib non-sensitive 22-06-2015 8.63 39 75 20/M 27-04-2015 2.1 yrs 02-03-2013 02-05-2015 Initially Hydab, Uridrea and since march 2013 Imatinib 02-03-2013 100 Initially Hydab, Uridrea and since march 2013 Imatinib non-sensitive 01-04-2015 20
40 77 25/M 27-04-2015 7.2 yrs 19-02-2008 03-05-2015 Imatinib 19-02-2008 80 Imatinib non-sensitive 03-04-2015 8
41 78 30/F 27-04-2015 3.1 yrs 21-03-2013 03-05-2015 Imatinib 28-10-2013 74.91 Imatinib non-sensitive 10
42 79 45/M 27-04-2015 2.3 yrs 17-01-2013 27-04-2015 Imatinib 10-01-2013 110 Imatinib non-sensitive 04-03-2015 39.09
(Continued )