RESEARCH ARTICLE
Polarization sensitivity as a visual contrast enhancer in the
Emperor dragonfly larva,
Anax imperator
Camilla R. Sharkey1,*, Julian C. Partridge2and Nicholas W. Roberts1
ABSTRACT
Polarization sensitivity (PS) is a common feature of invertebrate visual systems. In insects, PS is well known for its use in several different visually guided behaviours, particularly navigation and habitat search. Adult dragonflies use the polarization of light to find water but a role for PS in aquatic dragonfly larvae, a stage that inhabits a very different photic environment to the adults, has not been investigated. The optomotor response of the larvae of the Emperor dragonfly, Anax imperator Leach 1815, was used to determine whether these larvae use PS to enhance visual contrast underwater. Two different light scattering conditions were used to surround the larval animals: a naturalistic horizontally polarized light field and a non-naturalistic weakly polarized light field. In both cases these scattering light fields obscured moving intensity stimuli that provoke an optokinetic response in the larvae. Animals were shown to track the movement of a square-wave grating more closely when it was viewed through the horizontally polarized light field, equivalent to a similar increase in tracking ability observed in response to an 8% increase in the intensity contrast of the stimuli. Our results suggest that larval PS enhances the intensity contrast of a visual scene under partially polarized lighting conditions that occur naturally in freshwater environments.
KEY WORDS: Polarization vision, Optomotor response, Turbidity, Rayleigh scattering, Odonata
INTRODUCTION
Amongst insects, polarization sensitivity (PS) plays an important role in navigation where it is mediated by the highly specialized visual photoreceptors located in the dorsal rim area (DRA) of the compound eye, these photoreceptors being used to detect polarized patterns in skylight (Labhart and Meyer, 1999; Homberg et al., 2011). Some species also use polarization signals for mate recognition (Sweeney et al., 2003) or to aid the detection of food sources (Kelber et al., 2001; Foster et al., 2014). The ventral short-wave sensitive photoreceptors of many water-seeking insects can be polarization sensitive and are used to detect and approach horizontally polarized light reflected from water bodies, a behaviour termed positive polarotaxis (Schwind, 1991, 1995; Lerner et al., 2008; Kriska et al., 2009).
Adult dragonflies (Odonata: Aeshnidae) have a polarization sensitive DRA (Meyer and Labhart, 1993) as well as ventrally directed PS that is mediated by photoreceptors in the ventral part of
the compound eyes (Laughlin, 1976; Laughlin and McGinness, 1978). Electrophysiological studies have shown that these regions are both maximally sensitive to short wavelengths: the UV in
Hemicordulia tau, and the ‘blue’ region of the spectrum in
Hemianax papuensis (Laughlin, 1976). Positive polarotaxis has
been demonstrated behaviourally in odonates, indicating that the polarization of light is an important visual cue for locating suitable freshwater sites, which are extensively used for mating (Kriska et al., 2009) and oviposition (Horváth et al., 1998, 2007; Kriska et al., 2009). Compound eye-mediated PS in terrestrial adult odonates may be limited to navigational and water-seeking tasks, although it is possible it is also used in other contexts. Aeshnid dragonfly larvae are also highly dependent on vision and, like adults, possess large compound eyes (Corbet, 2004). Despite this, little research attention has been paid to the visual adaptations of dragonfly larvae, particularly in the context of their natural underwater environment.
The photic environment of aquatic dragonfly larvae differs considerably from that experienced by the adult animals. Larvae inhabit slow-moving streams or ponds where there are often high levels of light scattering and spectral attenuation due to turbidity and the presence of dissolved organic matter that absorbs strongly at short wavelengths (Lythgoe, 1979; Davies-Colley and Vant, 1987; Markager and Vincent, 2000). Light underwater can also become partially polarized depending on its interaction with suspended particles smaller than the wavelength of light and the direction of entry from the aerial hemisphere via Snell’s window (Horváth and Varjú, 1995). The degree of polarization has been measured in freshwater at ca. 35% at midday and up to 67% at crepuscular periods when the sun is near the aerial horizon (Novales Flamarique and Hawryshyn, 1997). The predominant angle of polarization of light underwater is predictable, and when the sun is close to its zenith, at solar midday, or the sky is overcast, the angle of polarization is predominately horizontal (i.e. parallel to the water surface) (Novales Flamarique and Hawryshyn, 1997). On clear days, polarization angle changes depending on the position of the sun, with a maximum deviation from the horizontal, in directions perpendicular to the direction of the sun, of approximately 48.5 deg occurring at sunset or sunrise when the sun is at the terrestrial horizon (Hawryshyn, 1992; Waterman, 2006).
Scattering of light that occurs underwater between a viewer and an object, often called veiling light, degrades the visual contrast between an object and its background. A proportion of this scattered light is polarized at one predominant angle, due to Rayleigh scattering from sub-wavelength particles present in the water. Thus, the intensity contrast of the scene can be increased by selectively filtering the polarized component of the scattered light (Lythgoe and Hemmings, 1967; Schechner and Karpel, 2005). Visual PS has been shown in several aquatic animals. It has been suggested that PS may have evolved because of the advantages that can be gained by processing out naturally occurring underwater linearly polarized Received 18 March 2015; Accepted 25 August 2015
1
School of Biological Sciences, Bristol Life Sciences Building, Tyndall Avenue, University of Bristol, Bristol BS8 1TQ, UK.2School of Animal Biology and the Oceans Institute, Faculty of Science, University of Western Australia, 35 Stirling Highway, (M317), Crawley, Western Australia 6009, Australia.
*Author for correspondence (camilla.r.sharkey@gmail.com)
Journal
of
Experimental
light, improving visual contrast. Such processing could, for instance, significantly enhance the visual contrast of prey and predators seen against their background. A range of different behavioural experiments have been carried out on diverse marine aquatic animals including octopus (Shashar and Cronin, 1996), cuttlefish (Shashar et al., 2000; Temple et al., 2012; Cartron et al., 2013), squid (Shashar et al., 1998; Pignatelli et al., 2011) and stomatopods (Marshall et al., 1999; How et al., 2014), and although each study set out with a different aim, all demonstrated the potential for PS to enhance object detection underwater. Such ability also has clear adaptive potential for freshwater aquatic animals, particularly to visual predators such as dragonfly larvae that often need to detect and assess possible prey against partially polarized background spacelight.
The aim of this study was to test the effect of the polarization of the aquatic light environment on the visually mediated tracking behaviour of the hawker Emperor dragonfly larva,Anax imperator, in response to moving square-wave gratings seen by subject animals through a polarized veiling light field. To infer a biologically relevant relationship between contrast detection and PS, the degree of polarization in our experiments was kept to levels known to occur underwater. We show that animals were more responsive to the stimuli when they were viewed through a naturalistic horizontally polarized light field with a percentage polarization in the range 14.5–21.3% rather than through a non-naturalistic weakly polarized light field of between 5.5% and 7.2% polarization and a vertical angle of polarization. We demonstrate that this increase in response is equivalent to that observed when the intensity contrast of the square-wave grating is increased by 8%. The findings are discussed in relation to the ecology, behaviour and development of
A. imperator.
RESULTS Experiment 1
Experiment 1 tested the optomotor response of larvae to moving square-wave gratings, of four different fundamental spatial frequencies, viewed through veiling light that was either naturalistically horizontally polarized or non-naturalistically
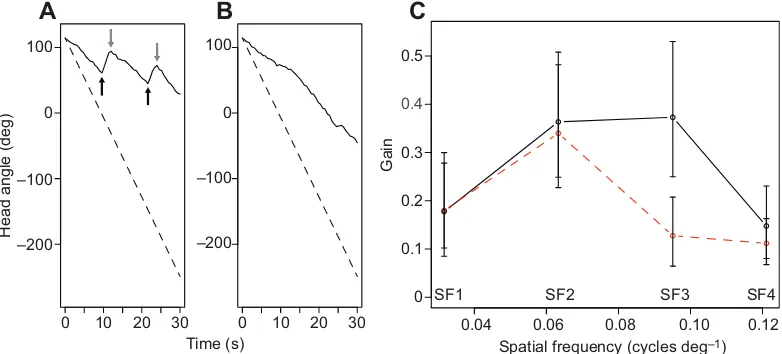
weakly vertically polarized. We aimed to test the hypothesis that, if polarization sensitive, larvae use the polarization of light to enhance their ability to perceive intensity stimuli in a naturally polarized aquatic environment. Gain, the ratio of the angular rotation rate of the larva’s head relative to the rotation rate of the grating, was used as a measure of the response. In total, 18 (instar f-3,N=7; f-2,N=5; f,N=6) of the total of 20 animals responded to a moving 16.35±0.05% intensity contrast grating above the threshold level of 0.1 gain (see Materials and methods for details of the gain threshold), averaged across all eight paired trials per animal. The response, either saccadic or smooth tracking (Fig. 1A,B), was measured as the average across eight trials per animal. Saccadic tracking was less common, only occurring in 12 of 99 trials (i.e. 12%) in which a response was observed. Fitting linear mixed models revealed a number of significant fixed factors (Table 1). The animals’responses to the two different polarized light fields (LF) were found to depend on the spatial frequency (SF) of the grating [linear mixed model (LMM), d.f.=3,χ2=13.3,P=0.004; Fig. 1C].
In both light fields, gain was low for both low and high spatial frequencies (SF1 and SF4; Fig. 1C), and higher in response to intermediate spatial frequency (SF2; Fig. 1C). Responses to SF3 varied with light field and there was a significantly greater response when animals viewed SF3 through the strongly horizontally polarized light field [mean gain=0.37, 95% confidence interval
0 10 20 30
–200 –100 0 100
A
Time (s)
Head angle (deg)
0 10 20 30
–200 –100 0 100
B
0.04 0.06 0.08 0.10 0.12
0 0.1 0.2 0.3
0.4
0.5
Gain
Spatial frequency (cycles deg–1)
SF1 SF2 SF3 SF4
[image:2.612.312.565.80.165.2]C
[image:2.612.112.503.486.663.2]Fig. 1. Smooth and saccadic responses to moving square-wave gratings and averaged responses to gratings seen through the naturalistic horizontally or weakly vertically polarized light field.(A) In a relatively small number of trials (see Results), animals responded to the movement of the grating (indicated by the dashed line) with periods of smooth tracking followed by rapid, saccadic, movement of the head in the opposite direction (black arrows indicate the start of a saccade and grey arrows indicate the start of smooth tracking). (B) The majority of animals tracked the drum smoothly but, typically, lagged behind the movement of the drum, indicated by gain values <1.0 in all cases. (C) The responses (gain) of larvae to four spatial frequencies (SF1–SF4; 0.032, 0.063, 0.095 and 0.121 cycles deg−1, respectively) in horizontally polarized (black solid lines) and vertically polarized (red dashed lines) light fields. There was a significant difference in response to grating SF3 between the two light fields. Error bars represent ±1 s.d.
Table 1. Statistics of the fitted model, for experiment 1, showing the highest order terms tested with the minimum model
Factor/interaction d.f. χ2 P-value
LF:SF 3 13.3 0.004**
LF:Order 7 24.5 0.001***
LF:Direction 1 0.3 0.859
SF:Order 21 43.7 0.003**
SF:Direction 3 24.3 0.000***
Order:Direction 7 5.8 0.559
Instar 2 2.0 0.363
LF, light field; Order, trial order; Direction, drum direction; SF, spatial frequency.
Asterisks indicate significance: ***P≤0.001, **P≤0.01.
Journal
of
Experimental
(CI)=0.25 to 0.53] compared with the weakly vertically polarized light field (mean gain=0.13, 95% CI=0.06 to 0.21) (Tukey’s test,
P<0.001; Fig. 1C). Both trial order (Order) and direction of rotation of the drum to which the grating was fixed (Direction; see Materials and methods) independently affected the responses of animals to the moving grating. However, the order of trials was pseudorandomized to account for these order effects and both fixed effects were controlled for in the analysis. No significant difference in response was observed between different larval instars (LMM, d.f.=2, χ2=2.03,P=0.363).
Experiment 2
Experiment 2 was designed to test whether the change in response observed in experiment 1 between the naturalistic and non-naturalistic light fields could be replicated by altering the intensity contrast of moving gratings. This explored the hypothesis that stronger optomotor responses in the naturalistic light field would match increased responses to an enhanced perceived intensity contrast of the grating. Larvae were tested with the same four moving square-wave gratings as in experiment 1, with three different intensity contrasts (16.3%, 20.3% and 24.3%) that were seen through the non-naturalistic, weakly vertically polarized veiling light. All 15 animals (instar f-2,N=10; f-1, N=3; f, N=2) responded above the threshold of 0.1 gain averaged across all 12 trials and all data were therefore included in further analyses. The animals’responses were again influenced by a number of factors (Table 2). The responses depended on both the spatial frequency of the grating and grating contrast (Contrast), indicated by a significant interaction between these two factors (LMM, d.f.=6, χ2=16.1,
P=0.013; Fig. 2). Inspection of Fig. 2 shows that changing the contrast of the grating stripes affected the responses of animals to the SF3 grating. This was similar to the observed change in response to the different polarizations of surrounding light fields when SF3 was tested in experiment 1. A significant increase in gain was observed at SF3 when the contrast was increased from 16.3% (the grating contrast used in experiment 1) to 24.3%, an 8.0% increase in the absolute contrast (Tukey’s test,P≤0.01; Fig. 2). Average gain was not significantly different between contrasts of 16.3% and 20.3% (Tukey’s test,P=0.207), or between contrasts of 20.3% and 24.3% (Tukey’s test,P=0.418). Responses were not significantly different between contrasts at all other spatial frequencies. The order of drum rotation (Order), direction of rotation (Direction) and animal instar (Instar) did not significantly affect the responses of animals to the moving grating (Table 2).
DISCUSSION
This study is the first to demonstrate PS in a larval odonate. The most parsimonious interpretation of our results is that the PS of
A. imperator larvae functions to improve visual contrast by
selectively filtering polarized light scattered by the underwater light environment. Whilst previous experiments (Shashar et al., 1998, 2000) have suggested that PS and opponent processing could improve visual contrast for any object whose polarization differs from the background, or by cutting out intervening polarized scattered light (Lythgoe and Hemmings, 1967; Schechner and Karpel, 2005), this study presents behavioural evidence for the latter mechanism in an aquatic insect. Importantly, the methodologies used tested the contrast enhancement capability of larvae under naturalistic levels of degree of polarization.
Dragonfly larvae exhibited optomotor responses to the moving square-wave gratings by movement of the head and, in some cases, the body, in the direction of drum rotation. These mirror similar innate optomotor responses to moving gratings that have been demonstrated in a range of different species (Collewijn, 1970; David, 1979; Maaswinkel and Li, 2003). These responses provide a mechanism to reduce the motion of the visual image on the retina (retinal slip) when the visual scene is displaced relative to the gaze of the animal. In practice, this enables animals experiencing retinal slip during periods of motion to stabilize their position relative to the environment, for example during flight (Srinivasan and Zhang, 2004) or in moving water (Maaswinkel and Li, 2003). Such wide field motion detection is highly important for aeshnid dragonfly larvae, to maintain body position in moving water during periods of active hunting.
Whether an animal responds to an optomotor stimulus depends principally on an individual’s contrast sensitivity function (CSF), a function of both spatial frequency and contrast. The CSF has been characterized for many different taxa, including humans (De Valois et al., 1974), goldfish (Northmore and Dvorak, 1979) and blowflies (Dvorak et al., 1980), and has a characteristic invertedUshape. The inverse of the CSF describes the contrast sensitivity threshold (CST): the minimum contrast required by the visual system to detect a certain spatial frequency. Therefore, generally speaking, a higher contrast is needed to detect or respond to higher or lower spatial frequencies than to mid-range spatial frequencies. The optomotor responses (gain) of the dragonfly larvae to all four different spatial frequencies (SF1=0.03 cycles deg−1, SF2=0.06 cycles deg−1,
SF3=0.01 cycles deg−1 and SF4=0.12 cycles deg−1) were
[image:3.612.78.272.55.218.2]consistent with such a CST. Larvae exhibited their highest level of response when tested with mid-range spatial frequencies (SF2 and SF3) and lagged behind the rotation of the grating to a greater degree at upper and lower spatial frequencies (SF1 and SF4).
Table 2. Statistics of the fitted model, for experiment 2, showing the highest order terms tested with the minimum model
Factor/interaction d.f. χ2 P-value
Contrast:SF 6 16.1 0.013*
Order 11 2.8 0.993
Direction 1 0.1 0.288
Instar 2 0.1 0.936
Contrast, grating contrast; SF, spatial frequency; Order, trial order; Direction, drum direction.
Asterisks indicate significance: *P≤0.05.
0.04 0.06 0.08 0.10 0.12 0
0.2 0.4 0.6 0.8
Gain
Spatial frequency (cycles deg–1)
[image:3.612.48.298.652.708.2]SF1 SF2 SF3 SF4
Fig. 2. Averaged responses to different grating contrasts.Responses (gain) of larvae to gratings of four different spatial frequencies (SF1–SF4; 0.032, 0.063, 0.095 and 0.121 cycles deg−1, respectively) and three different intensity contrasts (16.3%, red dotted lines; 20.3%, blue dashed lines; and 24.3%, black solid lines), seen through a vertically polarized light field. Error bars represent ±1 s.d. Responses varied most to grating SF3, with gain increasing with grating contrast.
Journal
of
Experimental
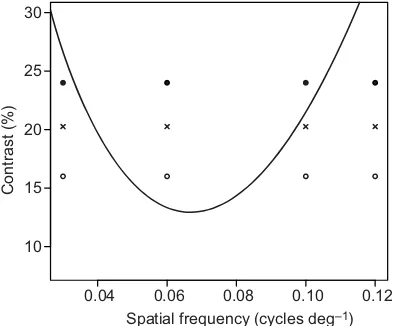
Only the responses of larvae to SF3 gratings were affected by the polarization of the veiling light field and by changes in the intensity contrast of the square-wave gratings. No such changes in response were observed for the other three spatial frequencies tested and we propose the following explanation to describe this relationship. We suggest that, in both experiments, the animal’s CST curve can explain the responses of larvae to the different spatial frequencies and contrasts. This interpretation is shown diagrammatically in Fig. 3. The perceived contrast of the grating must exceed the CST for subjects to detect and respond to its rotation. Therefore, in experiment 2, even the highest intensity contrast tested (24.3%) did not exceed the CST at SF1 or SF4, leading to weak or absent responses. Similarly, all contrasts tested (16.3%, 20.3% and 24.3%) were above the CST at SF2. We propose that, at SF3, only the highest contrast (24.3%) was sufficient to exceed the CST (Fig. 3). Conversely, at the lower intensity contrasts of 16.3% and 20.3% that were closer to, or below, the CST, only weaker and absent responses, respectively, were seen as responses to the moving grating.
A similar change in response was also observed only at SF3 in experiment 1, when animals viewed the grating through differently polarized light fields. Specifically, at SF3, animals only exhibited a strong optomotor response when viewing the grating through the naturalistic, more strongly horizontally polarized light field. We suggest that these data are consistent with the explanation that the larval PS reduces the visual interference of the scatter in the veiling light field, elevating the perception of the visual contrast above the CST. This increase in perceived contrast is greater in the light field mimicking that found in nature (more strongly horizontally polarized) than in the non-naturalistic light field (low percentage polarization and vertically polarized), suggesting that larval PS may be well adapted to reduce the partially polarized scatter found naturally occurring in the freshwater environment. A mechanism
based on PS to reduce the contrast-degrading effect of veiling light or haze would be adaptive both for broad field visual functions (e.g. optomotor-associated motion stabilization) and for small field visual behaviours such as prey tracking and capture.
Mechanisms underlying PS in insects have been well studied, particularly in species that utilize polarized light for navigation (Homberg et al., 2011). These mechanisms include the alignment of dichroic visual pigment chromophores within the photoreceptor microvilli and the orthogonal arrangement of adjacent photoreceptor microvilli (Labhart and Meyer, 1999; Roberts et al., 2011). In the ventral region of the adult dragonfly eye
(Hemicordulia tau), polarization sensitive cells also have microvilli
oriented in two perpendicular directions, horizontally and vertically, relative to the body axis (Laughlin, 1976; Laughlin and McGinness, 1978). This suggests a putative two-channel polarization system, capable of analysing the angle and degree of polarization, albeit with predictable neutral points and confusion states that would only be overcome with additional channels (Bernard and Wehner, 1977). In the larval visual system ofA. imperator, polarized light could be used to enhance the perceived contrast of the visual scene by one of a number of independent mechanisms. For example, using an opponent two-channel polarization detector could de-haze an image (Bernard and Wehner, 1977; Tyo et al., 1996). Even more simply, a single-channel detector with a vertically oriented axis would decrease the absorption of horizontally polarized light (Roberts et al., 2011, 2014) with an example of this mechanism previously being found in certain regions of the fiddler crab eye, where it is thought to remove the glare from mud flats (Alkaladi et al., 2013). It has also been suggested that a similar mechanism exists in the ventral part of the eyes of pond skaters,Gerris lacustris(Schneider and Langer, 1969), serving to filter glare from the surface of the water. However, the structural basis of PS larvalA. imperatoris still to be determined.
Behavioural experiments have suggested that the visual systems of various aquatic animals including trout (Novales Flamarique and Browman, 2001), squid (Shashar et al., 1998), cuttlefish (Shashar et al., 2000; Pignatelli et al., 2011; Temple et al., 2012; Cartron et al., 2013) and crayfish (Tuthill and Johnsen, 2006) are able to analyse the polarization of light as a way to increase the detection of objects underwater. In many of these experiments, however, animals were tested under non-naturalistic lighting conditions, for example, using point-source illumination or percentages of polarization that far exceed those found in nature. In the methodology developed in this experiment, the light field experienced by the subject was created to be as naturalistic as possible by using downwelling light and percentage polarization levels within the range found in the habitat of the dragonfly larva. It should be noted in the future that such methods provide a tractable way to demonstrate environmentally relevant behavioural responses.
As a final consideration, the PS of the adult dragonfly visual system has been demonstrated both by using electrophysiology and by multiple-choice behavioural experiments (Laughlin, 1976; Horváth et al., 1998, 2007; Kriska et al., 2009). Whilst adult dragonflies probably use the horizontally polarized light reflected from water surfaces to detect suitable habitats for oviposition (females) and mating (males), and possibly also for flight stabilization, these behaviours are specific to the terrestrial/aerial stage. Our results demonstrate that larvae also have PS, but for behaviours specific to the aquatic life stage: contrast enhancement of a visual scene in a partially polarized, turbid environment. These findings suggest that there is considerable developmental plasticity
0.04 0.06 0.08 0.10 0.12 10
15 20 25 30
Contrast (%)
[image:4.612.76.273.434.597.2]Spatial frequency (cycles deg–1)
Fig. 3. HypotheticalAnax imperatorcontrast sensitivity threshold (CST). The proposed CST (solid line) of theA. imperatorlarval visual system is shown superimposed on the experimental grating contrasts and spatial frequencies tested in experiment 2; 16.3% contrast (solid circles), 20.3% (crosses) and 24.3% contrast (open circles) are plotted for all four spatial frequencies. We suggest that the responses of larvae were determined by the perceived contrast of the grating, and whether this contrast fell above or below the CST. This proposed CST curve explains the low or lack of response to SF1 and SF4 as both contrasts fall below the CST. At SF2, both contrasts fall above the CST but at SF3, only the higher contrast, 24.4% (black), exceeds the CST; thus, at this spatial frequency we see a difference in response to different intensity grating contrasts. We propose that the difference in response between polarized light fields is explained in the same way, by means of a difference in
perceived contrast.
Journal
of
Experimental
in the PS of the dragonfly compound eye, with PS being used for markedly different visual tasks in adults and larvae.
MATERIALS AND METHODS Experimental set up
Four larval instars (f, f-1, f-2 and f-3; where f is the final instar before metamorphosis, f-1 is one instar before final, etc.) of the Emperor dragonfly
A. imperator, obtained from Blades Biological Ltd (Essex, UK), were used for behavioural experiments. Individuals were housed in separate compartments, to avoid cannibalism, within a large aquarium filled with clear de-chlorinated tap water maintained at 15°C. White fluorescent room lighting provided a 12 h:12 h daily light:dark cycle. Animals were fedad libitumwith live annelid worms,Dendrobaenasp. (Wormsdirect, Essex, UK) but were tested 3–5 days after a feeding bout.
For behavioural experiments, a dragonfly larva subject was housed in a small, cylindrical, 10 cm diameter transparent Perspex™ ( polymethylmethacrylate) tank filled with clear de-chlorinated tap water and a 1.5 cm layer of aquarium sand (Fig. 4A). A black, opaque plastic collar prevented the subject from viewing the scene below. Black tape covered the top 5 cm of the inner tank, creating a 2.5 cm high clear window through which the animal could view the outside environment. This tank was held within a larger Perspex™cylindrical tank (25 cm diameter) filled with very dilute milk solution (0.042 g l−1skimmed milk powder, 0.1% fat) in de-chlorinated tap water. Both tanks were held stationary within a large
(30 cm diameter) clear Perspex™cylindrical drum, that could be rotated in a clockwise (CW) or counter-clockwise (CCW) direction (as viewed from above) at 12 and 11 deg s−1, respectively. Animals were tested in a dark room where illumination was provided only by a circular fluorescent bulb (Circline 22 W cool white deluxe Sylvania). The top of the bulb was painted with matte black spray paint and placed directly above the milky water tank to prevent light from the bulb illuminating the grating directly (Fig. 4A). Animals were tested using a square-wave grating, made by printing vertical monochrome stripes on paper that was placed on the outside of the rotatable outer drum, and which was viewed by subjects through the milky water tank. Subjects were filmed from above using a HD digital video camera (Panasonic HC-X900) recording in 1080p/50 mode (1920×1080 pixels), at 50 frames s−1.
Degree of polarization measurements
All spectral measurements were made using a spectrophotometer (USB2000, Ocean Optics, Dunedin, FL, USA) coupled to fibre optic (Ocean Optics UV-vis, 200μm diameter) and a collimating lens (Ocean Optics 74-UV), which focused light from a small (approximately 5 mm diameter) area on the surface to be measured into the fibre optic. To avoid bending the fibre into the apparatus, light from the square-wave grating was reflected from a front-surface polished aluminium mirror angled at 45 deg, positioned inside the clear water tank, which was filled with distilled water. The intensity of small areas of the grating, as seen through the milky water tank, was thus measured, and the Michelson contrast calculated between the
Video camera
Rotatable drum Fluorescent bulb
Milky water tank
Clear water tank
Opaque base Linear polarizer disc
A
B
450 500 550 600 650 –5
0 5 10
D
450 500 550 600 650 –5
0 5 10
C
Wavelength (nm)
Contrast dif
[image:5.612.132.487.326.616.2]ference (%)
Fig. 4. Experimental apparatus used to test the optomotor response and the changes in contrast of the square-wave gratings when polarization filtering was applied.(A) Experimental set up to test the optomotor response of dragonfly larvae to a moving square-wave grating of vertical stripes. The subject was contained in the stationary central cylinder of clear water, which was surrounded by a concentric outer tank containing dilute milk solution. Light to the latter, from above, was polarized by one of two linear polarizing discs (B), consisting of radially or tangentially orientated linear polarizers (constructed of sectors of Polaroid™filter), resulting in vertically (left disc) or horizontally (right disc) polarized light (respectively; arrows indicate the transmission axis of the linear polarizer in each sector) being scattered towards the subject. This veiling light field reduced the contrast of the grating, which was fixed to a rotatable outer drum. The animal’s response was assessed by measuring its ability to visually track the rotation of the grating. (C,D) The change in intensity contrast of the grating stripes calculated between measurements made without a linear polarizer and when measurements were made with a linear polarizer placed in front of the fibre with the transmission axis oriented vertically (black lines) or horizontally (red lines), selectively filtering horizontally or vertically polarized light, respectively. The data are presented for the two scattering light conditions used in experiments: horizontally polarized scatter (C), and vertically polarized scatter (D). The change in the intensity contrast was higher in the horizontally polarized light field with a maximum increase in contrast of 4.2% when horizontally polarized light was filtered using
a vertically oriented analyser (see Materials and methods).
Journal
of
Experimental
grating stripes. To characterize the polarization of light, a rotatable linear polarizer was fixed to the lens at the end of the optic fibre. Spectral measurements were made through the milky water tank of the light and dark stripes of the grating, and the percentage polarization of the grating stripes was calculated, for both horizontally and vertically polarized light fields, using the equation:
%Polarization¼ ImaxImin
ImaxþImin
100; ð1Þ
where Imax and Imin are the radiant intensities of the light when the transmission axis of the linear analyser polarizer is rotated until the maximum and minimum number of counts are recorded, respectively. This use of this equation assumes there was no ellipticity in the polarization of the light field.
Illumination
The polarization of the light field that surrounded the animal was controlled by the transmission axis orientation of linear Polaroid™ filters placed directly above the milky water tank, beneath the light source. Milk was used as it created a turbid, contrast-degrading environment with a high proportion of Rayleigh scattering, due to the presence of sub-wavelength particles. Sector-shaped pieces of linear polarizer (Rosco 730011, London, UK) were sandwiched between two circular pieces of 3 mm thick Perspex™. The transmission axes of the filter segments were oriented either radially or tangentially to create two polarizer discs with differently oriented transmission axes (Fig. 4B). The polarization of the incoming light affected both the degree and polarization angle of the light, scattered by the milky water (Fig. S1). When the disc with tangentially arranged polarizer segments was placed above the milky water tank, the light field surrounding the inside clear water tank housing the animal was strongly horizontally polarized. When the disc with radially oriented polarizer segments was used, the light field was weakly vertically polarized.
Square-wave gratings with four fundamental spatial frequencies (SF1=0.03±0.01 cycles deg−1, SF2=0.06±0.02 cycles deg−1, SF3=0.01± 0.03 cycles deg−1and SF4=0.12±0.04 cycles deg−1measured from the centre of the experimental chamber) were printed on paper and were used to test the optomotor response. The error quoted is the maximum deviation in spatial frequency with visualization distance within the arena about the mean. The grey levels of the printed dark and light stripes were varied until their radiances were as near equal as possible when viewed through the two light fields (Fig. S2). Consequently, the difference in the intensity contrast of the gratings, averaged over the wavelength range 400 to 700 nm, between the two light fields was not significant (N=3, mean±s.d. difference=0.09± 0.42%). Light in the UV region of the spectrum was not used in these experiments as odonate larvae lack a dedicated UV-sensitive visual pigment (Futahashi et al., 2015). In both light fields, the lighter stripe had a lower percentage polarization than the darker stripe, probably due to the brighter paper reflecting more unpolarized light towards the central tank, thus lowering the value. The percentage polarization of the light and dark stripes in the vertically polarized light field was 5.5% and 7.2%, respectively. Values were higher under the horizontally polarized conditions at 14.5% and 21.3%.
The intensity contrast of the grating was measured in the horizontally or vertically polarized light fields, with and without linear polarizing analysers in the light path, and the resulting change in contrast, compared with measurements in the absence of a linear analyser, was quantified. When the grating was viewed through the horizontally polarized light field, the addition of a vertically oriented linear polarizing analyser increased the contrast by 4.2% (Fig. 4C). In the vertically polarized light field with a low percentage polarization, there was an increase in contrast of 1.0% when vertically polarized light was excluded with the analyser (Fig. 4D). The measured contrast of the gratings was reduced by 2.9% and 1.0% when the transmission axis of the linear polarizer was aligned with the predominant angle of polarization in the horizontally and vertically polarized light fields, respectively (Fig. 4C,D). In summary, filtering the respective predominant angle of polarization in each light field caused an increase in intensity
contrast of the grating but this increase was greater in the horizontally polarized light field because of its higher percentage polarization.
For each set of behavioural experiments, individual larvae were transferred from their home aquarium to the inner chamber of the apparatus and allowed to acclimatize to the new environment for 30 min. After this, once the subject animal had been stationary for at least 5 s in the clear water tank, a square-wave grating was rotated in either the CW or CCW direction for 30 s. Preliminary trials indicated that when a square-wave grating was rotated in the opposite direction to that in which the animal was oriented, erratic swimming behaviours were likely to be elicited. For this reason, the grating was always rotated in the direction that the animal was facing or in a randomized direction if there was no clearly directed starting orientation. A minimum 4 min interval was allowed between each trial. The order of trial presentation was pseudorandomized using a Latin square design to minimize the effect of presentation order.
Experiment 1
Each animal (instar f-3, N=7; f-2, N=6; f, N=7) was tested with all four grating spatial frequencies in both the natural horizontally and weakly vertically polarized light fields with a grating intensity contrast of 16.35±0.05%.
Experiment 2
Each animal (instar f-2,N=10; f-1,N=3; f,N=2) was tested with all four spatial frequencies in a weakly vertically polarized light field. The intensity contrast of the gratings tested was 16.30%, 20.30% and 24.30%.
Video analysis
The video recording of each trial was split into individual frames using Avidemux open source, non-linear video editing software and, for every 30th frame, a rostro-caudal line was drawn equidistant from both eyes along the head of the animal and the absolute head angle measured using ImageJ (Abràmoff et al., 2004). The head angle of the animal was plotted for each 30 s trial and, where applicable, used to extract a 6 s region during which the animal exhibited an optomotor response, indicated by a change in angle of at least 2 deg per 30 frame intervals (or 0.6 s). When saccades were present, only periods of smooth tracking between the rapid movements in the opposite direction were used for measurements of the optomotor response. For saccadic tracking, gain was calculated for each separated non-saccadic period by regression, and a mean value obtained from these. In cases where there was no obvious optomotor response, data between 3 and 9 s from the start of drum rotation were used. For non-saccadic tracking, a regression line was fitted to the angular change data and the head angular velocity calculated. Gain, a commonly used measure of the optomotor response that compares the rotational angular velocity of the animal with the grating, was calculated according to the equation:
Gain = Animal head angular velocity
Drum angular velocity : ð2Þ
Statistical analysis
Quality checks were performed on gain data prior to statistical analysis such that unresponsive animals with gain values less than 0.1, averaged across all trials, were removed from the analysis. Linear mixed models were fitted to the data (gain) in R version 3.0.2 (R Core Team, 2013) using the package lme4 (Bates et al., 2014) and the function lmer. Data from experiments 1 and 2 were log and square-root transformed, respectively, so that they were normally distributed about their means before statistical analysis. Data were back-transformed before presentation in figures. Fixed effects used in experiment 1 were the polarization of the light field, spatial frequency of the grating, direction of drum rotation, order of trial presentation, and animal instar. In experiment 2, the contrast of the grating replaced the polarization of the light field as a fixed effect. The significance of each effect on the fit of the model was compared using an ANOVA with a probability significance threshold of 0.05 and the Akaike information criterion (AIC) used to identify the better fitting model. As this experiment had a repeated measures design, animal identity was included as a random factor.
Journal
of
Experimental
Acknowledgements
Thanks to Dr Andy Radford for his assistance with statistical analysis and Dr Shelby Temple for his help with the experimental set up.
Competing interests
The authors declare no competing or financial interests.
Author contributions
C.R.S. carried out behavioural experiments, analysed the data and wrote the paper. N.W.R. and J.C.P. interpreted the data and revised the paper.
Funding
This work was funded by the Leverhulme Trust [grant number F00182CG].
Supplementary information
Supplementary information available online at
http://jeb.biologists.org/lookup/suppl/doi:10.1242/jeb.122507/-/DC1
References
Abràmoff, M., Magalhães, P. and Ram, S.(2004). Image processing with ImageJ.
Biophotonics Int.11, 36-42.
Alkaladi, A., How, M. J. and Zeil, J.(2013). Systematic variations in microvilli banding patterns along fiddler crab rhabdoms.J. Comp. Physiol. A199, 99-113.
Bates, D., Maechler, M., Bolker, B. and Walker, S.(2014). lme4: Linear mixed-effects models using Eigen and S4. R package version 1.0-6. https://CRAN.R-project.org/package=lme4.
Bernard, G. D. and Wehner, R.(1977). Functional similarities between polarization vision and color vision.Vision Res.17, 1019-1028.
Cartron, L., Josef, N., Lerner, A., McCusker, S. D., Darmaillacq, A.-S., Dickel, L. and Shashar, N.(2013). Polarization vision can improve object detection in turbid waters by cuttlefish.J. Exp. Mar. Biol. Ecol.447, 80-85.
Collewijn, H.(1970). Oculomotor reactions in the cuttlefish,Sepia officinalis.J. Exp. Biol.52, 369-384.
Corbet, P. S.(2004).Dragonflies: Behaviour and Ecology of Odonata. Colchester: Harley Books.
David, C. T.(1979). Optomotor control of speed and height by free-flyingDrosophila.
J. Exp. Biol.82, 389-392.
Davies-Colley, R. J. and Vant, W. N.(1987). Absorption of light by yellow substance in freshwater lakes.Limnol. Oceanogr.32, 416-425.
De Valois, R. L., Morgan, H. and Snodderly, D. M.(1974). Psychophysical studies of monkey vision-III. Spatial luminance contrast sensitivity tests of macaque and human observers.Vision Res.14, 75-81.
Dvorak, D., Srinivasan, M. V. and French, A. S.(1980). The contrast sensitivity of fly movement-detecting neurons.Vision Res.20, 397-407.
Foster, J. J., Sharkey, C. R., Gaworska, A. V. A., Roberts, N. W., Whitney, H. M. and Partridge, J. C.(2014). Bumblebees learn polarization patterns.Curr. Biol. 24, 1415-1420.
Futahashi, R., Kawahara-Miki, R., Kinoshita, M., Yoshitake, K., Yajima, S., Arikawa, K. and Fukatsu, T.(2015). Extraordinary diversity of visual opsin genes in dragonflies.Proc. Natl. Acad. Sci. USA112, E1247-E1256.
Hawryshyn, C. W.(1992). Polarization vision in fish.Am. Sci.80, 164-175.
Homberg, U., Heinze, S., Pfeiffer, K., Kinoshita, M. and el Jundi, B.(2011). Central neural coding of sky polarization in insects.Philos. Trans. R. Soc. B Biol. Sci.366, 680-687.
Horváth, G. and Varjú, D.(1995). Underwater refraction-polarization patterns of skylight perceived by aquatic animals through Snell’s window of the flat water surface.Vision Res.35, 1651-1666.
Horváth, G., Bernáth, B. and Molnár, G.(1998). Dragonflies find crude oil visually more attractive than water: multiple-choice experiments on dragonfly polarotaxis.
Naturwissenschaften85, 292-297.
Horváth, G., Malik, P., Kriska, G. and Wildermuth, H.(2007). Ecological traps for dragonflies in a cemetery: the attraction of Sympetrum species (Odonata: Libellulidae) by horizontally polarizing black gravestones. Freshw. Biol. 52, 1700-1709.
How, M. J., Porter, M. L., Radford, A. N., Feller, K. D., Temple, S. E., Caldwell, R. L., Marshall, N. J., Cronin, T. W. and Roberts, N. W.(2014). Out of the blue: the evolution of horizontally polarized signals in Haptosquilla (Crustacea, Stomatopoda, Protosquillidae).J. Exp. Biol.217, 3425-3431.
Kelber, A., Thunell, C. and Arikawa, K.(2001). Polarisation-dependent colour vision inPapiliobutterflies.J. Exp. Biol.204, 2469-2480.
Kriska, G., Bernáth, B., Farkas, R. and Horváth, G. (2009). Degrees of polarization of reflected light eliciting polarotaxis in dragonflies (Odonata),
mayflies (Ephemeroptera) and tabanid flies (Tabanidae).J. Insect Physiol.55, 1167-1173.
Labhart, T. and Meyer, E. P.(1999). Detectors for polarized skylight in insects: a survey of ommatidial specializations in the dorsal rim area of the compound eye.
Microsc. Res. Tech.47, 368-379.
Laughlin, S. B.(1976). The sensitivities of dragonfly photoreceptors and the voltage gain of transduction.J. Comp. Physiol. A111, 221-247.
Laughlin, S. and McGinness, S.(1978). The structures of dorsal and ventral regions of a dragonfly retina.Cell Tissue Res.188, 427-447.
Lerner, A., Meltser, N., Sapir, N., Erlick, C., Shashar, N. and Broza, M.(2008). Reflected polarization guides chironomid females to oviposition sites.J. Exp. Biol. 211, 3536-3543.
Lythgoe, J. N.(1979).The Ecology of Vision. Oxford: Clarendon Press.
Lythgoe, J. N. and Hemmings, C. C.(1967). Polarized light and underwater vision.
Nature213, 893-894.
Maaswinkel, H. and Li, L.(2003). Spatio-temporal frequency characteristics of the optomotor response in zebrafish.Vision Res.43, 21-30.
Markager, S. and Vincent, W. F. (2000). Spectral light attenuation and the absorption of UV and blue light in natural waters.Limnol. Oceanogr.45, 642-650.
Marshall, J., Cronin, T. W., Shashar, N. and Land, M. (1999). Behavioural evidence for polarisation vision in stomatopods reveals a potential channel for communication.Curr. Biol.9, 755-758.
Meyer, E. P. and Labhart, T.(1993). Morphological specializations of dorsal rim ommatidia in the compound eye of dragonflies and damselfies (Odonata).Cell Tissue Res.272, 17-22.
Northmore, D. P. M. and Dvorak, C. A.(1979). Contrast sensitivity and acuity of the goldfish.Vision Res.19, 255-261.
Novales Flamarique, I. N. and Browman, H. I.(2001). Foraging and prey-search behaviour of small juvenile rainbow trout (Oncorhynchus mykiss) under polarized light.J. Exp. Biol.204, 2415-2422.
Novales Flamarique, I. and Hawryshyn, C. W.(1997). Is the use of underwater polarized light by fish restricted to crepuscular time periods?Vision Res.37, 975-989.
Pignatelli, V., Temple, S. E., Chiou, T.-H., Roberts, N. W., Collin, S. P. and Marshall, N. J.(2011). Behavioural relevance of polarization sensitivity as a target detection mechanism in cephalopods and fishes.Philos. Trans. R. Soc. B Biol. Sci.366, 734-741.
R Core Team(2013). R: A Language and Environment for Statistical Computing. Vienna, Austria. Available at http://www.R-project.org/.
Roberts, N. W., Porter, M. L. and Cronin, T. W.(2011). The molecular basis of mechanisms underlying polarization vision. Philos. Trans. R. Soc. B 366, 627-637.
Roberts, N. W., How, M. J., Porter, M. L., Temple, S. E., Caldwell, R. L., Powell, S. B., Gruev, V., Marshall, N. J. and Cronin, T. W.(2014). Animal polarization imaging and implications for optical processing.Proc. IEEE102, 1427-1434.
Schechner, Y. Y. and Karpel, N.(2005). Recovery of underwater visibility and structure by polarization analysis.IEEE J. Ocean. Eng.30, 570-587.
Schneider, L. and Langer, H.(1969). Die Struktur des Rhabdoms im“Doppelauge” des WasserläufersGerris lacustris.Z. Zellforsch.99, 538-559.
Schwind, R.(1991). Polarization vision in water insects and insects living on a moist substrate.J. Comp. Physiol. A169, 531-540.
Schwind, R. (1995). Spectral regions in which aquatic insects see reflected polarized light.J. Comp. Physiol. A177, 439-448.
Shashar, N. and Cronin, T. W.(1996). Polarization contrast vision inOctopus.
J. Exp. Biol.199, 999-1004.
Shashar, N., Hanlon, R. T. and Petz, A. deM.(1998). Polarization vision helps detect transparent prey.Nature393, 222-223.
Shashar, N., Hagan, R., Boal, J. G. and Hanlon, R. T.(2000). Cuttlefish use polarization sensitivity in predation on silvery fish.Vision Res.40, 71-75.
Srinivasan, M. V. and Zhang, S.(2004). Visual motor computations in insects.
Annu. Rev. Neurosci.27, 679-696.
Sweeney, A., Jiggins, C. and Johnsen, S. (2003). Insect communication: polarized light as a butterfly mating signal.Nature423, 31-32.
Temple, S. E., Pignatelli, V., Cook, T., How, M. J., Chiou, T.-H., Roberts, N. W. and Marshall, N. J.(2012). High-resolution polarisation vision in a cuttlefish.Curr. Biol.22, R121-R122.
Tuthill, J. C. and Johnsen, S.(2006). Polarization sensitivity in the red swamp crayfish Procambarus clarkii enhances the detection of moving transparent objects.J. Exp. Biol.209, 1612-1616.
Tyo, J. S., Rowe, M. P., Pugh, E. N., Jr and Engheta, N.(1996). Target detection in optically scattering media by polarization-difference imaging.Appl. Opt. 35, 1855-1870.
Waterman, T. H.(2006). Reviving a neglected celestial underwater polarization compass for aquatic animals.Biol. Rev. Camb. Philos. Soc.81, 111-115.