Ultrasonic guided waves achieve non-destructive inspection of thin plates. However, issues such as large energy leakage and attenuation often plague guided wave inspection of storage tanks and pipes filled with fluid. This study experimentally investigated the non-destructive testing of a water-loaded flat aluminum alloy plate through the application of a quasi-Scholte (QS) wave that propagated along the fluid-plate interface without experiencing attenuation due to leakage. A QS wave was confirmed as having been generated and propagated in a plate loaded with water on the bottom surface using ultrasonic incidence and detection at the top water-free surface. Two-dimensional Fourier transform images of the waveforms revealed reflection of the QS wave from a defect as well as a forward incident QS wave. The visualization results ex-perimentally confirmed̶via measurements of waves in water using a laser Doppler vibrometer̶that QS waves propagated along a plate sur-face, while scattered waves were generated by defects. [doi:10.2320/matertrans.M2016204]
(Received June 2, 2016; Accepted June 28, 2016; Published July 29, 2016)
Keywords: non-destructive testing, guided waves, quasi-Scholte wave, two dimensional Fourier transform, visualization
1. Introduction
When an elastic wave with a wavelength greater than the thickness of a plate (or plate-like structure) is incident upon it, elastic wave modes can be observed guiding along the plate. Guided waves propagating in the longitudinal direction with confining elastic wave energy in the cross section are seen to travel farther than bulk waves1,2). Guided wave
in-spection has developed as an efficient inin-spection technique for elongated structures in the field of non-destructive testing (NDT). For example, Lamb waves have been applied to thin plates, mainly in steel production lines, since the 1950s1). In
the 1990s, inspection equipment was developed for long-range inspection of pipes3–8). In recent times, research has
progressed in guided wave inspection for waveguides with complex cross sections such as rails9–13).
Because guided waves consist of multiple modes with dif-ferent velocities and dispersions, a single mode with a small dispersion is selectively generated and detected in guided wave inspection. However, in fluid-loaded plate-like struc-tures such as fluid-filled tanks and pipes, energy leakage from the fluid prevents the guided wave mode from propagating long distances. In another paper, the author of this study dis-cussed quasi-Scholte (QS) waves that propagate along flu-id-plate interfaces without attenuation due to leakage, using a semi-analytical finite element (SAFE) method for a plate with leaky media14,15).
Rayleigh waves propagate along the surface of a semi-in-finite isotropic homogeneous medium with a traction-free surface, whereas Scholte waves propagate in a semi-infinite isotropic homogeneous medium in contact with a semi-in-finite perfect fluid. The guided wave mode travels at the speed of sound in the fluid without radiating energy from the inter-face between the elastic solid medium and the perfect fluid. It has been theoretically and experimentally proved that the Scholte wave mode does not show a dispersive nature, and that the energy focuses more locally–at the fluid-solid
bound-ary–at higher frequencies1,14–18) like the Rayleigh wave does.
When a thin plate contacts with a semi-infinite perfect fluid on a single surface or on both surfaces, a guided wave mode exists at the fluid-plate interface(s), but shows a dispersion caused by the thickness of the plate. Therefore, this mode is called the quasi-Scholte (QS) wave to distinguish it from the Scholte wave.
As shown by a SAFE calculation performed in Refs. 14) and 15), although the fundamental Lamb modes̶called A0 and S0̶are generally used in NDT for a plate, they cannot travel long distances in a fluid-loaded plate due to large atten-uation through energy leakage. Hence, a QS wave has the po-tential as an alternative mode for long-range guided wave in-spection. This study experimentally investigates the applica-bility of a QS wave for detection of inner defects such as erosion and corrosion in tanks and pipes filled with a fluid.
2. Characteristics of a QS Wave in a Plate Loaded with Water on a Single Surface
A fundamental analysis of tanks and pipes filled with water was conducted on a homogeneous aluminum plate (longitudi-nal wave velocity: 6400 m/s, transverse wave velocity: 3100 m/s, density: 2.7 kg/m3, thickness: d) in contact with
water (sound wave velocity: 1500 m/s, density: 1.0 kg/m3)
on a single surface. Phase velocity (c) dispersion curves, group velocity (cg) dispersion curves, and attenuation (α)
curves were calculated using a SAFE method14) as shown in
Figs. 1(a), 1(b), and 1(c), respectively. In the figures, solid lines and dashed lines denote the curves for a plate with and without water, respectively, while the horizontal axes show frequency-thickness products fd. In the fd range shown here, A0 and S0 modes with anti-symmetric and symmetric wave distributions exist for a plate without water, while a QS wave (solid black line) appeared for a plate loaded with water on a single surface in addition to A0-like and S0-like modes. The QS wave does not show dispersion in the fd range over 500 kHz mm, while the QS wave has strong dispersion in the
fd range below 400 kHz mm. However, because attenuation *
of the QS wave is zero over the entire fd range, the QS wave may have the potential for long-range propagation even in the dispersive low-fd range. The solid red and blue lines are sim-ilar to the curves for the A0 and S0 modes (dashed lines) in Fig. 1(a) and 1(b). Because these modes, shown in solid red and blue lines, do not have perfectly anti-symmetric and sym-metric distributions with respect to the centerline of the plate loaded with water on a single side, they are called A0-like and S0-like modes in this paper.
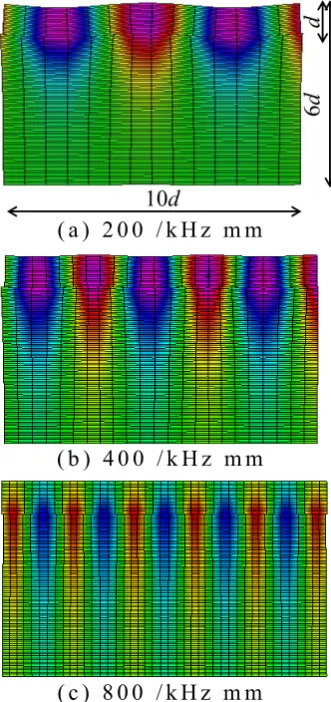
Figures 2(a)–(c) show wave structures at a–c in Fig. 1, in the area of 10d × 6d in the propagation and thickness direc-tions respectively. An aluminum alloy plate with thickness d is located in the upper region, while the lower region has a
water area with depth 5d. The grid motion shows the dis-placements, and the color denotes the displacement in the di-rection of thickness. At 200 kHz mm shown in Fig. 2(a), a flexural vibration distributes itself over the whole cross sec-tion of the plate, while the vibrasec-tion is localized in the vicini-ty of the plate surface in water. At 400 kHz mm shown in Fig. 2(b), a flexural vibration distributes itself over the whole cross section of the plate as it does in (a), and in the water, the vibration distributes itself slightly farther from the plate sur-face than in (a). The distribution in water is opposed to the tendency of Scholte waves to focus locally at the fluid-solid boundary, at higher frequencies. At 800 kHz mm shown in Fig. 2(c), plate vibration is concentrated on the lower surface. In this fd range, vibration concentrates more at the water-plate boundary in both the plate and water, which is similar to the tendency of Scholte waves in bulky media. In addition, be-cause phase and group velocities are almost constant in the fd range over 800 kHz mm, the interface wave can be regarded as a Scholte wave in the high-frequency range.
A QS wave provides largely different wave structures in frequency as shown in Fig. 2 and Ref. 15). This implies that the detectability of defects in a plate varies with frequency. To show this more clearly, Fig. 3 shows (a) energy flow rate in the plate, and (b) energy density distributions in a cross sec-tion for the three fd values. (a) is the flow rate of energy in the plate for the entire transmission energy. Vibration energy Fig. 1 Dispersion curves for an aluminum plate with thickness d. Solid
lines: a water-loaded plate on a single surface. Dashed lines: a water-free plate. (a) Phase velocity, (b) Group velocity, (c) Attenuation.
[image:2.595.57.281.68.584.2] [image:2.595.343.509.71.423.2]propagates less than 10% of the entire energy in the fd range over 500 kHz mm, and the plate energy becomes smaller in a higher fd range. This fact implies that waves reflected from defects in a plate become smaller in higher fd ranges. On the contrary, more than 80% of the entire energy exists in a plate in the fd range below 200 kHz mm, and therefore, this fre-quency range may be suitable for NDT of a plate from the viewpoint of energy flow. However, because the QS wave has a large dispersion in the low frequency range below 200 kHz mm as shown in Figs. 1(a) and 1(b), it might be dif-ficult to use it for long range NDT. Figure 3(b) shows the en-ergy density distributions in a cross section of the plate and water for the three fd values̶200 kHz mm, 400 kHz mm, and 800 kHz mm. As described later, it might be more diffi-cult to detect a QS wave at 800 kHz mm and 400 kHz mm than at 200 kHz mm because the energy density becomes much smaller for higher fd values at the free surface of a plate, from which the ultrasonic wave is generated and detect-ed.
3. Experiments
3.1 Experimental set-up
An experimental set-up as shown in Fig. 4 was used to
measure QS waves. An aluminum alloy plate of dimensions 400 mm × 100 mm × 2 mm was placed on an acrylic water bath measuring 500 mm × 400 mm × 100 mm, filled with wa-ter. An ultrasonic wave was generated at one end of the plate by longitudinal wave transducers with the center frequencies of 100 kHz and 200 kHz. Three-cycle rectangular burst sig-nals of 100 kHz and 200 kHz were input from an ultrasonic pulser receiver (Japan probe, JPR-10B) to the transducers.
Typically, an angle beam wedge is installed between the ultrasonic transducer and plate to generate a single A0 or S0 mode of Lamb waves efficiently. If the longitudinal wave ve-locity in a wedge is cW and the phase velocity of the required
Lamb wave is c, then θ, the incident angle of the wedge for efficient generation of the mode, can be determined as
sinθ=cW/c. (1)
However, the phase velocity of a QS wave is lower than the speed of sound in water, as shown in Fig. 1 (c ≤ 1500 m/s), while the longitudinal velocity of a solid wedge is generally higher that the speed of sound in water (cW > 1500 m/s). It is
therefore not possible to find an appropriate incident angle using eq. (1) to generate a QS wave efficiently. Therefore, in this study, an acrylic buffer was installed instead of using a wedge (Fig. 1). The acrylic buffer consists of a line protuber-ance 2 mm in width that is smaller than half the wavelength of the A0 mode and QS wave at 100 kHz and 200 kHz. Bring-ing the line protuberance in contact to one edge of the plate (letting the plate edge be x = 0), it works as a line source to generate guided waves in the ±x directions. The waves re-flected backwards from the edge of the plate, and the forward waves, are both superposed when the line source is located at an appropriate position. In all the experiments, the position of the line source was precisely adjusted for achieving the larg-est signals.
First, vibrations in the direction of thickness were detected on the upper surface of the plate using a laser Doppler vi-brometer (LDV, Onosokki LV-1710). A retro-reflection tape was attached to the measurement area for ensuring stable la-ser measurements, which enabled the measurement of out-of-plane vibrations with linear automatic stages at many points from x = 140 mm to 240 mm in the next section. The dilata-Fig. 3 Energy flow for a QS wave. (a) Energy flow rate, (b) Energy flow
distributions.
[image:3.595.56.281.57.429.2] [image:3.595.313.538.68.258.2]of the reflected beam from the opposing side wall on which a retro-reflection tape was attached. The laser measurements utilized the small changes in refractive index that occurred because of waves in water19,20). Animations of wave
propaga-tion in water were created using multiple waveforms mea-sured in the area of 80 mm × 40 mm in Fig. 4.
3.2 Modal analysis using two-dimensional Fourier transform
This section discusses a QS wave through the measure-ments at the upper surface of the plate. Figure 5 shows the waveforms for the plate without a defect, measured at x = 150 mm: Fig. 5(a) 100 kHz incidence and a water-free plate, Fig. 5(b) 100 kHz incidence and a water-loaded plate, Fig. 5(c) 200 kHz incidence and a water-free plate, and Fig. 5(d) 200 kHz incidence and a water-loaded plate.
In Fig. 5(a), the first wave packet arriving between 80 μs and 200 μs is determined to be an A0 mode that traveled about 150 mm from the line source by the group velocity dis-persion curves for a water-free plate (the dashed lines in Fig. 1(b)). The second and third wave packets in Fig. 5(a) are the A0 mode reflected at the right and left edges of the plate. In Fig. 5(b), the wave packets appear slightly later than the ones in Fig. 5(a). Because a QS wave and an A0-like mode for a water-loaded plate have slightly smaller group velocities at 100 kHz than the one with the A0 mode for a water-free plate as shown in Fig. 1(b), the wave packets in Fig. 5(b) may be a QS wave and an like mode. Considering that an A0-like mode in a water-loaded plate can have a large attenuation as shown in Fig. 1(c), the wave packets in Fig. 5(b) can be estimated to be the QS wave. This is revealed more clearly using a two-dimensional Fourier transform analysis later in the paper. In Fig. 5(c) and Fig. 5(d) for a 200 kHz incidence, electromagnetic noises appeared from a time of 0 μs to 50 μs because high voltage signals were required by the ultrasonic transducer. Thereafter, in Fig. 5(c) for a water-free plate, the first wave packet was observed between 50 μs and 150 μs, and the second and third ones appeared at approximately 250 μs and 350 μs, respectively. From the group velocity dis-persion curves (the dashed lines in Fig. 1(b)), these wave packets are apparently the incident and reflected waves of the A0 mode. In Fig. 5(d) for a water-loaded plate, the first and second wave packets appeared at approximately 100 μs and 350 μs, slightly later than the ones in Fig. 5(c), which indi-cates that these are QS waves that have a smaller group
veloc-ity than the A0 mode for a water-free plate at 200 kHz, as shown in Fig. 1(b).
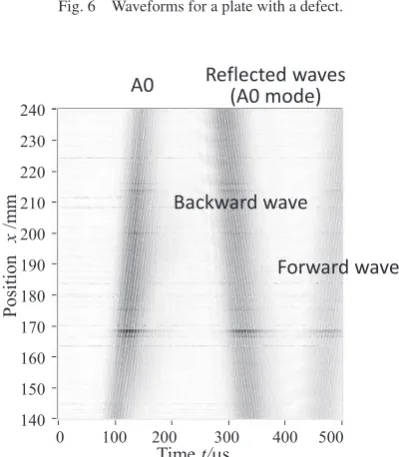
Figure 6 shows waveforms that were recorded for a plate with an artificial rectangular notch 1.0 mm in width and 1.0 mm in depth engraved on the back surface at x = 250 mm, using the same conditions as Fig. 5. Because the first wave packets appeared at the same moment as Fig. 5, they can be estimated to be an A0 mode for a water-free plate and a QS wave for a water-loaded plate. Between the first and second wave packets at 100 kHz, small waves appeared unlike any-thing in Fig. 5. These waves are reflected waves from the de-fect. On the other hand, at 200 kHz, reflected waves were not detected clearly owing to small signal-to-noise ratio (SNR).
In Figs. 5 and 6, the detected modes were estimated for a single waveform from the arrival time and theoretical group velocity dispersion curves. However, the guided wave modes were not identified for the first wave packet in Fig. 5(b) and the reflected waves in Fig. 6. Therefore, in this section, dis-persion curves are experimentally obtained using a two-di-mensional Fourier transform of multiple waveforms detected on the plate surface.
Figure 7 is a time (t)-position (x) image showing absolute values of time-domain waveforms at 401 different positions, at regular intervals in the x direction for a water-free de-fect-free plate. The receiving positions were 401 points from
x = 140 mm to x = 240 mm at intervals of 0.25 mm on the
[image:4.595.325.526.72.190.2] [image:4.595.68.268.72.186.2] [image:4.595.326.526.193.422.2]signal to the ultrasonic transducer was 3-cycle rectangular burst waves at 100 kHz. The waveform in Fig. 5(a) corre-sponds to the data at x = 150 mm in Fig. 7. Three dark bands can be clearly seen in the t-x image. Since the slopes of the dark bands correspond to the group velocities of the propa-gating waves, the dark bands indicate̶from the left to the right̶an incident A0 mode propagating in the +x direction, a reflected A0 mode in the −x direction, and a reflected A0 mode in the +x direction.
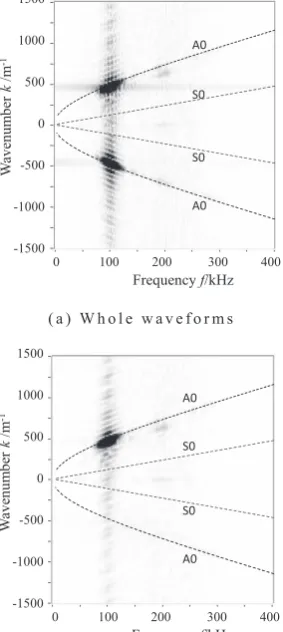
Calculating Fourier transforms of the 401 waveforms in the time and space directions provided a two-dimensional Fouri-er transform image in a frequency (f) and wavenumbFouri-er (k) domain as shown in Fig. 8(a). The dashed lines denote theo-retical dispersion curves calculated with the SAFE method for a 2 mm aluminum alloy plate. The data in the x direction is converted to the k direction, and hence ±k domains indicate guided waves propagating in the ±x directions. Because the measured data shown in Fig. 7 contain both forward and backward waves, dark areas are located in both ±k domains, as shown in Fig. 8(a). The dark areas are located on the theo-retical dispersion curve of the A0 mode, which proves that the detected waveforms were the A0 modes. Fig. 8(b) shows an
f-k image converted using the extracted waveforms between 0 μs and 250 μs that contain only an incident A0 mode travel-ing in the x direction. The dark area is located on the A0 curve only in the +k domain in Fig. 8(b) as expected.
To compare the results for 100 kHz incidence, Fig. 9 shows
t-x images for (a) a water-free and defect-free plate, (b) a wa-ter-free plate with defect, (c) a water-loaded intact plate, and (d) a water-loaded plate with defect, where Fig. 9(a) is the same figure as Fig. 7. Comparing Fig. 9(a) and Fig. 9(c), which show the differences between water-free and wa-ter-loaded plates, the dark bands for forward and backward waves can typically be seen, but the slopes of the bands are slightly different. This agrees well with theoretical prediction for group velocity dispersion curves (Fig. 4(b)) that a QS wave is slightly slower than an A0 mode for a water-free plate at 200 kHz mm (= 100 kHz × 2 mm). Next, comparing Fig. 9(a) and Fig. 9(b) for differences by defect, it can be found in the t-x image that waveforms after the first wave packet are distorted in Fig. 9(b). Similar distortions in wave-forms can be seen in Fig. 9(d). The wave distortions after the first dark band were apparently caused by reflections from the defect.
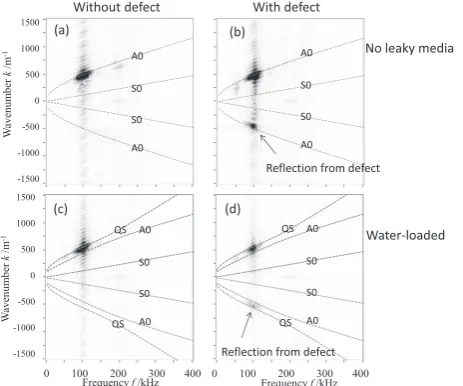
Figure 10 shows f-k images using extracted waveforms be-tween 0 μs and 250 μs as done in Fig. 8(b). The waveforms contain an incident wave from the line source and a reflected wave from the defect, but no reflected wave from the edge of the plate at x = 400 mm. Figures 10(a)–(d) correspond to Fig. 9(a)–(d), respectively. For an defect-free plate (Fig. 10(a) and Fig. 10(c)), dark areas cannot be seen in the −k domain, which indicates that there is no reflection, while dark areas are located in the −k domain in Fig. 10(b) and Fig. 10(d) for a defected plate, which shows reflection from the defect. It can also be found from the theoretical dispersion curves that the reflected waves from the defect were an A0 mode for the water-free plate and a QS wave for the water-loaded plate.
Figures 11 and 12 show t-x images and f-k images for an incidence of 200 kHz. The slopes of dark bands in Fig. 11(a) and Fig. 11(c) represent the group velocities at 400 kHz mm (= 200 kHz × 2 mm), and these modes are identified from Fig. 1(b) as an A0 mode and a QS wave, respectively. For a plate with defect (Fig. 11(b)), wave distortions were seen un-like in Fig. 11(a), which implies the detected waveforms were Fig. 8 f-k images for a water-fee and defect-free plate. (a) Whole
wave-forms (b) Extracted wavewave-forms from 0 to 250 μs.
[image:5.595.313.540.69.268.2] [image:5.595.98.240.75.392.2]affected by the reflection from the defect. On the other hand, in Fig. 11(d), such wave distortions cannot be seen, owing to a small SNR. Figure 12 shows f-k images obtained from the extracted waveforms between 0 μs and 200 μs that may con-tain an incident wave and a reflected wave from the defect. In Fig. 12(a) and Fig. 12(c), for defect-free plates, dark bands appear only on the theoretical lines of incident A0 and QS, while a small dark band was seen in the −k domain on the A0 mode line in Fig. 12(b). In Fig. 12(d), dark areas cannot be seen well in the −k domain because the reflected QS wave may be too small. This causes the small energy distribution appearing on the upper surface of a plate at higher frequen-cies as discussed in section 2. These results imply that the frequency band around 100 kHz is more effective for NDT of a 2-mm aluminum alloy plate, than a 200 kHz band. The hor-izontal dark bands at k = 0 denote the unchanged phase in
time domain, which is the electromagnetic noise seen around
t = 0 in Fig. 11.
The aforementioned experimental results prove that nor-mal vibration applied on the surface of a plate predominantly generates an A0 mode in a water-free plate and a QS wave in a water-loaded plate. Similar to the A0 mode of Lamb waves in a plate with a defect, a QS wave can reflect at a defect, and the reflected QS wave can be detected. However, because en-ergy distributions of a QS wave significantly vary in frequen-cy, the appropriate frequency should be selected. In this case, 100 kHz was found to be optimal.
Although a single line source was applied for fundamental experiments in this study, a QS wave can be enhanced with alternative ways. For example, multiple line sources with ap-propriate delays generate larger a QS wave and a reflected QS wave is enhanced using multiple line receivers by summation of multiple waveforms with appropriate time delays. Using such designated array transducers, a pulse echo inspection may be feasible with the less-dispersive and non-attenuated QS wave.
3.3 Visualization of QS wave in water
In the previous section, QS waves were analyzed by the waveforms detected on the surface of a plate. Since variations in refraction index along the path of a beam can also be mea-sured using LDV, ultrasonic waves can be meamea-sured in water by detecting a laser beam passing through it. Measurements of multiple waveforms in water provide an animation of wave propagation in water. In this section, QS waves in water and scattered waves around a defect are visualized by LDV mea-surements.
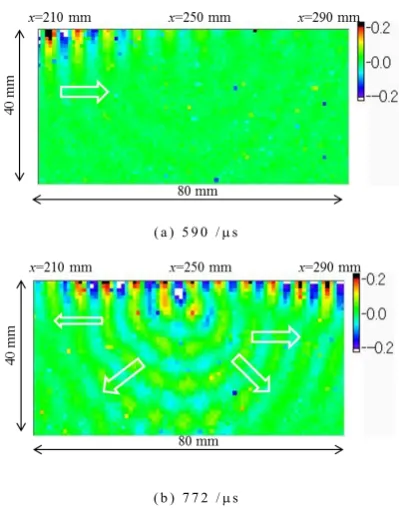
A laser beam is rastered over the measurement region of 80 mm × 40 mm in 1.0 mm increments as shown in Fig. 4. Figure 13 is the snapshot of wave distribution at two time steps for an incidence of 100 kHz. The waveforms are nor-malized by the maximum values of whole signals measured, and the signal values are shown in a color scale, where red and blue indicate 0.2 and −0.2 respectively, while black and white indicate values over ±0.2. In Fig. 13(a) at 590 μs, a QS Fig. 10 f-k images for an incidence of 100 kHz. (a) A water-free intact plate
(b) A water-free defected plate (c) A water-loaded intact plate (d) A wa-ter-loaded defected plate.
[image:6.595.55.287.70.263.2]Fig. 11 t-x images for an incidence of 200 kHz. (a) A water-free and de-fect-free plate (b) A water-free plate with a defect (c) A water-loaded and defect-free plate (d) a water-loaded plate with a defect.
[image:6.595.310.540.70.259.2] [image:6.595.54.282.332.529.2]wave propagates from the left to the right along the plate in-terface. In Fig. 13(b), at 772 μs, when most of the incident QS wave has propagated through the defect, small concentric waves generated at the defect were visualized.
For an incidence of 200 kHz, the snapshots in the same region at the same time steps are shown in Fig. 14. A QS wave with shorter wavelength propagates to the right, and scattered waves radiate at the defect. Although reflected QS waves cannot be ascertained clearly from measurements of the upper surface shown in the previous section, in reality, the
pipes filled with water. As predicted from group velocity dis-persion and attenuation curves, A0 mode and QS wave gener-ation was experimentally confirmed for a water-free plate and a water-loaded plate, respectively. QS waves reflected by a defect were also observed in the two-dimensional Fourier transform images in the frequency–wave number domain. Measurements of multiple waves in water using LDV enabled the creation of QS wave animation in water, and the visualiza-tion results revealed that QS waves propagated in water along the plate interface and radiated at the defect. In measurements with a 2 mm aluminum alloy plate, waves reflected from a defect can be obtained at 100 kHz, but not at 200 kHz. This is caused by a QS wave characteristic̶the variation of vibra-tion energy distribuvibra-tion in a cross secvibra-tion with frequency. In other words, the choice of an appropriate frequency is essen-tial for conducting NDT using a QS wave.
Acknowledgments
This work was supported by JSPS KAKENHI Grant Num-ber 15K12473.
REFERENCES
1) I. A. Viktorov: Rayleigh and Lamb Waves, (Plenum press, New York, 1967).
2) J. L. Rose: Ultrasonic Waves in Solid Media, (Cambridge University Press, 1999).
3) D.N. Alleyne, B. Pavlakovic, M.J.S. Lowe and P. Cawley: Insight 43 (2001) 93–96, 101.
4) P.J. Mudge: Insight 43 (2001) 74–77.
5) P. Cawley, M.J.S. Lowe, D.N. Alleyne, B. Pavlakovic and P. Wilcox: Mater. Eval. 61 (2003) 66–74.
6) J.L. Rose: J. Press. Vessel Technol. 124 (2002) 273–282.
7) T. Hayashi and M. Murase: J. Acoust. Soc. Am. 117 (2005) 2134–2140. 8) T. Hayashi and M. Nagao: M. Murase, J. Solid Mech. Mater. Eng. 2
(2008) 888–899.
9) T. Hayashi, W.-J. Song and J.L. Rose: Ultrasonics 41 (2003) 175–183. 10) T. Hayashi, C. Tamayama and M. Murase: Ultrasonics 44 (2006) 17–
24.
11) T. Hayashi, M. Murase and T. Abe: Review of Progress in Quantitative Nondestructive Evaluation 26 (2007) 169–176.
12) P.W. Loveday: J. Nondestruct. Eval. 31 (2012) 303–309.
13) S. Mariani, T. Nguyen, R.R. Phillips, P. Kijanka, F. Lanza di Scalea, W.J. Staszewski, M. Fateh and G. Carr: Struct. Health Monit. 12 (2013) 539–548.
14) T. Hayashi and D. Inoue: Ultrasonics 54 (2014) 1460–1469. 15) D. Inoue and T. Hayashi: Ultrasonics 62 (2015) 80–88.
16) S.I. Rokhlin, D.E. Chimenti and A.H. Nayfeh: J. Acoust. Soc. Am. 85 (1989) 1074–1080.
17) D.E. Chimenti and S.I. Rokhlin: J. Acoust. Soc. Am. 88 (1990) 1603– 1611.
18) V. Dayal and K. Vikram K: J. Acoust. Soc. Am. 85 (1989) 2268–2276. 19) K. Nakamura: Technical report of IEICE, US2001-9 (2001) pp.15–20
(in Japanese).
20) I. Solodov, D. Döring and G. Busse: Appl. Opt. 48 (2009) C33–C37. Fig. 13 Snapshots of wave propagation in water around a defect for an
in-cidence of 100 kHz. (a) 590 μs (b) 772 μs.
[image:7.595.69.268.69.314.2] [image:7.595.68.268.364.619.2]