Effects of Additives on the Surface Roughness and Throwing Power of Copper
Deposited from Electrorefining Solutions
*Atsuhiro Suzuki
1, Satoshi Oue
2, Shigeo Kobayashi
3and Hiroaki Nakano
21Department of Materials Process Engineering, Kyushu University, Fukuoka 819–0395, Japan 2Department of Materials Science & Engineering, Kyushu University, Fukuoka 819–0395, Japan
3Department of Applied Chemistry and Biochemistry, Kyushu Sangyo University, Fukuoka 813–8503, Japan
To elucidate the synergistic effects of gelatin, thiourea, and chloride ions on the surface roughness, throwing power, and polarization curves for Cu deposition from electrorefining solutions, Cu electrodeposition was performed at a current density of 200 A·m−2 and a charge of 5 × 10⁵ C·m−2 in an unagitated sulfate solution containing 0.708 mol·dm−3 of CuSO
4 and 2.04 mol·dm−3 of H2SO4 at a temperature of 60 C. In solutions containing all three additives (gelatin, thiourea, and chloride ions), the surface roughness of deposited Cu decreased with increas-ing thiourea and gelatin concentrations and decreasincreas-ing chloride ions concentration. On the other hand, the throwincreas-ing power of deposited Cu improved with decreasing thiourea concentration and increasing gelatin concentration in solutions containing all three additives. The throwing power of deposited Cu was significantly improved in solutions containing both gelatin and chloride ions. The polarization resistance dE/di for Cu deposition increased in solutions containing both gelatin and chloride ions, resulting in an improvement in the throwing power of Cu depo-sition. As small amounts of thiourea have a depolarization effect on Cu deposition, a smoothing effect is expected to result from the promotion of deposition at recesses. [doi:10.2320/matertrans.M2017215]
(Received July 7, 2017; Accepted September 1, 2017; Published September 29, 2017)
Keywords: copper, electrorefining, electrolysis, gelatin, thiourea, chloride ions, throwing power, surface roughness, polarization curve, depolarization
1. Introduction
In the electrorefining of Cu, gelatin1–3) and thiourea are added into the electrolyte to smooth the surfaces of deposits and suppress the codeposition of impurities. Chloride ions are also added to facilitate the formation of slime resulting from the anode. When gelatin, thiourea, and chloride ions are all added to the electrolyte, the cathode potential shifts toward the less noble direction, causing the crystal grains of the deposited Cu to become finer.4–8) The effects of straight-chain polymer additives9,10) (e.g., gelatin and polyethylene glycol), thiourea11,12) and chloride ions13–15) along with the synergistic effects16) of polymer additives and chloride ions on Cu electrorefining were reported. However, there are many ambiguities regarding the synergistic effects of gela-tin, thiourea, and chloride ions on the surface roughness and throwing power of deposited Cu.17–20) Therefore, in this study, the synergistic effects of these additives on the surface morphology, surface roughness, and throwing power of Cu deposited in the initial stage (Cu thickness of up to approxi-mately 18 μm) were investigated. The throwing power was quantitatively evaluated by measuring the thickness profile of deposited Cu. To consider the effects of the additives on the surface roughness and throwing power of the deposited Cu, the effects of gelatin, thiourea, and chloride ions on the polarization curve for Cu deposition were examined.
2. Experimental
Table 1 shows the solution and electrolysis conditions used to investigate the effects of additives on Cu electrode-position. An electrolytic solution was prepared by dissolving
reagent-grade CuSO4 (0.708 mol·dm−3) and H2SO4 (2.04 mol·dm−3) in distilled and ion-exchanged water. Gelatin (0.171, 1.71, and 17.1 mg·dm−3; standard concentra-tion = 1.71 mg·dm−3; Nippi Peptide, PA-10) with a mean molecular weight of 20000, thiourea (0.0225 to
2.3 mmol·dm−3; standard concentration =
0.0023 mmol·dm−3), and chloride ions (0.165, 1.65, 16.5 mmol·dm−3; standard concentration = 1.65 mmol·dm−3) in the form of HCl were added to the electrolyte. The stan-dard concentrations of gelatin, thiourea, and chloride ions were set based on the concentrations in a principal electro-lytic of a Japanese copper refinery. Cu sheets of 3 cm × 3 cm and 6 cm × 7 cm with sealed rear side were used as the cath-ode and ancath-ode, respectively. Electrcath-odeposition was per-formed in 0.5 L of unagitated solution under coulostatic (500 kC·m−2) and galvanostatic conditions (200 A·m−2) at 60 C. For general deposition, the electrolyte is agitated to make the solution composition and current density distribu-tion uniform and to decrease the thickness of the diffusion * This Paper was Originally Published in Japanese in J. Japan Inst. Met.
Mater. 81 (2017) 358–365.
Table 1 Electrolysis conditions. Bath
composition
CuSO5·5H2O (mol·dm−3) 0.708 H2SO4 (mol·dm−3) 2.04 Gelatin (mg·dm−3)
0.171(× 1/10), 1.71(×1), 17.1(×10) Thiourea(mmol·dm−3)
0.0023(×1/10), 0.023(×1), 0.23(×10), 2.3(×100) Cl− (mmol·dm−3) 0.165(×1/10), 1.65(×1), 16.5(×10) Operating
conditions
Anode current density (A·m−2) 200 Temperature ( C) 60
Cathode Cu (3 cm × 3 cm) Anode Cu (6 cm × 7 cm)
Amount of charge No stirring (C·m−2) 5 × 105 ×1: standard concentration, ×1/10: one tenth of standard, ×10: ten times of standard
layer of Cu2+ ions. However, in this study, the deposition was performed in unagitated solutions so the electrolyte is only circulated in the electrolysis tank during the actual electrorefining, and as a result, is almost quiescent except for convection at the cathode surface. Since gelatin was as-sumed to gradually decompose in the electrolyte, electrode-position was immediately conducted after its addition into the electrolyte. The polarization curve was obtained by mea-suring the corresponding cathode potential while changing the current density every 3 min in the range of 1 to 2,000 A·m−2. The cathode potentials were measured using a saturated KCl and Ag/AgCl reference electrode (0.199 V vs. a normal hydrogen electrode, 25 C). The potentials were plotted with reference to the normal hydrogen electrode.
The center area of the surface of deposited Cu was ob-served by scanning electron microscopy (SEM), and the ele-mental distribution was examined by electron probe micro-analysis (EPMA). The surface roughness of deposited Cu was evaluated by centerline average roughness Ra [Japanese Industrial Standard (JIS) B 0601] using a SURFCOM 1500DX-3DF instrument (Tokyo Seimitsu Co.). The surface roughness was evaluated at a cutoff wavelength of 0.8 mm, measurement length of 10 mm, and measurement rate of 0.15 mm·s−1 based on JIS. The throwing power of deposited Cu was evaluated by the thickness profile of Cu. The height of deposited Cu was measured at a cutoff wavelength of 0.08 mm, measurement length of 30 mm (sample edge to sample edge), and measurement rate of 3 mm·s−1 using a SURFCOM 1500DX-3DF instrument. The thickness of de-posited Cu was calculated as the difference in height before and after deposition. The x-axis and z-axis in thickness pro-file of deposited Cu show the measurement direction and thickness direction of Cu, respectively. The region where the slope (dz/dx) of the thickness profile of deposited Cu is less
than 0.3 μm·mm−1 was defined as flat areas, and the throw-ing power of deposited Cu was evaluated from the lengths of the flat areas.
3. Results and Discussion
3.1 Effects of additives on the surface morphology of
deposited Cu
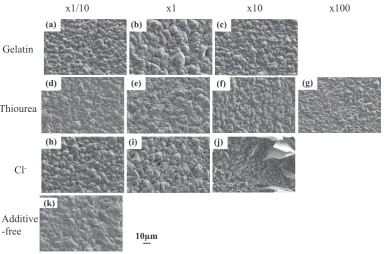
Figure 1 shows the SEM images of the surfaces of Cu de-posited from the solutions containing single additive (gela-tin, thiourea, and chloride ions). Cu deposited from the addi-tive-free solution (k) comprised aggregated crystals with sizes of approximately 10 μm. The grain size of Cu depos-ited from the solution containing 0.171 mg·dm−3 gelatin (a) was smaller than that of Cu deposited from the additive-free solution. In contrast, the size became larger when 1.71 mg·dm−3 gelatin was added to the solution (b). Further increasing the gelatin concentration to 17.1 mg·dm−3 (c) caused the Cu grain size to decrease. With the addition of thiourea, the grain size of deposited Cu decreased with in-creasing thiourea concentration [(d), (e), (f), and (g)]. On the other hand, with the addition of 0.165 or 1.65 mmol·dm−3 chloride ions [(h) and (i)], the concave and convex aggre-gated crystals of deposited Cu became more clear compared to those deposited from the additive-free solution. With the addition of 1.65 mmol·dm−3 of chloride ions (i), which is the standard concentration, the surfaces of the aggregated crys-tals were not smooth and comprised layers of plate-like crystals. Increasing the chloride ion concentration to 16.5 mmol·dm−3 (j), which is ten times the standard concen-tration, caused the morphology of deposited Cu to change significantly; the resulting deposits contained both fine grains and large plate-like crystals. The components of these fine grains and large crystals were examined by EPMA.
[image:2.595.107.492.500.754.2]Figure 2 shows the EPMA image of the surface of Cu de-posited from the solution containing 16.5 mmol·dm−3 chlo-ride ions. The analysis of the fine-grained crystals (b) within the square in (a) indicated components of CuCl besides Cu. Cu deposition from solution containing chloride ions was re-ported to proceed via CuCl,16) and CuCl deposits comprised squamous and fine-grained crystals.16) In this study, with the addition of 16.5 mmol·dm−3 chloride ions (ten times larger than the standard concentration), the detection of CuCl in deposits is due to that the large amounts of intermediate CuCl was formed and involved into deposits in the form of non-reduced state. Therefore, in the following experiment, the concentration of chloride ion in solutions was fixed at 0.165 or 1.65 mmol·dm−3.
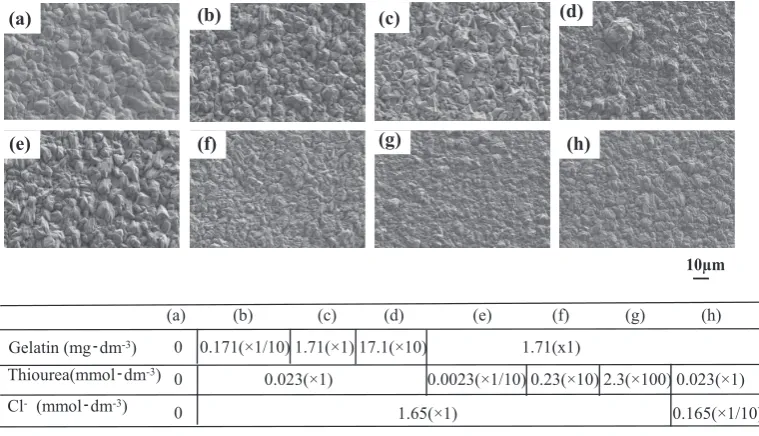
Figure 3 shows the SEM images of the surfaces of Cu de-posited from solutions containing various amounts of the three additives (gelatin, thiourea, and chloride ions). The standard concentrations of gelatin, thiourea, and chloride ions were 1.71 mg·dm−3, 0.023 mmol·dm−3, and 1.65 mmol·dm−3, respectively. With increasing gelatin con-centration, the crystal size of deposited Cu decreased [(b), (c), and (d)]. As shown in Fig. 1, with the addition of gelatin only, the grain size of deposited Cu was larger with the addi-tion of 1.71 mg·dm−3 gelatin than with 0.171 mg·dm−3,
dif-ferent from the trend observed for solutions containing all three additives. With the addition of thiourea and gelatin, the grain size of deposited Cu decreased with increasing thiourea concentration [(e), (c), (f), and (g)], identical to the trend observed for the addition of thiourea only. On the other hand, with addition of chloride ions, the grain size of Cu deposited from the solution containing 0.165 mmol·dm−3 chloride ions (h) was smaller than that of Cu deposited from the solution containing 1.65 mmol·dm−3 of chloride ions (c), and the surfaces of the deposits were smoother.
3.2 Effects of additives on the surface roughness and
throwing power of deposited Cu
Figure 4 shows the surface roughnesses of Cu deposited from the solutions containing single additives (gelatin, thiourea, or chloride ions). With the addition of thiourea at concentrations of 0.0023 and 0.023 mmol·dm−3, the surface roughness was almost identical to that of Cu deposited in thiourea-free solution. Upon increasing the thiourea concen-tration to 0.23 and 2.3 mmol·dm−3, the surface roughness of Cu significantly decreased. For the addition of chloride ions, the concentration of 0.165 mmol·dm−3 resulted in a larger surface roughness compared to the chloride ion-free solu-tion. Increasing the concentration to 1.65 mmol·dm−3 caused
Fig. 2 (a) EPMA image of the surface of Cu deposited from the solution containing 16.5 mmol·dm−3 of Cl− ions and (b) the elemental mapping of (a).
[image:3.595.112.484.382.508.2] [image:3.595.107.487.556.774.2]the surface roughness of Cu to increase further. On the other hand, the surface roughness of Cu deposited from the solu-tion containing 0.171 mg·dm−3 gelatin (1/10 of standard) was almost identical to that of Cu deposited from the gela-tin-free solution. Upon increasing the gelatin concentration to 1.71 mg·dm−3, the surface roughness increased. Further increasing the concentration to 17.1 mg·dm−3 resulted in a decrease in surface roughness. The surface roughness of Cu deposited from the solution containing single additive of gelatin almost corresponded to the surface morphologies shown in Fig. 1.
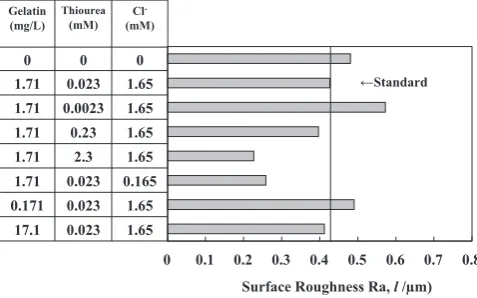
Figure 5 shows the surface roughnesses of Cu deposited from solutions containing the three types of additives. The surface roughness of Cu deposited from the solution con-taining the standard concentrations of the three additives was smaller than that of Cu deposited from the additive-free solution. However, when the thiourea concentration was de-creased to 0.0023 mmol·dm−3, the surface roughness of Cu became larger than that of Cu deposited from the addi-tive-free solution. This indicates that the addition of a low concentration of thiourea cannot counteract the increase in roughness generated by chloride ions. Increasing the thiourea concentration to 0.23 and 2.3 mmol·dm−3 caused the surface roughness of Cu to decrease significantly. Decreasing the concentration of chloride ions to 0.165 mmol·dm−3 (1/10 of the standard concentration) also caused the surface roughness of Cu to decrease greatly. This corresponds to the surface morphology shown in Fig. 3. On the other hand, decreasing the gelatin concentration to 0.171 mg·dm−3 increased the surface roughness, whereas in-creasing the gelatin concentration to 17.1 mg·dm−3 de-creased the roughness. That is, in the presence of all three additives, the surface roughness of Cu decreased with in-creasing gelatin concentration.
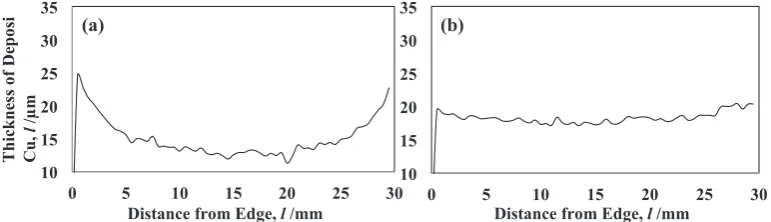
The synergistic effect of the additives on the throwing power of deposited Cu was evaluated from the Cu thickness profile. Figure 6 shows the thickness profiles of Cu depos-ited from solutions without additives and with the three ad-ditives at their standard concentrations. The Cu deposited from the additive-free solution (a) was thick at the edges and thin at the center. The Cu deposited from the solution con-taining all three additives (b) was somewhat thick at the
edges but more uniform than the Cu deposited from the ad-ditive-free solution. In this study, the region where the slope (dz/dx) of the thickness profile of deposited Cu is less than 0.3 μm·mm−1 was defined as flat areas, and the throwing power of deposited Cu was evaluated from the lengths of the flat areas. The x-axis and z-axis in thickness profile of de-posited Cu show the measurement direction and thickness direction of Cu, respectively.
Figure 7 shows the throwing powers of Cu deposited from solutions containing single additives. With the addition of chloride ions, the throwing power of Cu improved with in-creasing chloride ion concentration even though the chloride ions increased the surface roughness of Cu (Figs. 4 and 5). The throwing power also improved with increasing gelatin concentration, and the improvement obtained with 17.1 mg·dm−3 of gelatin (10 times the standard concentra-tion) was similar to that obtained with the addition of 1.65 mmol·dm−3 chloride ions (standard). With the addition of thiourea only, the throwing power of deposited Cu was somewhat improved compared to that of Cu deposited from the additive-free solution.
Figure 8 shows the throwing powers of Cu deposited from solutions containing two additives at standard concentration. The throwing power was improved for all the combinations of additives, and the best improvement was achieved by the addition of gelatin and chloride ions. The improvement was identical to that obtained with the addition of all three additives.
Figure 9 shows the throwing powers of Cu deposited from solutions containing the three additives in various concentra-tions. The addition of the three additives at the standard con-centrations significantly improved the throwing power com-pared to the additive-free solution. Decreasing the thiourea concentration to 0.0023 mmol·dm−3 further improved the throwing power of Cu. However, increasing the thiourea concentration to 0.23 and 2.3 mmol·dm−3 resulted in a worse throwing power compared to the standard thiourea concen-tration (0.023 mmol·dm−3). Although the throwing power of Cu was improved at any concentration of thiourea when only thiourea was added, in the presence of all three addi-tives, the throwing power depended significantly on thiourea concentration. Decreasing the chloride ion concentration from the standard concentration to 0.165 mmol·dm−3 caused Fig. 4 Surface roughnesses of Cu deposited from solutions containing
sin-gle additives.
[image:4.595.47.290.71.227.2] [image:4.595.307.546.72.221.2]the throwing power to worsen. The throwing power of Cu significantly decreased when the gelatin concentration was decreased to 0.171 mg·dm−3, whereas the throwing power was somewhat improved when the gelatin concentration was increased to 17.1 mg·dm−3.
3.3 Discussion of the effects of additives based on the
polarization curve of Cu deposition
[image:5.595.105.491.70.181.2]To discuss the synergistic effects of additives on the sur-face roughness and throwing power of deposited Cu, the ef-fects of the additives on the polarization curve of Cu deposi-tion were investigated. Figure 10 shows the polarizadeposi-tion curves for Cu deposition from solutions containing a single additive at the standard concentration. As can be seen from the cathode potential in the current-density region of 100 to 200 A·m−2 in the polarization curve magnified around 0.3 V and 200 A·m−2 [Fig. 10(b)], all the additives somewhat showed the polarization effect on the Cu deposition. However, with increasing current density above 200 A·m−2, thiourea showed a depolarization effect on the Cu deposi-tion; that is, thiourea promoted Cu deposition. At 200 A·m−2, the polarization resistance, which indicates the slope of the polarization curve (dE/di), was lower with the addition of thiourea compared to the additive-free solution.
Figure 11 shows the polarization curves for Cu deposition from solutions containing various amounts of thiourea as a single additive. As shown in Fig. 11(b), the polarization curve was polarized when the thiourea concentration was in-creased to 0.23 and 2.3 mmol·dm−3, while it was depolarized above 200 A·m−2 when the thiourea concentration was de-creased to 0.023 and 0.0023 mmol·dm−3. At 200 A·m−2, dE/ di was lower at thiourea concentrations of 0.023 and 0.0023 mmol·dm−3 compared to for the additive-free solu-tion. Thus, low concentrations of thiourea promote Cu deposition.
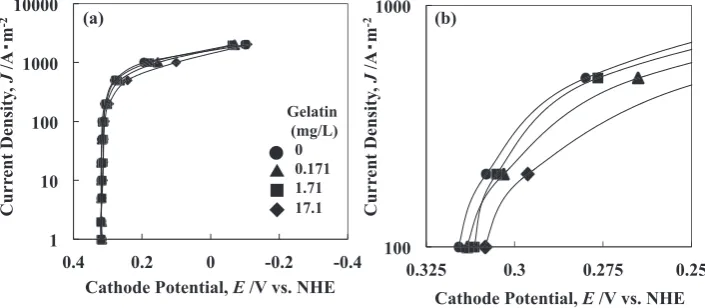
Figure 12 shows the polarization curves for Cu deposition from solutions containing various amounts of gelatin as a single additive. As indicated by the polarization curve mag-nified around 0.3 V and 200 A·m−2 [Fig. 12(b)], the polariza-tion was largest at the gelatin concentrapolariza-tion of 17.1 mg·dm−3. Little difference in polarization at 200 A·m−2 was observed between the additions of 0.17 and 1.71 mg·dm−3 gelatin. Upon increasing the gelatin concen-tration to 17.1 mg·dm−3, the surface roughness of deposited Cu decreased (Fig. 4), and the throwing power improved (Fig. 7), resulting in the larger polarization.
Fig. 6 Thickness profiles of Cu deposited from solutions without and with the three additives: (a) additive-free and (b) gelatin (1.71 mg·dm−3), thiourea (0.023 mmol·dm−3), and Cl−(1.65 mmol·dm−3).
Fig. 7 Throwing powers of Cu deposited from solutions containing single additives.
Fig. 8 Throwing powers of Cu deposited from solutions containing two kinds of additives.
[image:5.595.47.291.238.395.2] [image:5.595.46.291.453.549.2] [image:5.595.48.290.609.736.2]Figure 13 shows the polarization curves for Cu deposition from solutions containing various amounts of chloride ions as a single additive. As shown by the polarization curve magnified around 0.3 V and 200 A·m−2 [Fig. 13(b)], Cu deposition was polarized with the addition of 1.65 and 0.165 mmol·dm−3 chloride ion. It has been reported from the rotating ring disk electrode that Cu deposition from the solu-tion containing a small amount of chloride ions proceed via adsorbed intermediate CuClad.16) Since the equilibrium
po-tential for the reduction of CuCl to Cu is less noble than that of the reduction from Cu2+ to Cu, Cu deposition seems to be polarized by the addition of chloride ions.
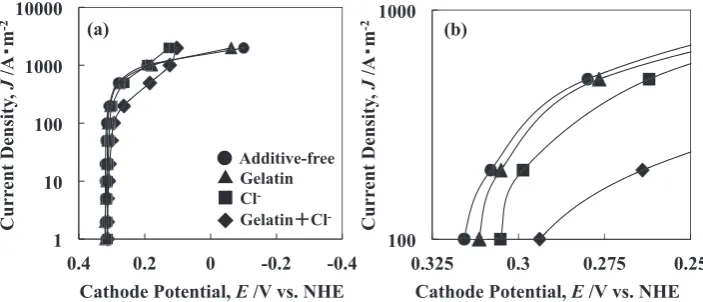
[image:6.595.119.479.71.224.2]Figure 14 shows the polarization curves for Cu deposition from solutions containing both gelatin and chloride ions. Although Cu deposition was hardly polarized by the addi-tion of gelatin only, it was significantly polarized in the pres-ence of both chloride ions and gelatin, indicating the syner-gistic effect of gelatin and chloride ions on polarization for Fig. 11 Normal (a) and magnified (b) polarization curves for Cu deposition from solutions containing various concentrations of thiourea as a single
[image:6.595.120.476.275.419.2]additive.
Fig. 12 Normal (a) and magnified (b) polarization curves for Cu deposition from solutions containing various concentrations of gelatin as a single additive. Fig. 10 Normal (a) and magnified (b) polarization curves for Cu deposition from solutions containing single additives: gelatin (1.71 mg·dm−3), thiourea
[image:6.595.121.474.478.632.2]Cu deposition. As mentioned above, Cu deposition from solution containing a small amount of chloride ions pro-ceeds through the intermediate CuCl.16) From the analysis of AC impedance method, the straight-chain polymer additive such as polyethylene glycol is demonstrated to suppress the reduction reaction from the adsorbed intermediate CuClad to metallic Cu.16) Gelatin is a straight-chain polymer like poly-ethylene glycol and seems to suppress the reduction of inter-mediate CuCl to metallic Cu, which may account for the synergistic effect of gelatin and chloride ions on the polar-ization of Cu deposition.
The throwing power of a deposit depends on the current distribution in the electrolytic cell. According to the model calculation of non-uniform current distribution, the distribu-tion of current density significantly depends on the polariza-tion resistance dE/di and becomes uniform with increasing polarization resistance.21,22) In this study, the improvement in the throwing power of deposited Cu with the addition of both gelatin and chloride ions (Fig. 8) is attributed to an in-crease in dE/di. A small amount of thiourea had a depolar-ization effect on Cu deposition (Fig. 11) and is expected to smooth the deposits as a result of the acceleration of Cu deposition in depressed areas. With the addition of all three additives, the throwing powers of Cu deposited from solu-tions containing high concentrasolu-tions of thiourea (0.23 and
2.3 mmol·dm−3) were worse than that of Cu deposited from the solution containing the standard concentrations of the three additives (Fig. 9). This result is attributed to the elimi-nation of the depolarization effect caused by the increase in thiourea concentration.
4. Conclusion
The effects of gelatin, thiourea, and chloride ions on the surface roughness, throwing power, and polarization curves of Cu deposited from electrorefining solution were investi-gated. The main conclusions are summarized as follows: (1) In solutions containing all three additives, the surface
roughness of deposited Cu decreased with increasing thiourea and gelatin concentration and decreasing chlo-ride ion concentration.
(2) The throwing power of deposited Cu was improved with decreasing thiourea concentration and increasing gelatin concentration in solutions containing all three additives. The throwing power of deposited Cu was significantly improved in solutions containing both gelatin and chlo-ride ions.
[image:7.595.121.477.70.228.2](3) The polarization resistance dE/di for Cu deposition in-creased in solutions containing both gelatin and chloride ions, resulting in the improvement of throwing power. Fig. 13 Normal (a) and magnified (b) polarization curves for Cu deposition from solutions containing various concentrations of chloride ions as a single
additive.
[image:7.595.121.473.285.436.2]As small amounts of thiourea have a depolarization ef-fect on Cu deposition, a smoothing efef-fect is expected owing to the promotion of deposition at recesses.
REFERENCES
1) C.L. Mantell: Electrochemical Engineering, (McGraw-Hill Book Company, Inc., New York, NY, U.S.A., 1960) pp.142–167, 185–192, 210–224.
2) Hitetsu Kinzoku Seiren, (Nippon Kinzoku Gakkai, Sendai, 1980) p.228, 241.
3) Denki Kagaku Binran, (Denki Kagaku Kyokai, Maruzen, Tokyo,1985) pp.308–327.
4) B. Veilleux, A.M. Lafront and E. Ghali: Can. Metall. Q. 41 (2002) 47–62.
5) K. Shimokawa: Thesis for doctoral degree, (Kyoto University, 2013) pp.19–22.
6) S. Goto, I. Asakura and C. Oshima: J. Mining and Metallurgical Inst. Jpn. 91 (1975) 131–136.
7) S. Goto, O. Ogawa, I. Asakura and C. Oshima: J. Mining and Metallurgical Inst. Jpn. 88 (1972) 99–102.
8) C. Imai and S. Yashima: J. Mining and Metallurgical Inst. Jpn. 73 (1957) 301–305.
9) H. Nakano, S. Oue, T. Ohgai, K. Izumi, T. Akiyama and H. Fukushima: Journal of MMIJ 119 (2003) 663–667.
10) K. Shimokawa, K. Kawaguchi, K. Nishida, K. Murase, H. Sugimura and Y. Awakura: Journal of MMIJ 128 (2012) 155–159.
11) H. Kuboyama, H. Nakano, S. Oue, H. Fukushima and S. Kobayashi: Journal of MMIJ 125 (2009) 62–67.
12) P. Laforest and M. Moats: Proc. Copper 2016,(The Mining and Materials Processing Institute of Japan, 2016) pp.2064–2075.
13) K. Shimokawa, D. Tetsuka, K. Shikada, K. Murase, H. Sugimura and Y. Awakura: Journal of MMIJ 129 (2013) 72–77.
14) K. Shimokawa, M. Narita, I. Sumida, K. Murase, H. Sugimura and Y. Awakura: Journal of MMIJ 126 (2010) 697–700.
15) A. Rodchanarowan and M.L. Free: Mater. Trans. 53 (2012) 1695–1698.
16) H. Nakano, S. Oue, K. Aoya, H. Kuboyama, H. Fukushima and S. Kobayashi: Journal of MMIJ 123 (2007) 165–170.
17) H. Nakano, S. Oue, Y. Tsuyama, H. Fukushima, S. Kobayashi and K. Tomioka: Journal of MMIJ 127 (2011) 662–666.
18) H. Nakano, S. Oue, T. Nishino, H. Kuboyama, H. Fukushima and S. Kobayashi: Journal of MMIJ 128 (2012) 590–595.
19) K. Ando, N. Tsuchida and H. Komi: Shigen-to-Sozai 118 (2002) 86–90.
20) H.M. Abbas and S.T. Najim: Int. J. Curr. Microbiol. Appl. Sci. 6 (2017) 270–284.
21) M. Matlosz, C. Creton, C. Clerc and D. Landol: J. Electrochem. Soc.
134 (1987) 3015–3022.