The Twinning Microstructure and Damping Behavior in Mn–30Cu (at%) Alloy
Fuxing Yin
1, Takuya Sakaguchi
2, Qingchao Tian
3, Atsuko Sakurai
1and Kotobu Nagai
1 1National Institute for Materials Science, Sengen 1-2-1, Tsukuba 305-0047, Japan2Material Engineering Div III, Toyota Motor Corporation, Susono 410-1193, Japan 3
Technology Center, Baoshan Iron and Steel Co. Ltd., Shanghai 201900, China
The twin boundary damping peak and the transformation damping peak constitute the temperature dependent damping behavior in Mn–Cu alloys. In order to observe the effects of twinning microstructure on the twin boundary damping behavior, a Mn–30 at%Cu alloy was finally treated by furnace cooling (FC) and aging after water-quenching (AG), respectively. Regular twin bands with the similar widths along some {101} twin boundary were observed in FC treated condition, while intersected twin bands with pointed fronts belonging to different {101} twin boundaries occurred in the AG treated specimens. Meanwhile, the twin boundary damping features were obtained based on dynamic mechanical analyzer (DMA) measurement, and increased activation energy and decreased peak damping capacity were found in the AG treated alloy. The distortion state of the interfaces enclosing the decomposed nanometer regions was considered to influence the twinning microstructure formation and hence alter the damping features of the twining microstructure.
(Received May 2, 2005; Accepted August 31, 2005; Published October 15, 2005)
Keywords: Manganese-Copper damping alloy, damping capacity, decomposition, twin boundary, phase transformation
1. Introduction
Sugimotoet al.first characterized the temperature depend-ent damping behavior of Mn–Cu alloys by ‘‘main peak’’ and ‘‘sub-peak’’ that occurred during a heating measurement of internal friction.1) The ‘‘main peak’’ occurred nearly at the same temperature irrespective of the different alloy compositions and shifted to higher temperatures at higher frequencies. The peak was therefore attributed to a relaxation process associated with the movement of the {101} twin boundaries in the face centered tetragonal (FCT) phase of Mn–Cu alloys. On the other hand, the ‘‘sub-peak’’ occurred at a temperature that was linearly related to the Mn content in the binary Mn–Cu alloys and was related to the phase transformation process from FCT phase to face centered cubic (FCC) phase. In most cases, two peaks behaved in a compound form due to the high frequency (>300Hz) used in that measurement.1)Recently the two-peak damping behav-ior related to the variation of temperature in Mn–Cu alloys was clearly exhibited when low vibration frequencies (0.1– 10 Hz) was applied in the dynamic mechanical analyzer (DMA) measurement.2)It was found that the transformation damping peak occurred corresponding to the minimum of Young’s modulus at a temperature depending on both the alloy composition and the treating condition. In contrast, the twin boundary damping peak appeared in the vicinity of 220 K, and shifted to higher temperatures with the increased vibration frequency.
Since the transformation damping peak shows an obvious transient features, i.e. decreased magnitude at slow heating rate and high frequencies, the damping capacity of Mn–Cu alloys should be contributed mostly by the twin boundary damping behavior. In the engineering sense, a larger and broad twin-boundary damping peak is expected for the high damping Mn–Cu alloys. In a previous work, Ni addition to Mn–Cu alloys was observed to not only increase the magnitude of the twin boundary damping peak, but also broaden it with the decreasing activation energy.3) Ni addition in Mn–Cu alloys increased the resistance to phase
decomposition of FCC phase, and therefore resulted in the lower phase transformation temperature from FCC phase to FCT phase. The decreased twin boundary distortion corre-sponding to the larger axis ratioc=ain the FCT phase of Ni added Mn–Cu alloys was considered to be the reason for the larger and broadened twin boundary damping peak. Another mechanism describing the effect of Ni addition on the twin boundary damping behavior can be related to the features of the twinning microstructure. Ni addition influences the phase decomposition of FCC phase, and therefore has some effects on the twinning microstructure that forms in the decomposed matrix. Recently, Markova indicated that the degree of phase decomposition in FCC phase might influence the trans-formation damping peak features in the aged Mn–40 at% Cu alloy.4) It was suggested that twin variants appeared and grown on the background of the structure decomposed to a certain degree had a sufficiently large damping capacity. However, this work has not unambiguously characterized the difference of twin boundary damping peak behavior for Mn– Cu alloy with different decomposition structures. In the present work, a Mn–30 at% Cu alloy is heat-treated in different ways to obtain various decomposition structures in the high temperature FCC phase. The twin boundary damp-ing behavior is characterized for each treated condition, and related to the features of twining microstructure formed on the different decomposition structures.
2. Experimental Procedure
The Mn–30 at% Cu alloy ingot is obtained by induction-melting the industrially pure metals in an argon atmosphere. Hot forging and rolling at 1173 K are applied to the ingot and alloy sheet of 1 mm thick was finally obtained from cold rolling. After the solid solution treatment at 1173 K for
3:6103s, the sheet specimens are water-quenched or continuously cooled to room temperature in3:6104s, the slow cooling treatment is named as FC. Meanwhile, the water-quenched specimens are further aged at 723 K for
1:2104s and 7:2105s, respectively. The aged
mens for1:2104s and7:2105s are then assigned with the name of AG5 and AG20, respectively.
The damping behavior of the alloy in the three treating conditions was evaluated on a dynamical mechanical analyz-er (DMA) in the 3-point bending vibrating mode for the
11060mm specimens at a certain surface strain-amplitude of 2:5105. The principles of DMA method
were described concretely in a previous work.5) During heating the specimens at 0.05 K/s, vibration in the frequency of 0.1, 1 and 10 Hz is alternatively applied. As the result, Young’s modulus and damping capacity (tan) varying with the increasing temperature are obtained. Electron back-scattering diffraction (EBSD) system (TSL Inc.) equipped on a LEO-1550 scanning electron microscope (SEM) (Carl Zeiss Inc.) and JEM-2000FX transmission electron micro-scope (TEM) are used to analyze the microstructure of the alloy in different treated conditions. X-ray diffractometer and differential scanning calorimeter (DSC) are also applied for crystal structure and transformation feature analysis of the specimens.
3. Results and Discussion
Figure 1 shows the heat flow curves of the alloy in the three treated conditions during the heating process. Obvious endothermic peaks are found in the specimens that corre-spond to the structural transformation from low-temperature stable FCT phase to the high-temperature stable FCC phase. Two features can be found by comparing the three thermal peaks of the specimens; phase transformation temperature, indexed with the temperature where the peak occurs, is changed by the treating condition. With the linear relation-ship between transformation temperature and Mn content in Mn–Cu alloy,6)the corresponding Mn content in the decom-posed Mn-rich region is calculated to be 90.6, 91.7 and 94.2 at% for FC, AG5 and AG20 treated specimens, respectively. The three treating conditions correspond to the different decomposition stages of FCC phase in the alloy since the Mn content becomes richer in the Mn-rich regions. On the other hand, the endothermic transformation peak of
AG5 specimen is much more broadened than that of FC specimen; even the Mn contents in the Mn-rich region for the two treating conditions are quite similar. It is therefore adequate to consider that different twinning microstructures have formed in the three specimens according to the different shapes of DSC peak. The phase transformation of Mn–Cu alloy during heating includes both the disappearance of the twinning microstructure and crystal structure change from FCT to FCC. The different treating conditions that determine the phase decomposition process change not only the composition feature of Mn, Cu-rich regions, but also the region scale and interface features. These features may extensively alter the twinning microstructure appeared below the phase transformation temperature.
Figure 2 shows the variations of Young’s modulus and
tan with temperature in the FC (a) and AG20 (b) treated conditions, respectively. Minimum Young’s modulus occurs at 406 and 423.3 K for the two specimens respectively, several degrees lower than the endothermic peak indicated phase transformation temperature. On the other hand, temperature dependent damping behavior in both specimens is characteristic of the two damping peaks; the transforma-tion-damping peak occurred at lower temperatures than the minimum Young’s modulus temperature and the twin boundary damping peak in the vicinity of 220 K shifting to higher temperature with the increased frequencies. When we think that the endothermic peak reflects the kinetics of phase transformation, the transformation-damping peak should reflect the kinetics of the induced transformation under the external dynamic stress. Therefore the transformation damp-ing peak temperature indicates a state where FCC/FCT phase interfaces are most easily displaced by the vibrating stress. This is only a phenomenological deduction based on the transformation-damping peak that occurs at temperature below the endothermic peak temperature. Nevertheless, the temperature difference between the damping peak and endothermic in the three specimens should be also an indicator for the twining microstructure that transforms to FCC phase with or without the supplemented dynamic stress. It is found that the temperature difference is only 24 K for the FC specimen, but 36 K and 38 K for AG5 and AG20 specimens, respectively.
The activation energy and damping capacity of the twin boundary damping peak in Mn–30 at% Cu alloy in different treating conditions are shown in Figs. 3(a) and (b), respec-tively. The activation energy,HshiftandHprofile, are calculated with damping peak shift method under the three vibration frequencies and peak profile fitting method for the damping peak of 0.1 Hz, respectively.3) It is observed that the activation energy for the twin boundary damping is increased when the heat-treatment is changed from FC to AG, and also with increased aging time. Meanwhile, according to the analysis in a previous work,3) the width of the Gaussian distribution of relaxation time for the twin boundary damping is defined as, 2ðÞ, and it is calculated with 2ðÞ ¼
Hshift=Hprofile. The width of relaxation time distribution shows a decreasing variation at the treating condition sequence from FC to AG5 and then AG20. On the other hand, the damping capacity in the twin boundary damping temperature range is deconvoluted into peak damping capacity and background FC
AG5 AG20
[image:2.595.61.279.572.735.2](base) damping capacity through peak profile fitting of the overall damping peak. As shown in Fig. 3(b), for the treating condition sequence mentioned above, the slightly increasing overall damping capacity is attributed to obvious decreases of peak damping capacity and the increases of the base damping capacity. It becomes clear that the twinning microstructure formed during FC treatment shows the lower activation energy and high peak damping capacity for the relaxation type damping than that formed during the AG treatment.
Figure 4 shows the orientation image microscope (OIM) and TEM micrograph of the twinning microstructure of the FC treated specimen. The twinning bands with similar widths are observed to be regularly oriented to the same twin boundary in every crystalline grain, as shown in Fig. 4(a). TEM observation [Fig. 4(b)] has revealed the secondary twinning bands occurred within the twinning bands shown by OIM analysis. The width of the secondary twining band is about 100 nm, while the OIM observed twining band is much wider in the range of 1–5mm after correction from the tilt angle of the bands. Figure 5(a) shows the OIM twinning microstructure of the AG5 treated specimen. In contrast to that in the FC specimen, twinning bands oriented to different {101} twin boundaries are observed within one grain in the intersected morphology, and the bands with the same twin boundary show the varied widths. Twinning bands belonging to 4 kinds of {101} twin boundaries (a,b,c,d) are shown Fig. 5(b), and the orientation of each boundary is indexed by the pole figure (PF) projected to the normal direction of the
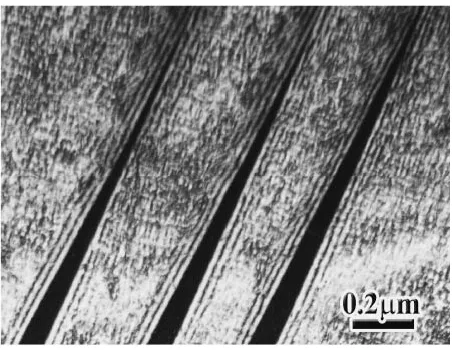
observed specimen plane, as shown in Fig. 5(c). The normal direction of the twin boundary usually tilts from the normal direction of specimen, which can be found in the PF. After correction of the tilt angle of the twin boundaries, the width of twin bands is found to be also in the range of 1–5mm. It is noted that the twin bands show pointed heads as the result of intersection with other twin bands in the aged specimen. Two reasons are tentatively considered to provoke the occurrence of the intersected twin bands in each grain. One is the simultaneous nucleation of twin bands that belong to differ-ent {101} twin boundaries, and the other is the strain accumulation or strain barrier in the matrix (base twin variant) at the front region of the longitudinally growing twin bands. However, the broadened transformation process from the FCT phase characteristic of the twinning microstructure to FCC phase in the aged specimens can not be easily explained by the simultaneous nucleation of twin bands belonging to different {101} boundaries. Figure 6 shows TEM micrograph of the pointed twin bands observed in AG5 specimen. It is obvious that the fringes decorating the twin boundaries become intensified with the sharpening of the bands in the growing direction. There exist strain fields in the aged FCC phase, which may constrain the growth of twin bands through the whole grain or distort the planar twin boundary to a certain extent.
Twinning microstructure observation indicates that phase decomposition process of FCC phase occurred during FC or AG treatments produces different decomposed
microstruc-a
b
Fig. 2 The variation of Young’s modulus andtanwith the heating temperature measured on DMA under different vibration frequencies for Mn–30 at% Cu alloy in FC (a) and AG20 (b) treated conditions, respectively.
a
b
Fig. 3 The twin boundary damping features dependent on the treating condition on Mn–30 at% Cu alloy. Activation energy (a) is calculated with peak shift and profile fitting methods, respectively.2ðÞindicating the width of Gaussian relaxation time distribution.
[image:3.595.104.496.71.202.2] [image:3.595.92.504.253.394.2]ture, even the Mn composition in the Mn-rich regions is nearly the same in the two treating conditions. XRD experiment shows the increased full width at half magnitude
(FWHM) of (200) diffraction peak when treating condition is changed from FC to AG or the aging time is extended. Meanwhile, the hardness of the microstructure is also observed to increase at the same variation of treating condition. It is clear that the interfaces between the Mn-rich and Cu-rich regions become much distorted in the AG specimens, and the elastic strain field in the interfaces may hinder the parallel growth of twin bands.
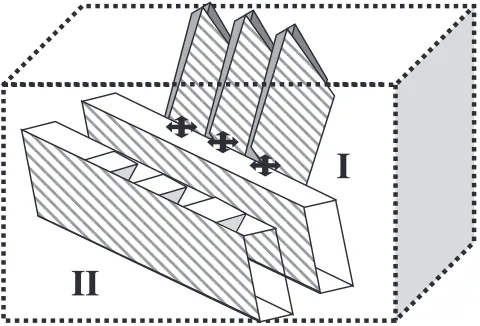
In Ni added Mn–Cu alloys, the decreased activation energy for the relaxation damping of twining microstructure was attributed to the decreased distortion at the twin boundaries, since the axis ratio, c=a of the FCT phase was obviously changed with Ni addition.3) However, XRD experiment confirms the equivalence of the lattice constants of the FCT phase in the three treating conditions. Therefore the damping features of the twinning microstructure in the different treating conditions can be all attributed to configuration of twin bands formed in the different decomposed micro-structures. As schematically illustrated in Fig. 7, the inter-section of twin bands or the constrained growth front of twin bands in the AG treated specimen should have caused the increased activation energy and the decreased peak damping
a
b
Fig. 4 Orientation imaging microscope (OIM) micrograph, (a) and TEM micrograph, (b) showing the twinning microstructure formed in FC treated Mn–30 at% Cu alloy.
a
b
c
Fig. 5 Orientation imaging microscope (OIM) micrographs, (a) and (b), showing the twining microstructure in AG5 treated Mn– 30 at%Cu alloy. The respective orientation of the four kinds of twin boundaries shown in (b) is indicated in the pole figure, (c) projected to the normal direction of the observed area.
[image:4.595.92.507.76.248.2] [image:4.595.103.494.300.466.2] [image:4.595.56.282.528.703.2]capacity, in comparison to the regularly arranged twin bands in the FC treated specimens. The movement response of the twin boundaries under a cyclic stress needs to overcome a larger energy barrier since part of the twin boundaries are locked by the intersected twin band or strain constraint. Meanwhile, when the interfaces enclosing the decomposed regions have a strong strain field, the twinning occurs only within the Mn-rich regions in the scale of about 20 nm.6)So the high base damping capacity overlapped with the twin boundary damping peak in the AG specimens is probably contributed from the nanometer sized local twins. The local small twins may have a specific damping behavior and mechanism different to those of the micrometer sized twin bands that are commonly observed in Mn–Cu alloys.
4. Conclusions
The temperature dependent damping behavior of a Mn– 30 at%Cu alloy in furnace cooling (FC) and aging after water-quenching (AG) treatments is investigated with DMA
measurement. The endothermic peak obtained by DSC measurement and the phase transformation related damping peak show a broadened transformation process from FCT phase to FCC phase in the aged alloys. The varied phase transformation features are attributed to twinning micro-structure that is changed when Mn–30 at% Cu alloy is finally treated by FC, AG5 and AG20 treatment.
The relaxation type damping peak related to the twinning microstructure in the alloy is characterized by activation energy, relaxation time distribution width, peak damping capacity and base damping capacity. It is observed that the AG treatment or prolonged aging time results in the increased activation energy and decreased peak damping capacity, as well as the increased base damping capacity. Orientation imaging microscopy (OIM) and TEM have confirmed the difference of twinning microstructure of Mn–30 at%Cu alloy in the three treating conditions. Regularly arranged twin bands with the same orientation and similar width are observed in the FC specimen, in contrast the intersected twin bands with the pointed fronts seem to easily form in the AG treated specimens. The strain field at the interfaces that enclose the decomposed regions is tentatively proposed based on the XRD and hardness results. Those strain fields may restrict the growth of twin band along one {101} twin boundary, and also lock the twin boundaries for the damping effect.
REFERENCES
1) K. Sugimoto, T. Mori and S. Shiode: Met. Sci.7(1973) 103–108. 2) F. Yin, S. Takamori, Y. Ohsawa, A. Sato and K. Kawahara: J. Jpn. Inst.
Met.65(2001) 607–613.
3) F. Yin, K. Nagai, K. Watanabe and K. Kawahara: Mater. Trans. 44
(2003) 1671–1674.
4) G. V. Markova: Mater. Sci. Eng. A370(2004) 473–476.
5) F. Yin, Y. Ohsawa, A. Sato and K. Kawahara: Mater. Trans.43(2002) 466–469.
6) F. Yin, Y, Osawa, A. Sato and K. Kawahara: Acta Mater.48(2000) 1273–1282.