Effects of Solid Fraction on the Heat Transfer Coefficient
at the Casting/Mold Interface for Permanent Mold
Casting of AZ91D Magnesium Alloy
Jer-Haur Kuo, Ruey-Jer Weng
*and Weng-Sing Hwang
Department of Materials Science and Engineering, National Cheng Kung University, Tainan 701, Taiwan, R. O. China
The interfacial heat transfer coefficient (HTC) between the steel mold and AZ91D magnesium (Mg) alloy that cast under various initial solid fractions were investigated in this study.
The interfacial HTC was determined by using an Inverse Method with measured temperature data and known thermo-physical properties. A Computer Aided Cooling Curve Analysis technique was used to determine the solid fraction versus temperature relationship. To comply with the requirements of the Inverse Method, a one-dimensional heat transfer system from the casting to the mold was designed for the permanent mold casting of AZ91D Mg alloy in molten and semisolid states.
Experiments were conducted with different initial solid fractions of 0, 30, and 50%. The results indicate that the HTC profile of molten AZ91D during solidification can be divided into five stages, while casting with semisolid AZ91D only into three. During each stage, the casting/ mold interfacial conditions vary, which in turn causes the HTC values to vary. These data are critical for any solidification model of permanent mold casting and semisolid casting to obtain a reliable prediction of the thermal profile inside the solidifying casting and its freezing time. [doi:10.2320/matertrans.47.2547]
(Received May 23, 2006; Accepted August 18, 2006; Published October 15, 2006)
Keywords: heat transfer coefficient, inverse method, magnesium alloy, semisolid casting, permanent mold casting
1. Introduction
Conventional casting methods are based on the pouring of a thoroughly molten metal into cavities of a die, while semisolid casting uses slurry-molten metal, which contains a certain volume fraction of solid phase. The most frequently reported benefits of semisolid forming process include energy savings, increased design flexibility of final product with low porosity, uniform microstructure, superior mechan-ical properties and surface finish. Since major benefits are primarily attributed to globular solid particles within the slurry, their influence is on preserving a laminar mold-filling front and causing less entrapped air and less porosity during solidification.
For conventional and semisolid permanent mold casting, due to a higher cooling rate and better surface finish as compared to sand casting, it needs better control over the heat transfer and solidification phenomena to improve the me-chanical properties and soundness of the castings. If accurate temperature profiles for the whole casting period can be obtained, the solidification related defects can be alleviated and the desirable microstructure of solidified casting can be obtained through the modifications of the casting design and operation.
In recent years, the production of castings has been greatly assisted by the employment of mold filling and solidification models. The application of solidification models to simulate the thermal profiles inside the solidifying casting has also gained much popularity for analyzing casting processes. To accurately simulate solidification phenomena, these models require knowledge of the thermo-physical properties of the casting alloy and the mold as well as the heat transfer conditions between the casting and the mold. For permanent
mold casting, the heat extraction from the casting is predominantly controlled by the casting/mold interface. During solidification in metallic molds, the interfacial gap formed by the interaction between the solidifying casting and the mold, creates a thermal resistance to heat flow and therefore, reduces the heat transfer and solidification rates. The heat transfer behavior of the interface is usually characterized by an interfacial heat transfer coefficient (HTC),h. It is then critical for any solidification model of permanent mold casting to have an accurate data of h for obtaining a reliable prediction of the thermal profile inside the solidifying casting and its freezing time.
In the literatures, there are two methods to measure and calculate the interfacial HTC. The first method is to measure the size of the air gap (x). When the chemical composition and thermal conductivity (k) of the air/gas mixture is known, the interfacial HTC (h) between casting and mold can be simply estimated byh¼k=x.1–3)The major disadvantage of this method is that the accurate value of k, which is the thermal conductivity of the air/gas mixture, is difficult to obtain. The second method for obtaining the interfacial HTC is to use the Inverse Method, which was developed by J. V. Beck.4) For this method, the temperature distribution and
variation during the casting have to be measured. With the other thermo-physical properties known, the interfacial HTC can be derived by via using the Inverse Method. However, the Inverse Method can only be used for one-dimensional heat transfer systems. To comply with the requirements of the Inverse Method, a one-dimensional casting to mold heat transfer system needs to be employed.5–7)
In our previous study,8) the interfacial HTC, h, at the interface between A356 aluminum alloy casting and metallic mold with various coatings were measured. It was found from the measurements that for all cases the variation ofhversus temperature (h-T) curve can all be categorized into five *Graduate Student, National Cheng Kung University
stages. And the characteristics of the five stages and the effects of coating type and thickness as well as mold type on the variation of h were discussed. Today, the heat transfer conditions between the casting and the mold for semisolid casting process are difficult to find. The comparison and detailed description of the heat transfer condition at casting/ mold interface between solidification from liquids state and semisolid state are also rarely seem.
The purpose of this study is to employ the Inverse Method to obtain the variation of interfacial HTC between fully melted and semisolid AZ91D magnesium alloy and SKD-61 mold during solidification. The present work also developed an experimental setup and procedure to achieve the well-controlled unidirectional solidification condition and less turbulence of molten metal generated during pouring. Inert gas was used to prevent the magnesium (Mg) alloy from oxidation during the heating process in this system. To make the h data useful for mathematical modeling of the solid-ification phenomena in casting, a procedure was also developed to obtain the relation between the h value and the casting temperature at the interface. The effects of initial solid fraction setups of AZ91D Mg alloy on the variation ofh
were discussed in this study.
2. Methodology
2.1 Principles of the estimation of interfacial heat transfer coefficient with Inverse Method
The structure of Inverse Method adopted in this study was proposed by Beck.4) For the analysis of a heat transfer problem, an appropriate set of equations is first determined to describe the heat transfer behavior. With the boundary conditions, initial condition, and thermo-physical properties of the material known, it is possible to obtain the temperature distribution and variation of the whole system. However, if one of the thermo-physical properties of the material is not known, but the temperature information can be obtained, it is possible to calculate this unknown property by a reverse scheme, which is the basic idea of the Inverse Method.
To make use of the Inverse Method to determine h, temperature information has to be known. Therefore, temper-ature measurements are required. To make the analysis of the Inverse Method more manageable, a unidirectional heat transfer system is devised. It requires temperature measure-ments at least at three points. Two serve as the boundary conditions of the heat transfer system and the third one as the calibration point. A detailed description of the Inverse Method to manipulate the temperature data forhwas shown in one of our previous studies.8) The algorithm and the
corresponding computer program were also constructed in that study.
2.2 Principle and procedure of Computer Aided Cool-ing Curve Analysis (CA-CCA)
There are at least two methods to mathematically derive the quantities from the cooling curve for creating a latent heat release model as well as solid fraction (fs) versus temperature relationship (fs-T). One technique was devel-oped by Argyropoulos and et al.9) and the other was developed by Stefanescu and et al.10) The principles and
procedures of Stefanescu’s method were used in this study and the detail equations can be found in the reference.11)The
assumptions of CA-CCA are: (1) Cooling behavior of the molten metal in a small crucible can be considered to be a lumped system; the Biot number (Bi¼hV=Ak) is smaller than 0.1. (2) During cooling, the density and specific heat of the molten metal remain constant and do not vary with respect to temperature. (3) The predominant mechanism for extracting heat from the system is through convective heat transfer between the crucible and the surrounding atmo-sphere. Conduction is not significant and can be neglected.
A detailed description of the CA-CCA Method to manipulate the measured temperature data for obtaining the
fs-Trelationship was shown in one of our previous studies.11) The algorithm and the corresponding computer program were also constructed in that study.
2.3 Treatment of latent heat releases of AZ91D magne-sium alloy
The solidification heat transfer system considered in the analysis includes one important term which is the latent heat of the casting alloy. The latent heat (L) is released when the temperature of the casting metal falls in the solidification range. To extract this additional heat, the specific heat,Cpis replaced by an effective specific heat,Cp, in the following manner.
Cp¼Cp@fs
@t L ð1Þ
and
@fs
@t ¼
@fs
@T
@T
@t ð2Þ
The relation of fs as a function of temperature in the solidification range must be determined first and then the solidification analysis can be conducted. In this study, thefs
as a function of temperature was obtained from CA-CCA method described in the previous section.
3. Experimental Method
3.1 Experimental setups and procedures of CA-CCA method
In this study, the AZ91D Mg alloy was investigated. The compositions of the alloys were analyzed and shown in Table 1. The experimental apparatus used in this study included a crucible, two K-type thermocouples, a data logger, and a heating furnace with full of saturated Argon. The crucible was made out of 0.5 mm thick steel plate, with inner diameter of 30 mm and height of 40 mm.
The experimental procedures were to first put the AZ91D alloy into the crucible. And the crucible was placed in the furnace with Argon atmosphere and heated the alloy to 615C. The crucible was then immediately pulled up by steel
Table 1 Chemical compositions of the AZ91D magnesium alloy used in this study.
C Mn Si Cr Mo V Al Zn Mg
wires not to contact with the wall of furnace. And then, shutting down the heating plates and increasing of Argon flow rate were conducted to cool down the alloy. Two thermocouples were inserted into the crucible; one at the center position and the other near the wall. The illustration of the experimental setup and procedures for CA-CCA method are shown in Fig. 1. The cooling curve was recorded by the data logger at a rate of 1 Hz. After solidification, the collected cooling curve data were then processed in various ways using a spreadsheet. They included different smoothing and curve fitting techniques. The average at every five points for smoothing was proved to be almost identical to five-point central smoothing. The calculations were performed with the temperature data from the central. Finally, the CA-CCA method was employed to calculate the relationship between solid fraction and temperature.
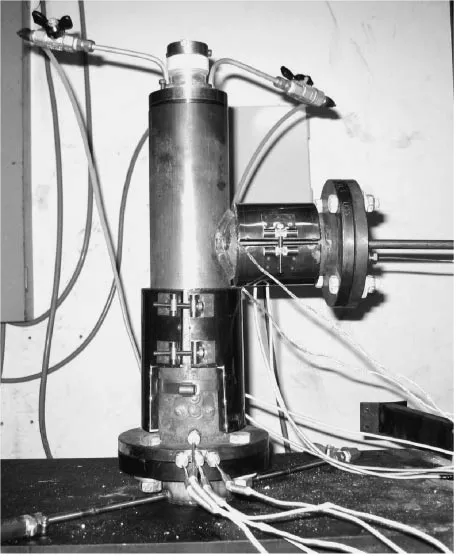
3.2 Experimental setups and procedures ofh measure-ment
To meet the requirements of the Inverse Method, a one-dimensional heat transfer from the casting to the mold needs to be devised. Figure 2 is a schematic illustration of the unidirectional heat transfer measure system used in this study and Fig. 3 is its photograph. The main part of this system is a SKD-61 steel cylindrical container. Argon was introduced into the cylindrical container from the top to protect the Mg alloy from oxidizing during the heating process. A pre-produced AZ91D Mg alloy ingot (with non-dendritic structure) was put into the cylinder container. The mold material SKD-61 was on the bottom of the cylindrical container and in contact with the AZ91D ingot, on top of a copper plate water cooling system. The cylindrical container was covered with heat insulating material and a heating wire heater. Five K-type thermocouples were inserted into this system. Thermocouples #1, #2, #4, and #5 was inserted into the casting and #3 into the SKD-61. The data read from thermocouples #1, #2, and #3 was as input for the Inverse Program to calculate the heat transfer coefficient between the casting and the mold. Thermocouple #4 and #5 were used to ensure that the system was a one-dimensional heat transfer system.
In order to understand thehvariations with different initial solid fractions, the following procedural steps were carried out:
(1) The AZ91D Mg alloy with non-dendritic microstruc-ture was put into the cylindrical container.
(2) The heater heated the casting to the desired temperature (the temperature was used to control the initial solid fraction of the casting).
(3) The heaters were turned off.
(4) The cooling system was activated and the temperatures were recorded (at a scanning rate of 5 Hz) until the casting had solidified to a certain degree.
(5) The temperature readings were used as input for the Inverse Program to calculate the values ofh.
Ar in
heating plate Increasing Ar
flow rate
heating plate
steel wire
thermocouples
pull up the wire
turn on the heater
turn off the heater Ar out
Heating up procedures Cooling down procedures
Fig. 1 Schematic illustration of the experimental measurement for CA-CCA method.
Heater
Stainless Container Pressure Piston
Ar
SKD-61
Water cooling AZ91D
Thermocouples Copper plate
Heater
400 mm
20mm
Inner diameter: 76.8 mm Outer diameter: 95.4 mm
Sample size: 76.2 mm in diameter, 100 mm in height
#1
#2
#3 #4 #5
8
18
16
16 16
Fig. 2 Schematic illustration of the unidirectional heat transfer system.
[image:3.595.55.285.73.208.2] [image:3.595.312.541.76.285.2] [image:3.595.313.541.334.614.2]4. Results and Discussions
4.1 Measurement of the fs-T relationship of AZ91D alloy by CA-CCA method
The cooling curve of AZ91D alloy during solidification is shown in Fig. 4. It shows that the temperature at which the AZ91D alloy starts to change state from liquid to solid is nearly 583C and around 409C the casting is completely solidified. Figure 5 shows thedT=dtcurve and null curve for AZ91D alloy. The thick line is the NLSF optimized null curve obtained from CA-CCA theory.11)By substituting the
cooling rate curve and null curve data into the CA-CCA program, thefs-Trelationship of AZ91D alloy was obtained, as shown in Fig. 6. It can be easily obtained from the figure that the alloy start to solidify (solid phase start to form) is located at nearly 583C, the temperature that the alloy
completely solidified is located at nearly 409C, and
temper-atures in the mushy zone with solid contents of 30, 40 and 50% are located at nearly 569.7, 563.7 and 556.5C,
res-pectively. The data is useful for the setting of initial temperature for h measurements under different semisolid states. And thefs-Tcurve was put into the inverse program as the database for the latent heat release module. In this study, we treated that the rate of latent heat release was proportional
to the increasing rate of solid fraction as described in section 2.3.
4.2 Data from temperature measurements for calculat-ingh
Experiments were conducted for the casting of AZ91D Mg alloy under molten and semisolid states employing the experimental setup and procedures described in the previous section. The density of AZ91D Mg alloy and SKD-61 were treated as constant values of 1810 and 7760 kg/m3. The thermal conductivity and the specific heat of the casting and the mold used in this study are listed in Figs. 7 and 8.
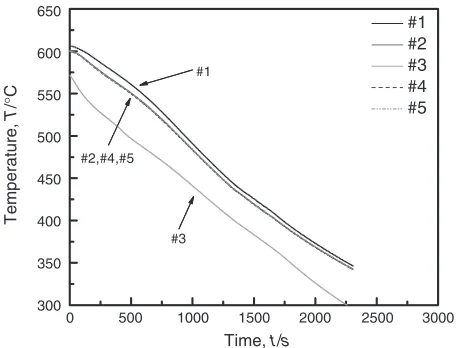
Figure 9 shows a temperature-time curve from an experi-ment when the casting was heated up to a temperature above liquidus and then cooled down. It should be noted that thermocouples #2, #4 and #5 were aligned in a straight line parallel to the casting/mold interface. This temperature data was used to check if the unidirectional heat transfer condition was maintained throughout the experiment. It can be seen from Fig. 9 that the temperature variation of the thermocou-ple #4 coincides with that of the thermocouthermocou-ples #2 and #5. This was also the case in the other experiments. It is therefore 650
600
550
500
450
400
350
300
250
Time, t/s
Temperature,
T
/
oC
0 200 400 600 800 1000 1200 1400 1600 1800 2000
start of solidification
end of solidification
Fig. 4 Cooling curve of AZ91D alloy.
end of
dT/dt Null Curve
0.0
-0.2
-0.4
-0.6
dT/dt
0 250 500 750 1000 1250 1500 1750 2000
Time, t/s solidification
start of
solidification
Fig. 5 dT=dtcurve and null curve for AZ91D alloy.
fs=50%, 556.5oC
fs=40%, 563.7oC
fs=30%, 569.7oC
1.0
0.8
0.6
0.4
0.2
0.0
600 580 560 540 520 500 480 460 440 420 400
Solid fraction
Temperature, T/oC
end of solidification: 409.9oC
start of solidification: 583.2oC
Fig. 6 Calculatedfs-Tcurve for AZ91D Alloy.
0
500
1000
1500
2000
20
30
40
50
60
70
80
90
100
110
Temperature, T/°C
Thermal Conductivity,
k
/
W
·
m
-1
·
K
-1
SKD61
AZ91D
[image:4.595.313.539.73.245.2] [image:4.595.55.283.175.445.2] [image:4.595.318.540.293.466.2]clear that the design of the apparatus for this study fulfilled the requirement of unidirectional solidification heat transfer. Experiments were also conducted for the semisolid casting of AZ91D Mg alloys with two sets of initial solid fractions, which include solid contents of 30% solid and 50%, and SKD-61 mold material. A pre-produced AZ91D Mg alloy ingot with non-dendritic structure was used as the raw materials in order to express the real semisolid casting process. The thermal histories with five thermocouples as shown in Figs. 10, and 11 and the cooling curves show similar tendency under different initial solid fraction setups. The temperature profiles of semisolid casting show unappar-ent phase transformation feature in the mushy zone as compared with casting with molten alloy.
4.3 Interfacial heat transfer coefficients for casting with molten alloy
The Inverse program was then used to calculate the h
values from the temperature data. From that calculation, the relationship between h values and time; the so called h-t
curves could be derived. However, it should be noted that the
hdata can be useful for solidification modeling only when the
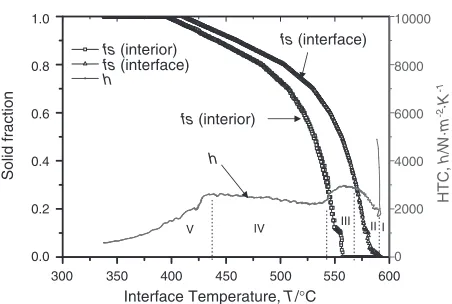
relation of its value with the casting temperature near the interface; the so calledh-Tcurve, is known. To comply with this need, theh-tcurves were then transformed toh-Tcurves with the temperature-time relations already calculated during the inverse program analyses. The relationships between the interfacial heat transfer coefficient and temperature at the casting surface as well as the fittedh-Tcurve was obtained as shown in Fig. 12. And the relationships betweenh, temper-ature and the related solid fraction at the interface and inside of casting for the casting of AZ91D Mg alloy in fully melted condition is shown in Fig. 13.
From the figure, it can be found that theh-T curve can be divided into five stages. As the cooling water turns on, a thin solidified layer and a gap suddenly are appeared and therefore result in a sharp decrease ofhto a value of 1681 W m2K1 at casting surface temperature around 588C in the first stage.
And then, it takes a little while for the inside molten metal to bring pressure to the solidified thin layer to get in good contact with the mold wall again. During this period, theh
value starts from 1681 W m2K1at casting surface temper-ature around 588C and then increases to a peak value of around 2931 W m2K1 at a casting surface temperature around 562C. Comparing with the solid fraction conditions
0
500
1000
1500
2000
0.4
0.6
0.8
1.0
1.2
1.4
AZ91D
SKD61
Temperature, T/°C
Specific Heat,
Spe/kJ·kg
-1·K
-1
Fig. 8 Relationship between specific heat and temperature for AZ91D and SKD61 alloy.12)
#1 #2 #3 #4 #5
#1
#2,#4,#5
#3
0 500 1000 1500 2000 2500 3000 650
600
550
500
450
400
350
300
Time, t/s
Temperature,
T
/
°
C
Fig. 9 Temperature-time curves from the various thermocouples (cast with molten alloy).
#1 #2 #3 #4 #5
#1
#2,#4,#5
#3
0 500 1000 1500 2000 2500 3000 3500 600
550
500
450
400
350
300
250
Time, t/s
Temperature,
T
/
°
[image:5.595.58.281.68.246.2]C
Fig. 10 Temperature-time curves from the various thermocouples (initial solid content of 30%).
#1 #2 #3 #4 #5
#1
#3
0 500 1000 1500 2000 2500 3000 3500 600
550
500
450
400
350
300
250
#2,#4,#5
Time, t/s
Temperature,
T
/
°
C
[image:5.595.313.538.74.238.2] [image:5.595.312.539.291.458.2] [image:5.595.55.283.299.473.2]of casting at the interface, it can be observed thatfsincreases quickly at this stage until a solid fraction of 30% and the inner part of casting is still in liquid state.
While the value of h reaches its peak, massive heat is extracted from the casting to the mold. During the third stage, solid skin starts to form and air gap is gradually generated between the casting metal and the mold. As the gap is formed, it presents a higher resistance to the heat transfer from the casting to the mold and the value ofhis seen to drop to 2216 W m2K1 rather quickly until the casting surface temperature reaches around 533C. It can be seen from the
figure that the solid fraction at the casting surface still increases quickly to a value of 60% but slows down its tendency and the inner part of casting starts to solidify.
Following the gap formation, the hydrostatic pressure of the un-melted metal inside casting keeps pushing the solid shell towards the mold. As a consequence, the value of h
increases slightly between 2216–2577 W m2K1 at a cast-ing surface temperature cools from 533 to 430C. This
constitutes the fourth stage. In this stage, the increasing of solid fraction at the casting surface slows down and the solidification speed of casting inside increases quickly. The difference of solid fraction between casting surface and inside is getting smaller. It is also the evidence that heat coming from casting inside offers steady heat source and
therefore inhibits the solidification speed at interface in this stage.
As more molten metal solidifies, solid shell grows with gradually precipitated Mg17Al12phase and becomes stronger enough to resist the hydrostatic pressure coming from the un-melted metal. At this stage; the last stage, shrinkage of casting metal due to solidification and cooling gradually enlarge the gap. Naturally, the value ofhdecreases accord-ingly.
Here, the h-T curve characteristic is similar to that in previous researches on A356 aluminum alloy8)and Inconel-600, SKD-61, SKT-4 alloy.13) During the solidification process, all alloys present similar tendency of h-T curves. It means the mechanism of interface situation between the casting and the mold is similar.
4.4 Interfacial heat transfer coefficients for casting under semisolid state
According to the results of CA-CCA experiment, the ingot with globular grain microstructure was heated up to 569C
in order to produce semisolid casting with 30% solid fraction at the interface. A shown in Fig. 14, h variations can be divided into three stages. In the beginning,hdrops sharply as the mold cools down it temperature. And then the decreasing tendency slows down and reaches a value around 1400 W m2K1. After the temperature of casting surface decreases to 409C, thehstarts to descend smoothly.
From the figure, it also can be seen that the smoother curve is obtained compared with Fig. 12 and it means better numerical stability for calculating ofh-T curve. It would be the reason that the network of solidified part between the globular grains at the interface or inside the casting can be a restriction to prohibit the movement of un-solidified phase and also the interface. Especially as the casting surface becomes stronger after contacting with the cooled mold in the beginning stage. It also can be explained that the variation of gap formation during semi-solid casting is more uniform than casting with fully melted alloy.
According to the result of CA-CCA experiment, the ingot with globular grain microstructure was heated up to 556C
in order to produce semi-solid casting with 50% solid fraction at the interface. Theh-T curve showed in Fig. 15 is similar with that casting with 30% solid fraction. At the beginning,
550 600
450 500
350
300 400
10000
8000
6000
4000
2000
0 h
smoothedh
Temperature, T/°C
HTC,
h
/
W·m
-2·K
[image:6.595.313.541.73.221.2]-1
Fig. 12 h-Tcurve of casting with molten AZ91D Alloy.
h
I II III IV
V
300 350 400 450 500 550 600 1.0
0.8
0.6
0.4
0.2
0.0
10000
8000
6000
4000
2000
0
h
Solid fraction
Interface Temperature, T/°C
HTC,
h
/
W·m
-2·K
-1
fs (interior)
fs (interface)
fs (interface)
fs (interior)
Fig. 13 Relationship betweenh-Tcurve andfs-Tcurves for casting with molten AZ91D Alloy.
300 350 400 450 500 550 600 1.0
0.8
0.6
0.4
0.2
0.0
10000
8000
6000
4000
2000
0
Solid fraction
Interface Temperature, T/°C
HTC,
h
/
W·m
-2·K
-1
I II
III
h
fs (interior)
fs (interface)
fs(interior)
fs(interface)
[image:6.595.59.283.74.238.2]h
[image:6.595.56.282.277.429.2]hdrops quickly as the mold was cooled down it temperature. And then the decreasing tendency slows down and reaches a value nearly 1400 W m2K1. Finally, h starts to decrease accordingly in the last stage.
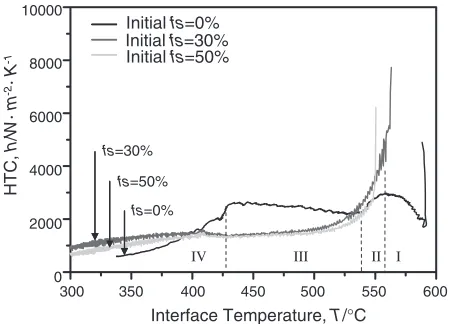
4.5 Comparison of the h-T curves for casting with molten alloy and semisolid slurry
To discuss the differences inhamong casting with various initial solid fractions, all theh-T curves are plotted together in Fig. 16. It can be easily distinguished that casting with fully melted alloy has different trend than others that casting under initial semisolid states. From the figure, the variation of theh-T curves can be divided into four regions.
In region I, only casting with fully melted metal does undergo the stage. As mentioned before, due to the reason that thin solidified layer and a gap appeared suddenly in the beginning as the cooling system was turned on and it took time for the un-solidified molten alloy inside to push the partially solidified casting surface to get in contact with the mold wall. In region II, allhdecrease as the temperature of casting surface decreases. Theh-Tcurve of semisolid casting with lower initial solid fraction shows higher h values than the higher solid fraction one at the same temperature. It can easily to be explained that cast with higher solid fraction has stronger solid shell network than the lower one. Therefore, it
is not easy to push the solidified shell at the surface outward towards the mold. However, casting with molten alloy shows lowerhvalues than casting with semisolid alloy. It is due to the fact that a gap is already formed in the region I. In this stage, the solid fraction at the interface increases quickly and gap grows up quickly.
The decreasing of h slowed down and became stable or even increased slightly at a casting surface temperature range around 533 to 430C. The h data for cast with fully
melted one had higher value than cast under semisolid state. This indicates that casting with semisolid state has a solid network microstructure in the beginning then can solidify uniformly. This solid network inside the casting and at the casting surface is strong enough to keep a stable condition at the interface and not to further reduce the air gap. It is also interesting that both h-T curves that cast under semisolid states decrease to a certain value (1400 W m2K1) at a casting surface temperature around 430C.
Finally, as the casting kept solidifying, decreasing ten-dency of h values for casting with fully melted one was quicker than the others. It was due to the reason that obvious directional solidification procedures from the casting/wall interface toward inside kept steady shrinkage and therefore enlarged the gap. But for casting with semisolid state ones, due to the lower casting temperature and the network of solidified phase will let the casting solidify uniformly and cause fewer shrink percentage than casting with fully melted alloy. After 430C the h-T curves for the semisolid ones
started to separate again and it might due to the reason that higher solid fraction means less volumetric shrink during solidification. The air gap was smaller hence thehvalue was larger.
5. Conclusion
In this study, a one-dimensional heat transfer system from the casting to the mold needs has been designed and fabricated for the permanent mold casting of AZ91D Mg alloy in molten and semisolid states. Three different initial solid fractions of 0, 30, and 50% for casting were conducted. Temperature measurements were then analyzed with the Inverse Method to estimate for the interfacial HTC,h. Then the variation of h with respect casting surface temperature (h-T curve) was obtained. The characteristics of the h-T
curves and the effects of initial solid fraction on the variation ofhcan be summarized as follows.
(1) Theh-T curve obtained from casting with fully melted alloy had different values and trend than the others that casting under semisolid states. It is critical for any solidification model of permanent mold casting as well as semisolid casting for obtaining a reliable prediction of the thermal profile inside the solidifying casting and its freezing time.
(2) Theh-T curve obtained from casting with fully melted alloy could be distinguished in five stages. During each stage, the casting/mold interfacial conditions varied, which in turn caused thehvalues to vary. Theh-Tcurve characteristic was similar to that in previous works on A356 aluminum alloy and Inconel-600, SKD-61, SKT-4 alloy.13)
300 350 400 450 500 550 600 1.0
0.8
0.6
0.4
0.2
0.0
10000
8000
6000
4000
2000
0
h h
Solid fraction
Interface Temperature, T/°C
HTC,
h
/
W·m
-2·K
-1
fs (interior)
fs (interface)
fs (interface)
[image:7.595.56.285.73.223.2]fs (interior)
Fig. 15 Relationship betweenh-Tcurve andfs-Tcurves for casting with semi-solid AZ91D slurry (initial solid content of 50%).
III
IV II I
10000
8000
6000
4000
2000
0
300 350 400 450 500 550 600
HTC,
h
/
W
·
m
-2·
K
-1
Interface Temperature, T/°C Initial fs=50%
Initial fs=30% Initial fs=0%
fs=30%
fs=50%
fs=0%
[image:7.595.58.283.276.438.2](3) Theh-T curves obtained from casting with semisolid alloy could only be distinguished into there stages. It lacked of the first and the second stage ofh-Tvariation obtained from casting with fully melted alloy. It is because that their intrinsic solidified network inside the casting and at the casting surface in the beginning and during solidification will let the casting solidify uniformly and will prevent the hydraulic pressure coming from the un-solidified phase.
(4) Semisolid casting with 30% solid fraction shows higher
hin the beginning stage. And then the values converge toward similar value in the second stage until 430C.
After the temperature, theh-Tcurve started to separate again and it might due to the reason that higher solid fraction means less volumetric shrink during solid-ification.
Acknowledgement
The authors greatly appreciate the valuable comments of Dr. C. K. Jen, at Industrial Materials Institute, National Research Council of Canada. The financial support from NRC-CANADA and NSC-TAIWAN (NSC 92-2216-E-006-023) and the Natural Science and Engineering Research Council of Canada is also acknowledged.
REFERENCES
1) J. Issac, G. P. Reddy and G. K. Sharma: AFS Trans.93(1985) 29–34. 2) Y. Nishida, W. Droste and S. Engler: Metall. Trans. B17B(1986) 833–
844.
3) J. C. Hwang, H. T. Chuang, S. H. Jong and W. S. Hwang: AFS Trans. 102(1994) 877–883.
4) J. V. Beck and B. Blackwell:Handbook of Numerical Heat Transfer (John Wiley & Sons Inc. 1988) 787–834.
5) H. K. Kim and S. I. Oh: J. Mater. Process. Technol.112(2001) 157– 165.
6) J. C. Chen, J. H. Kuo and W. S. Hwang: Int. J. Cast Met. Res.15(2002) 93–101.
7) R. P. Tavares, M. Issac, F. G. Hamel and R. I. L. Guthrie: Metall. Mater. Trans. B32B(2001) 55–67.
8) J. H. Kuo, F. L. Hsu, W. S. Hwang and S. J. Chen: AFS Trans.109 (2001) 469–485.
9) S. Argyropoulos, B. Closset, J. E. Gruzleski and H. Oger: AFS Trans. 91(1983) 351–358.
10) D. M. Stefanescu, G. Upadhya and D. Bandyopadhyay: Metall. Trans. A21A(1990) 997–1005.
11) Y. L. Tsai and W. S. Hwang: Mater. Trans., JIM45(2004) 1949–1957. 12) J. L. Yeh: Private communication, MIRDC, Kaohsiung, Taiwan
(2004).