Dynamic Mechanical Response and Microstructural Evolution
of High Strength Aluminum–Scandium (Al–Sc) Alloy
Woei-Shyan Lee
*1and Tao-Hsing Chen
*2Department of Mechanical Engineering, National Cheng Kung University, Tainan 701, Taiwan, R. O. China
The dynamic mechanical properties of high strength aluminum–scandium (Al–Sc) alloy are investigated using a compression split Hopkinson bar. Dynamic impact testing is carried out at nominal strain rates (abbreviated to strain rate hereafter) ranging from1:2103to
5:8103s1at room temperature. The effects of strain rate on the mechanical properties, microstructural evolution and fracture characteristics
are investigated and the relationship between the mechanical properties of the alloy and its microstructure is explored. The measured strain– stress curves reveal that the dynamic mechanical behaviour of Al–Sc alloy is highly dependent on the strain rate. The flow stress, work hardening rate and strain rate sensitivity increase with increasing strain rate, but the fracture strain and activation volume decrease. The Zerilli–Armstrong fcc constitutive law is used to model the shear flow response of the Al–Sc alloy. A good agreement is found between the predicted and measured shear flow responses. The Al–Sc alloy specimens fracture as a result of shear band formation and crack propagation within the shear band. SEM observations indicate that the fracture features are dominated by a transgranular dimple-like structure. The density and depth of the dimples decrease with increasing strain rate. TEM microstructural observations reveal that the presence of Al3Sc precipitated particles in the matrix and
at the grain boundaries prevents dislocation motion and leads to a significant strengthening effect. An analysis of the dislocation substructure indicates that a higher strain rate increases the dislocation density, thereby reducing the size of the dislocation cells. The variations of the dislocation cell structure reflect different degrees of strain rate sensitivity and activation volume, and correlate well with the impact flow stress– strain response.
(Received October 7, 2005; Accepted December 16, 2005; Published February 15, 2006)
Keywords: aluminum–scandium alloy, strain rate effect, strain rate sensitivity, activation volume, localized shearing, dislocation
1. Introduction
Aluminum alloys have long been used in the fabrication of aircraft, automotive and marine components due to their high stiffness/density ratios (E=), superior corrosion resistance and high ductility. In these applications, the joints between large components fabricated from traditional aluminum alloys are generally welded, while the other structural components are fabricated by metal working processes such as forging, forming, rolling or extrusion. However, when welding traditional aluminum alloys, the heat generated during the welding process induces cracking in the fusion zone and at the boundary between the fusion zone and the heat affected zone. These cracks reduce the strength and corrosion resistance properties of the aluminum alloy con-siderably. Moreover, metal working processes also change the strength of traditional aluminum alloys since these processes induce changes in the alloy’s microstructure. Some researchers1,2)have reported that the addition of scandium to aluminum alloys increases their mechanical strength. Since scandium forms fine Al3Sc precipitates and is coherent with the aluminum matrix, its addition leads to a significant reduction in hot cracking during welding and inhibits grain growth.3) Furthermore, the Al
3Sc precipitates have a stabi-lizing effect on the microstructure and impede the movement of dislocations. Therefore, the strength of the Al–Sc alloy is improved by strain hardening and by grain boundary strengthening.
Some of the earliest investigations into Al–Sc alloy (designated Al 1570) were carried out in the former USSR.4,5) Subsequent studies of Al–Sc alloys investigated their
solid-ification behaviour,6,7) recrystallization behaviour,8,9) weld-ability,10–12) tensile properties,13–16) and fundamental me-chanical properties17–21) etc. Al–Sc alloys are used to fabricate numerous structural components for applications in the aircraft, automobile, transportation, sporting goods, and recreation fields. Due to the nature of these applications, these components are frequently subjected to dynamic impact loading during the course of their service lives. Moreover during their manufacture, Al–Sc alloys tend to undergo high strain rate deformations. However, previous studies have focused almost exclusively on the fundamental mechanical properties of Al–Sc alloys, and have tended to ignore both their response at high strain rate loading conditions and their fracture mechanisms.
Therefore, the present study uses a compression split Hopkinson bar to investigate the dynamic properties of Al– Sc alloy deformed at various strain rates at room temperature. The influence of strain rate and strain on the dynamic mechanical properties of the alloy and on its microstructural evolution are identified and discussed. A constitutive model is used to describe the high strain rate deformation behaviour of the Al–Sc alloy. Finally, based on observations of the microstructural evolution and an analysis of the fracture features, the relationship between the mechanical response and the microstructure of the Al–Sc alloy is determined and discussed.
2. Material and Experimental Procedure
The Al–Sc alloy used in the present study was supplied by Taiwan Hodaka Technology Co., Ltd. The mass% chemical composition of the Al–Sc alloy (as measured by a glow discharge spectrometer (GDS)) is presented in Table 1. The alloy was melted in a pit type electrical resistance furnace
*1Corresponding author, E-mail: wslee@mail.ncku.edu.tw
and the molten metal (at a temperature of 700C) was then poured into a heated permanent metal mold measuring
55mm170mm (diameterlength). The cast ingot was homogenized at 480C for 16 h and then put into a preheated extrusion mold. After holding at 500C for 2 h, the heated ingot was extruded using an indirect extrusion machine to
form an extruded bar with dimensions 15mm650mm
(diameterlength). To ensure an optimum precipitation and distribution of Al3Sc particles in the matrix, the extruded bar was solution heat-treated in an air furnace at 465C for 1 h, water quenched at room temperature, and then aged naturally for 3 days. Finally, the bar was subjected to a two-step artificial aging treatment at 105C for 7 h and 150C for 10 h, respectively. Cylindrical specimens with a height of70:1
mm and a diameter of 7.2 mm were machined from the heat-treated extruded bars. Each specimen was finished in a centre-grinding process to a final diameter of 70:1mm. The top and bottom end faces of the specimens were surface ground using a grinding wheel until a parallel divergence of less than 0.01 mm/mm was achieved.
The compression deformation experiments were conduct-ed at room temperature at both quasi-static and dynamic strain rates. The quasi-static mechanical properties of the Al– Sc alloy were tested using an MTS 810 (MTS Systems, USA) material testing system at a nominal strain rate of 103s1. The load-displacement curves obtained from the compres-sion tests were converted into true stress–true strain curves, using the following equations for the true stresst and true
strain"tcalculations:
t¼
4Fh
D2 0h
2 0
ð1Þ
"t¼ Z h
h0 dh
h ¼ln h
h0
; ð2Þ
whereF is the compressive load,D0 the initial diameter of the specimen,h0andhthe initial and the final height of the specimen, respectively. The dynamic impact tests were performed at nominal strain rates of 1:2103, 2:2103,
3:2103,4:7103 and5:8103s1 using the compres-sion split Hopkinson bar shown in Fig. 1. The stress, strain and strain rate were analyzed in digital form using
one-dimensional stress wave theory.22) Based on the recorded
incident, reflected and transmitted strain pulses,i.e."i,"r, and
"t, respectively, the engineering strain ", strain rate ""_ and
engineering stressin the specimen were obtained from the following equations:
"¼ ð2C0=L0Þ
Z
"rdt ð3Þ
_
"
"¼2C0"r=L0 ð4Þ
¼EðA=A0Þ"t; ð5Þ
whereC0 is the longitudinal wave velocity in the compres-sion split Hopkinson bar,L0the effective gage length of the specimen,Ethe Young’s modulus of the split bar, andAand
A0the cross-sectional areas of the split bar and the specimen, respectively. With the obtained engineering stress strain data, the true stress (T) and true strain ("T) of the deformed
specimen were calculated according to the following ex-pressions:
T ¼ð1þ"Þ ð6Þ
"T ¼lnð1þ"Þ: ð7Þ
Details of the present test configuration and measurement technique are presented in a previous study by the current authors.23) The dynamic stress–strain curves were found to
exhibit oscillations caused by the dispersion of the elastic wave in the pressure bar during the wave-propagation process. Therefore, a discrete Fourier transformation process was performed using a fast Fourier transform (FET) algorithm to correct the stress–strain curves. Figure 2 compares the original and corrected stress strain curves for a specimen deformed at a strain rate of3:2103s1.
[image:2.595.319.538.73.268.2]After dynamic testing, the microstructure of the deformed specimens was examined using a JEOL TEM-3010 trans-mission electron microscope (TEM) operating at 200 kV. The specimens for TEM observation were prepared by cutting foils of 350mm thickness from the deformed specimens. Disks of 3 mm diameter were then punched from each foil, Table 1 Chemical composition of Al–Sc alloy.
Elements Zn Mg Cu Sc Zr Al
wt.% 8.9 1.7 2.1 0.13 0.15 balance
PC
Filter
Incident Pressure bar Transmitter Pressure Bar
Specimen Strain Gage 1
Oscilloscope Strike Bar
Sensor
Signal Amplifier
Strain Gage 2 Dashpot
Pressure Control System
Output data
t
t t
ε. ε σ σ
ε
Fig. 1 Schematic diagram of compression split Hopkinson bar apparatus. 0 0.1True Strain,0.2 0.3 200
400 600 800 1000
T
rue Stress,
/MP
a
T
σ
T ε
Fig. 2 Stress–strain curve for Al–Sc alloy deformed at strain rate of 3:2103s1 at room temperature, with and without wave dispersion
[image:2.595.46.291.79.244.2]mechanically ground to a thickness of 200mm, and then twin-jet polished with a solution of 30% nitric acid and 70% methanol at 15 V and30C. The fracture specimens were prepared using a standard metallographic method and examined using a Philip’s XL-40FEG scanning electron microscope operated at 15 kV to identify the nature of the fracture features.
3. Results and Discussion
3.1 True stress–strain curve
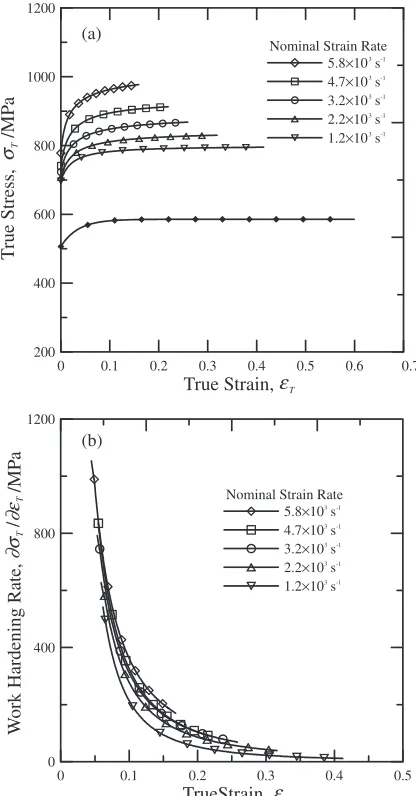
Figure 3(a) shows the true stress–strain curves of Al–Sc alloy deformed at room temperature at five different strain rates. For each strain rate, the flow stress increases gradually with increasing strain. Furthermore, for a constant strain, the flow stress increases rapidly with increasing strain rate. The tendency of the stress–strain curves indicates that the work hardening effect is dependent on the strain rate. A compar-ison of the flow stress under quasi-static testing and dynamic impact testing, respectively, shows that for a fixed strain of 0.4, the flow stress increases by approximately 200 MPa as the strain rate during deformation is increased from103to
1:2103s1. This provides evidence that the flow behaviour of Al–Sc alloy is highly strain rate sensitive. A change in the strain rate changes not only the flow stress, but also the fracture strain. As shown in Fig. 3(a), the specimens did not fracture during deformation at strain rates lower than
1:2103s1, even when deformed to a large true strain of 0.4. This indicates that the Al–Sc alloy exhibit a high deformability as it is deformed in the intermediate strain rate range and under quasi-static loading conditions.
The strain rate dependent behaviour observed in Fig. 3(a) can be described by the general empirical work hardening
law proposed by Ludwik.24) This law has the form,
T ¼AþB"Tn, where A is the yield strength, B is the
[image:3.595.323.531.73.471.2]material constant, and n is the work hardening coefficient. Table 2 summarizes the impact properties of the Al–Sc alloy at different strain rates. As expected, the yield strength, material constant and work hardening coefficient all increase with increasing strain rate. In order to explore the influence of strain and strain rate on the work hardening behaviour of the Al–Sc alloy, this study calculated the work hardening rate at different strain rates (d=d") from the slopes of the stress– strain curves shown in Fig. 3(a). Figure 3(b) shows the variation of the work hardening rate with the strain as a function of the strain rate. For a given strain rate, the work hardening rate decreases rapidly with increasing strain. However, at a fixed strain, the work hardening rate increases with increasing strain rate. The work hardening rate reflects
the various microstructural evolutions which occur during the plastic deformation of the Al–Sc specimens. The tendency of the true stress–true strain relationship is determined by the outcome of the competitive process between the rate of work hardening (governed by the generation and accumulation of dislocations) and the rate of thermal softening (governed by the deformation-induced heat). Meanwhile, the presence of Al3Sc precipitates in the matrix and the interaction between these Al3Sc precipitates and the dislocations also influence the rate of work hardening as the strain rate increases.
0 0.1 0.2 0.3 0.4 0.5 0.6 0.7
True Strain,
200 400 600 800 1000 1200
T
rue Stress,
/MP
a
Nominal Strain Rate
5.8×10³
s-1
4.7×10³
s-1
3.2×10³
s-1
2.2×10³
s-1
1.2×10³
s-1
T
0 0.1 0.2 0.3 0.4 0.5
TrueStrain,
0 400 800 1200
W
ork Hardening
Rate,
/MP
a
/
Nominal Strain Rate
5.8×10³
s-1
4.7×10³
s-1
3.2×10³
s-1
2.2×10³
s-1
1.2×10³
s-1
T ε
σT
ε
∂σ
∂ε
TT
(a)
(b)
[image:3.595.51.545.689.785.2]Fig. 3 (a) True stress–strain curves of Al–Sc alloy deformed at room temperature and different strain rates; (b) Variation of work hardening rate of Al–Sc alloy as function of strain and strain rate.
Table 2 Mechanical properties of Al–Sc alloy impacted at different high strain rates.
Nominal strain rate
_ "
"(s1)
Yield stress (MPa)
Material constant (MPa)
Work hardening coefficient,n
Fracture strain
Fracture stress (MPa)
1:2103 706 111.3 0.19 — —
2:2103 715 162.2 0.25 0.32 829.4
3:2103 724 217.5 0.27 0.26 867.2
4:7103 745 270.2 0.28 0.22 912
3.2 Strain rate sensitivity and activation volume
To further investigate the effects of strain rate on the Al–Sc alloy response, Fig. 4(a) plots the flow stress as a function of the logarithmic strain rate at true strains of 0.05, 0.1 and 0.15. It can be seen that the flow stress increases dramatically with increasing strain rate and strain in the high strain rate regime. The data plotted in Fig. 3(a) for the quasi-static and high strain rates can be used to calculate the strain rate sensitivity, ,i.e.¼ ð@=@ln _""Þ, as shown in Table 3. It can be seen that for a constant strain, the strain rate sensitivity increases with increasing strain rate. Furthermore, at a specific strain rate, an increased strain enhances the strain rate sensitivity slightly. To investigate the nature of the strain rate sensitivity in terms of the loading conditions and to track the corresponding microstructural evolution during deformation, it is necessary to establish a relationship between the strain rate sensitivity and the work hardening stress (–y), wherey is the yield
strength. Figure 4(b) presents the strain rate sensitivity of the Al–Sc alloy as a function of (–y). It is observed that the
strain rate sensitivity increases rapidly with the work
hard-ening stress. The large work hardhard-ening stress corresponding to the characteristic rapid increase in strain rate sensitivity indicates that the Al–Sc alloy is a rate sensitive material, particularly in the high strain rate region. Since the flow stress of Al–Sc alloy is dependent on the strain rate, the variation of the flow stress with strain rate is dominated by the specific rate-controlling deformation mechanism. If the strain rate is controlled by a thermally activated process with a free energy of activationG, the relationship between the flow stress and the strain rate can be described by the Arrhenius type equation,i.e.
_
"
"¼""_oexp½G=KbT ð8Þ
where""_is the strain rate during deformation,""_o is the
pre-exponential term,Gis the activation free energy,Kbis the
Boltzmann constant, andT is the absolute temperature. The activation volume,, can be expressed as:
@ln _"" @
T
¼ð@G=@Þ
KbT
¼
KbT
ð9Þ
The activation volume index provides an indication of the evolution of dislocations during a plastic deformation process. Using the relationship presented in eq. (9), the activation volume, normalized with respect tob3(wherebis the Burger vector of Al–Sc alloy, i.e. 28.9 nm), can be presented as a function of the work hardening stress (–y),
as shown in Fig. 4(b). The results show that the activation volume decreases with increasing work hardening stress. Table 3 gives the value of the activation volume for the quasi-static and dynamic strain rates considered in Fig. 3(a). The results suggest that the thermal activation effect, which assists dislocations to overcome obstacles during plastic Nominal Strain Rate, /s-1
700 800 900 1000 T rue Stress, σ /MP a εT T = 0.15 εT =0.1
εT = 0.05
103
104
8×10²
.
ε
160 200 240 280 320 360 400 440 480 520
/MPa 12 18 24 30 Strain Rate Sensiti vity , β /MP a 4 6 8 10 12 Acti v ation V olume, β ν* /b3
y σ − σ
ν * / b 3 (a) (b)
[image:4.595.59.277.73.479.2]Fig. 4 (a) Influence of strain rate on flow stress at different true strains of 0.05, 0.1 and 0.15; (b) Strain rate sensitivity and activation volume of Al– Sc alloy as function of work hardening stress (–y).
Table 3 Values of strain rate sensitivity and activation volume calculated on basis of quasi-static strain rate (103s1) and dynamic strain rate.
True strain "t Static flow stress s(MPa) Dynamic flow stress d(MPa) Strain rate sensitivity (MPa) Activation volume
=b3
For""_s¼103s1and""_d¼1:2103s1
0.05 566.6 769.2 14.3 8.9
0.1 581.1 782.3 14.4 8.8
0.15 584.6 787.9 14.5 8.7
For""_s¼103s1and""_d¼2:2103s1
0.05 566.6 793.3 15.5 8.2
0.1 581.1 811.0 15.7 8.1
0.15 584.61 819.1 16.1 7.9
For""_s¼103s1and""_d¼3:2103s1
0.05 566.6 827.1 17.3 7.3
0.1 581.1 847.8 17.8 7.2
0.15 584.6 857.6 18.2 7.0
For""_s¼103s1and""_d¼4:7103s1
0.05 566.6 871.4 19.8 6.4
0.1 581.1 894.5 20.4 6.2
0.15 584.6 905.0 20.9 6.1
For""_s¼103s1and""_d¼5:8103s1
0.05 566.6 936.8 23.8 5.4
0.1 581.1 962.9 24.5 5.2
[image:4.595.303.549.95.378.2]deformation, reduces as the strain and strain rate are increased. The reduction in the activation volume with increasing strain rate also indicates that the amount of thermal vibration occurring at higher strain rates is less than which occurs in low strain rate testing. At the microscopic level, the variations of the strain rate sensitivity and activation volume reflect different microstructural evolu-tions, as discussed later in Section 3.4.
3.3 Deformation constitutive equation
Constitutive equations take account of the effects of strain, strain rate, temperature and microstructure to predict the deformation behaviour of engineering structural materials under dynamic loading. The use of such equations is becoming increasingly common as a means of enhancing the design of structural components. Many alternative constitutive equations have been developed for different materials.25–27) We apply the Zerilli–Armstrong fcc
constit-utive equation28,29) to predict the dynamic deformation
behaviour of the current Al–Sc alloy. This constitutive equation has the following form:
T ¼0þc2"nT½expðc3Tþc4Tln _""Þ ð10Þ
whereTis the true stress,"Tis the true strain,""_is the strain
rate,Tis the temperature, and0,c2,c3,c4andnare material constants. The original model for fcc materials specified
n¼0:5. However, in this study, n is specified as a free constant. For dynamic loading, the temperature rise gener-ated by plastic deformation should be taken into account when predicting the material’s response. Therefore, the temperature term (T) in eq. (10) is modified toT¼T0þT, whereT0is the experimental temperature (room temperature in the current experiments) and T is the temperature increment caused by plastic deformation. T is calculated from: T¼ ½0:9=Cp
R"T
0 Td"T, where is the density (2.78 g/cm3),Cp is the heat capacity (0.2207 J g1 perC),
T is the true stress andd"T is the true strain interval. The
material constants of the constitutive equation are calculated by applying regressional analysis to the experimental data
plotted in Fig. 3(a). The material constants are found to be 0¼767:4MPa, c2¼170:8MPa, c3¼0:036 (K1), c4¼
4:36103 (K1) and n¼0:25. Figure 5 compares the experimental and calculated flow stress curves. It is observed that the two sets of results are in good agreement. Hence, the Zerilli–Armstrong fcc constitutive equation provides an accurate means of predicting the dynamic deformation behaviour of Al–Sc alloy at room temperature.
0 0.1 0.2 0.3 0.4 0.5
True Strain,
400 500 600 700 800 900 1000 1100
T
rue Stress,
σ
/MP
a
Experimental Calculated 5.8×10³ s-1
4.7×10³ s-1
3.2×10³ s-1
2.2×10³ s-1
1.2×10³ s-1
Nominal Strain Rate
T
ε
T
Fig. 5 Comparison of measured and calculated flow stress–strain curves.
(a)
(b)
(c)
Fig. 6 (a) Low magnification SEM fractograph of specimen deformed at strain rate of2:2103s1. Scanning electron micrographs of fractured
surface of specimen deformed at strain rates of: (b)2:2103s1 and
[image:5.595.64.280.74.273.2] [image:5.595.306.549.80.589.2]3.4 Fractographic and microstructure evolution
The fracture surfaces of the deformed specimens were examined under a scanning electron microscope (SEM). The fracture analysis revealed that specimen failure is dominated by localized shearing. Specimen fracture occurs along a plane orientated at approximately 45 to the loading direction, i.e. along the direction of maximum shear stress. Figure 6(a) shows a low magnification view of the fracture features of a specimen deformed at a strain rate 2:2
103s1. Table 4 presents the conditions associated with the occurrence of shear bands and cracking in the Al–Sc alloy. It is apparent that the occurrence of shear bands and cracking is dependent not only on the strain rate, but also on the plastic strain. Figures 6(b) and (c) present SEM micrographs of specimens deformed at strain rates of 2:2103 and 5:8
103s1, respectively. In Fig. 6(b), the fracture is character-ised by a transgranular dimple-like structure, which is indicative of ductile fracture. The dimples are elongated primarily along the shear direction. When the strain rate is increased to 5:8103s1 [Fig. 6(c)], the fracture appear-ance is still dominated by the dimple-like structure, but sub-cracking is also observed in the matrix due to the increased applied stress. Comparing the fracture features of Figs. 6(b) and (c), it is observed that the depth and density of the dimples decrease with increasing strain rate, while sub-cracking becomes more pronounced. This indicates that an increased strain rate reduces the ductility of the specimen and hence leads to specimen fracture at a lower strain. The microstructural characteristics of the fracture features shown in Figs. 6(b) and (c) are consistent with the stress–strain curves presented in Fig. 3(a), which indicate that the fracture strain decreases with increasing strain rate.
To investigate the influence of strain rate on the micro-structural evolution of the deformed specimens, undeformed and deformed specimens were studied using transmission electron microscopy (TEM). Figure 7 shows the initial microstructure of an undeformed specimen. The micro-structure exhibits a random distribution of fine and coarse precipitates within the grains and aligned along the grain boundaries. These precipitates are identified as Al3Sc type particles. The presence of Al and Sc in these particles is confirmed by Energy Dispersive Spectrometer (EDS) analy-sis. The dislocation density in the undeformed condition is relatively low. However, impact deformation has a signifi-cant influence on the microstructure of the deformed speci-mens. Figure 8(a) shows a TEM micrograph of a specimen deformed at a strain rate of1:2103s1. The presence of the Al3Sc precipitates in the matrix creates a barrier effect, which
accelerates the generation and accumulation of dislocations. The rapid increase in dislocation density leads to the formation of random dislocation cells with a thick and loose cell wall. Since Al–Sc alloy is a high stacking fault energy material, the formation of dislocation cells and the occur-rence of dislocation cross-slipping occur more readily at high strain rate loading conditions. A similar precipitate/disloca-tion interacprecipitate/disloca-tion behaviour is also observed in the precipitates located at the grain boundaries. As shown in Fig. 8(b), the dislocations accumulate around the precipitates.
When the strain rate is increased to3:2103s1, Fig. 8(c) shows that the dislocation arrangements are similar to those observed in the specimen deformed at the lower strain rate of
[image:6.595.307.548.72.275.2]1:2103s1[Fig. 8(a)]. However, an increased dislocation density is apparent in the higher strain rate case. The substructure still consists of dislocation cells, but the cell size and wall thickness are reduced at the higher strain rate loading condition. An enhanced strain rate also increases the degree of interaction between the precipitates and the dislocations, resulting in a significantly higher dislocation density around the Al3Sc precipitates. This phenomenon is clearly visible in Fig. 8(d). Figure 8(e) shows the dislocation structure of a specimen deformed at 5:8103s1. In this figure, the dislocation cell structure is well developed, and dense dislocation tangles are evident within the cell wall. The dislocation density at this strain rate is higher, and the cell size and wall thickness are relatively smaller than those evident at a strain rate of 3:2103s1 [Fig. 8(c)]. The higher degree of dislocation tangling associated with small dislocation cells reduces the dislocation mobility and generates a significant increase in the flow stress and work hardening rate. Significantly, during deformation at the highest tested strain rate of 5:8103s1, dislocation cells are typically formed near the precipitates and grain bounda-ries, as shown in Fig. 8(f). This implies that the precipitates and grain boundaries are significant contributory factors in forming the dislocation cells and improving the strength of the Al–Sc alloy. The precipitates and grain boundaries act as a barrier interrupting the mobility of the dislocations, thereby Table 4 Conditions associated with occurrence of shear bands and
cracking in Al–Sc alloy.
Nominal strain rate
(s1) True strain Fracture state
1:2103 0.41
2:2103 0.32
3:2103 0.26
4:7103 0.22
5:8103 0.16
: safe; : shear band and cracking.
[image:6.595.46.291.94.181.2](a) (d)
(b) (e)
(c) (f)
Fig. 8 TEM micrographs of dislocation arrangement for specimens deformed at strain rates of: (a)""_¼1:2103s1 and (b) ""_¼
1:2103s1, showing interactions between Al
3Sc precipitates and dislocations; (c)""_¼3:2103s1; and (d)""_¼3:2103s1,
showing interactions between Al3Sc precipitates and dislocations; (e)""_¼5:8103s1and (f)""_¼5:8103s1, showing dislocation
[image:7.595.72.538.83.735.2]producing a rapid increase in the dislocation accumulation rate and the work hardening rate.
Changes in the dislocation microstructure induce corre-sponding changes in the mechanical behaviour of the tested alloy. To correlate the observed dislocation microstructure with the measured mechanical response, we measure the dislocation density, cell size and dislocation cell size to cell wall thickness ratio from the TEM micrographs. The dislocation density is determined using the method outlined by Ham,30) i.e. ¼2n=Lt, where n is the number of
intersections between a dislocation and a random set of lines of lengthLandtis the foil thickness. Figure 9(a) shows the variation of the dislocation cell size with the dislocation density as a function of the strain rate. It is observed that an increasing strain rate increases the dislocation density, but decreases the dislocation cell size. A linear relationship is found between the strain rate and the dislocation density. The increase in dislocation density induces a reduction in the dislocation cell size and in the dislocation cell size to cell wall thickness ratio (D/d). Figure 9(b) shows the variation of the strain rate sensitivity and the activation volume with the dislocation cell size. The results reveal that both the strain rate sensitivity and the activation volume are dependent on the dislocation cell size. As the cell size reduces, the flow stress and the strain rate sensitivity increase, but the activation volume decreases. Figure 9(c) shows that the flow stress enhancement is related to the reduction in the dislocation cell size and the associated increase in the dislocation density. A higher flow stress (corresponding to a lower dislocation cell size to cell wall thickness ratio) indicates a higher level of work hardening of the alloy.
4. Conclusions
The present study has shown that the dynamic mechanical response and microstructural evolution of Al–Sc alloy is significantly dependent on the strain rate. As the strain rate is increased, the flow stress increases and the fracture strain decreases. An increase in the work hardening rate with increasing strain rate is observed due to the strain rate specific microstructural changes induced in the deformed specimens. It has been shown that the strain rate sensitivity and activation volume are related to the work hardening stress and correspond to the dislocation cell size. The Zerilli– Armstrong fcc constitutive law has been used to model the dynamic mechanical response of the Al–Sc alloy. The results calculated using this equation are in good agreement with the experimental measurements. Specimen fracture is dominated by intensive localized shear. The fracture surfaces contain a transgranular dimple-like structure, whose form is strain rate sensitive. The dislocation density increases with increasing strain rate. The rapid increase in flow stress at high strain rates is explained by the rapid accumulation of dislocations and by the increased resistance to dislocation motion imposed by the grain boundaries and Al3Sc precipitates. The high degree of interaction between the dislocations, grain boundaries and precipitates leads to an increased work hardening effect at high strain rates. Dislocation cell structures are observed in the deformed specimens. The configuration of these dislocation cells depends on the strain
rate. The high dislocation density associated with a small dislocation cell size improves the flow strength of the Al–Sc alloy.
10 20 30 40 50 60
Dislocation Density, /1010
×cm-2 0.5 1 1.5 2 2.5 3 Reciprocal
Dislocation Cell Size,
D -1 / µ m -1 )
Nominal Strain Rate,
ε
. /s
-1
103 6×10³
5×10³
3×10³
2×10³ 4×10³
εT = 0.15
ρ
(a)
0.2 0.4 0.6 0.8 1 1.2 1.4 1.6 1.8
Dislocation Cell Size, D /µm
12 15 18 21 24 27 30
Strain Rate Sensiti
vity , β / MP a 4 6 8 10 Acti v ation V olume, β ν*/b3 εT= 0.15
750 800 850 900 950 1000
Flow Stress, /MPa
0.5 1 1.5 2 2.5 3
Reciprocal Dislocation Cell Size,
D
-1 /
µ m -1 0.8 1.2 1.6 2
Dislocation Cell Size /Cell
W all Thickness, D/d D-1 D/d εT= 0.15
T σ ν / b * 3 (b) (c)
[image:8.595.322.533.71.655.2]Acknowledgement
The authors gratefully acknowledge the financial support provided to this study by the National Science Council (NSC) of Taiwan under contract no. NSC 94-2212-E-006-038. Special appreciation is also extended to Taiwan Hodaka Technology Co. Ltd. for the supply of the Al–Sc alloy bars.
REFERENCES
1) K. L. Kendig and D. B. Miracle: Acta Mater.50(2002) 4165–4175. 2) S. K. Lawrence and T. T. William: Adv. Mate. Process.10(1997) 23–
24.
3) T. G. Nieh, R. Kaibyshev, L. M. Hsiung, N. Nguyen and J. Wadsworth: Scr. Mater.36(1997) 1011–1016.
4) V. G. Davydov, V. I. Yelagin, V. V. Zakharov and Yu. A. Filatov: Mater. Sci. Forum217–222(1996) 1841–1846.
5) Yu. A. Filatov, Y. I. Yelagin and V. V. Zakharov: Mater. Sci. Eng. A
280(2000) 97–101.
6) A. F. Norman, P. B. Prangnell and R. S. McEwen: Acta Mater.46
(1998) 5715–5732.
7) J. Tarnacki and Y. W. Kim: Scr. Metall.23(1989) 1063–1068. 8) T. D. Rostova, V. G. Davydov, V. I. Yelagin and V. V. Zakharov:
Mater. Sci. Forum331(2000) 793–798.
9) Y. W. Riddle and T. H. Sanders, Jr.: Mater. Sci. Forum331(2000) 799– 804.
10) A. G. Bratuhin, E. B. Glotov, V. I. Lukin and P. P. Pobezhimov: Weld. World Soudage Monde33(1994) 436–439.
11) A. F. Norman, K. Hyde, F. Costelo, S. Thompson, S. Birley and
P. B. Prangnell: Mater. Sci. Eng. A354(2003) 188–198. 12) V. I. Lukin: Weld. Int.10(1996) 987–989.
13) S. Lathabai and P. G. Lloyd: Acta Mater.50(2002) 4275–4292. 14) K. Yu, W. Li, S. Li and J. Zhao: Mater. Sci. Eng. A368(2004) 88–93. 15) O. Roder, O. Schauerte, G. Utjering and A. Gysler: Mater. Sci. Forum
217–222(1996) 1835–1840.
16) V. Singh, K. S. Prasad and A. A. Gokhale: Scr. Mater.50(2004) 903– 908.
17) S. Komura, Z. Horita, M. Furukawa, M. Nemoto and T. G. Langdon: J. Mater. Res.15(2000) 2571–2576.
18) F. Musin, R. Kaibyshev, Y. Motohashi and G. Itoh: Scr. Mater.50
(2004) 511–516.
19) R. R. Sawtell and C. L. Jensen: Metall. Trans. A21(1990) 421–430. 20) G. M. Novotny and A. J. Ardell: Mater. Sci. Eng. A318(2001) 144–
154.
21) E. A. Marquis, D. N. Seidman and D. C. Dunand: Acta Mater.51
(2003) 4751–4760.
22) T. Nicholas: Elastic-Plastic Stress Wave, Impact Dynamics, ed. by J. Zukas, T. Nicholas, H. F. Swift and L. B. Greszczuk, (Wiley, New York, 1982) pp. 95–153.
23) W. S. Lee and J. K. Chou: Mater. Trans.46(2005) 805–811. 24) P. Ludwik: Phys. Zeit.10(1909) 411–417.
25) H. Kobayashi and B. Dood: Int. J. Impact Eng.8(1989) 1–13. 26) G. R. Johnson and W. H. Cook:In 7th International Symposium on
ballistics, (The Netherland, 1983) pp. 541–547.
27) J. R. Klepaczko and C. Y. Chiem: J. Mech. Phys. Solids34(1986) 29– 54.
28) F. J. Zerilli and R. W. Armstrong: J. Appl. Phys.61(1897) 1816–1825. 29) F. J. Zerilli and R. W. Armstrong: Acta Metal. Mater.40(1992) 1803–
1808.