Interaction between Phosphorus Micro-Segregation and Sulfide Precipitation
in Rapidly Solidified Steel—Utilization of Impurity Elements
in Scrap Steel
Zhongzhu Liu
1, Yoshinao Kobayashi
2, Mamoru Kuwabara
1and Kotobu Nagai
21Graduate School of Engineering, Nagoya University, Nagoya 464-8603 Japan 2National Institute for Materials Science, Tsukuba 305-0047, Japan
Copper is one of the main residual elements in steel, especially in recycled scrap steel. Sulfur and phosphorus are two of the main impurities in steel, and it may result in a large emission of slag and CO2to remove them from steel. Utilization of these elements has been an important and difficult matter for metallurgist. In the present paper, the as-cast steels containing different concentrations of copper, sulfur and phosphorus are prepared by strip casting process or laboratory rapid solidification process. The effect of phosphorus addition on sulfide precipitation is investigated and discussed with respect to the morphology, size, and composition of sulfide. Both experimental results and mathematical calculation showed that the addition of phosphorus retards the sulfide precipitation at high temperature, promotes more copper bearings and smaller sulfides precipitation at low temperature. On the other hand, sulfide precipitates are shown to reduce the micro-segregation degree of phosphorus in steel, which may be because some phosphorus dissolves in sulfide and sulfide particles provide more interfaces for phosphorus to distribute. [doi:10.2320/matertrans.MK200704]
(Received June 1, 2007; Accepted July 30, 2007; Published September 12, 2007)
Keywords: phosphorus micro-segregation, manganese sulfide, copper sulfide, precipitation, rapid solidification, low carbon steel
1. Introduction
Copper is one of the major residual elements in steel because it is difficult to be removed during the steelmaking process. With the scrap steel recycled continuously, the concentration of copper in steel has been increasing gradual-ly. Sulfur and phosphorus are undesirable impurities in steel since they may lead to low toughness, poor weldability and so on. Sulfides in steel also cause problems due to their size and morphology. Large sulfides usually result in poor mechanical properties, and non-spherical sulfides cause some properties with anisotropy.
On the other hand, some novel processes, such as thin slab continuous casting and compact rolling process/thermo-mechanical treatment,1,2) have recently become popular
throughout the world, and some other novel processes such as cross-rolling have been studied.3) Such novel processes have encouraged people to reconsider some elements’ roles in steel with more comprehensive views. For example, the harmful effects in the conventional continuous casting and rolling process that are caused by some impurities could be reduced, and these impurities may become beneficial elements in such novel processes. Phosphorus, which is usually considered to be an impurity in steel, has been reported to have great effects on phase transformation and to refine the prior-austenite grain size during the solidification process.4–6)
Copper and sulfur in steel may form copper sulfide, especially during rapid solidification process.7–9) Sulfide
usually has different solubility in different iron phase. Since phosphorus has a great effect on the phase transformation temperature and process, some interaction between phos-phorus and sulfide precipitation may exist. In this paper, the effect of phosphorus on sulfide precipitation, as well as the effect of sulfide on phosphorus micro-segregation are inves-tigated and discussed.
2. Experimental Procedures
2.1 Materials and casting conditions
The chemical compositions for four kinds of steel samples, which are designated as LPS and HPS as well as CuS2P and Cu2P steel, are shown in Table 1. The contents of the impurities in these steels are designed to be slightly higher than those in normal low carbon steel to simulate the scrap steel. The LPS and HPS samples are cast by a twin drum caster at the Mitsubishi Heavy Industries Ltd., Hiroshima R&D Center. The casting speed is about 0.333 m/s, the casting temperature is about 1846 K. The width of mold is 0.6 m and the thickness of samples is about 2:2103m.
The CuS2P and Cu2P samples are prepared in an induction heating furnace under vacuum atmosphere in the laboratory. After 3 kg of electrolytic iron is melted, the alloying elements (Mn, Si, Cu, S) are added to the melted iron. The melt is then cast into a water cooled copper mould. A specimen with a
360200mm steel plate on one side and a 560
200mm steel plate on the other side can be obtained as shown in Fig. 1. More detail description of the preparation of samples could be found in the previous papers.10,11)
2.2 Analysis methods
The precipitates in the samples are observed by Scanning Electron Microscopy (SEM) and Transmission Electron Microscopy (TEM). Specimens for SEM observation are etched by 3 vol% nitric acid (Nital) or 10% acetylacetone-1% tetramethylammonium chloride-methyl alcohol (hereinafter abbreviated to 10% AA electrolyte). In the latter case, the sample is mirror polished and etched in the 10% AA electrolyte at a controlled potential.12)The SEM observation is performed on a LEO 1550 microscope with high-resolution. Carbon extraction replicas are prepared through the standard procedures for TEM observation. The replicas are floated on molybdenum grids and a beryllium specimen
Special Issue on Growth of Ecomaterials as a Key to Eco-Society III
holder is used to avoid the possible detection of copper from the grid and the specimen holder. Although it could be avoided to detect the Cu peak from the grids, unfortunately there is some overlap between the S Kpeak and the Mo L
peak. The value of the ratio between any element (Mn, Cu, Fe) and S based on the present Energy Dispersive X-Ray Spectroscopy (EDS) analysis data is a little lower than the real value in the particle since the S peak reflects the Mo content to some extent. The TEM observation is performed with a JEM-2000FXII microscope operated at 200 kV and coupled to an EDS.
The distribution of phosphorus in CuS2P and Cu2P samples are investigated with an Electron-Probe Micro-Analyzer (EPMA). The analysis is conducted on an area of
1:0241:024cm2 by512512points with a beam size of
1.0mm.
3. Experimental Results
3.1 Sulfide precipitates
Sulfides with two kinds of morphology are found in LPS sample, spherical and plate-like, as shown in Figs. 2 and 3. The size of spherical sulfides varies considerably, from approximately1107m to1:6106m. The large
spher-ical sulfides consist mainly of Mn and S, with some Cu and Fe. When the size of the particles decreased, the content of Cu in sulfides increased as shown in Fig. 2.
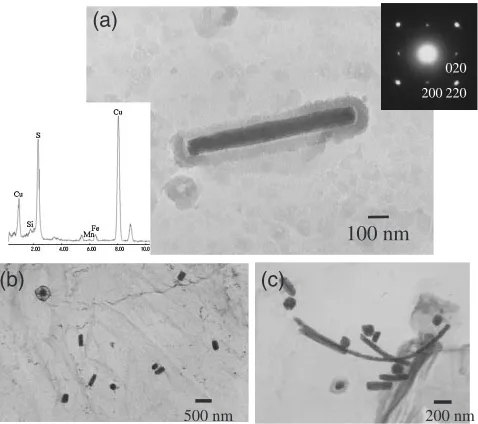
The plate-like sulfides consist mainly of Cu and S, with small amounts of Fe and Mn, as shown in Fig. 3. The short and long axes of the plate-like sulfide are between
ð5{10Þ 108m and ð3{14Þ 107m, respectively.
Fig. 3(c) shows that the diffraction pattern of the plate-like copper sulfide has a face centered cubic (f.c.c) structure. About 8% (in number) of the sulfides have a plate-like morphology in LPS sample.
Two distinct characteristics are observed in HPS sample compared to LPS sample. First is the presence of spherical sulfides as shown in Fig. 4. Most of these spherical sulfides
were mainly Cu2xS (Fig. 4(b) and (d)), and their size was
less than1:5107m, which is far less than the size of the sulfides in LPS sample. The second is the absence of plate-like sulfide in HPS sample.
(a) Quartz
nozzle 3mm
plate
5mm plate
TD
ND
(b)
Water cooled copper mould
Induction furnace
Fig. 1 The lab rapid solidification device for preparation of CuS2P and Cu2P samples.
(b)
(c)
(d)
D
B C
(a)
1 µm
Fig. 2 Spherical sulfides in LPS sample. (a) Morphology; EDS of (b) Point B, (c) Point C, and (d) Point D.
(a)
100 nm 200
020
220
500 nm (b)
200 nm (c)
[image:2.595.47.548.85.158.2]Fig. 3 Plate-like sulfides in LPS sample, f.c.c structure. Table 1 The chemical composition of the samples (mass%).
Sample C Si Mn P S Cu O Ae4, K Ae3, K
Thickness, 103m
LPS 0.096 0.26 0.61 0.013 0.016 0.12 0.004 1754.7 1120.1 2.2
HPS 0.088 0.25 0.56 0.081 0.017 0.12 0.004 1708.2 1171.5 2.2
CuS2P 0.074 0.15 0.68 0.19 0.0593 0.89 <0:004 1633.2 1229.3 5.0
[image:2.595.308.548.184.444.2] [image:2.595.47.290.186.283.2] [image:2.595.308.547.493.705.2]The size distribution of spherical sulfides in LPS and HPS samples is comparably shown in Fig. 5. The spherical sulfide in LPS sample has a wide size distribution, which is from smaller than1107m to larger than1:6106m. On the other hand, the size distribution in HPS sample is from smaller than 1107m to about 5107m. Most of the sulfides in HPS sample are smaller than1:5107m.
Copper sulfides with a fine size of less than 50 nm are also reported in other sample containing 0.12% phosphorus.7,8)It
seems that the fine sulfide, especially copper sulfide, precipitates more easily in high phosphorus steel.
The above results show the effects of phosphorus on sulfide precipitation in the present samples as follows:
(1) The size of spherical sulfide particles becomes smaller in HPS sample compared to that in LPS sample, indicating that phosphorus retards the sulfide precipitation at high temperature;
(2) The composition of the spherical sulfides was mainly MnS in LPS sample while it was mainly Cu2xS in HPS
sample, indicating that phosphorus suppresses MnS precip-itation and promotes Cu2xS precipitation.
(3) The plate-like Cu2xS seldom appears in HPS sample,
indicating that phosphorus has some effect on the copper sulfide morphology.
3.2 Phosphorus micro-segregation
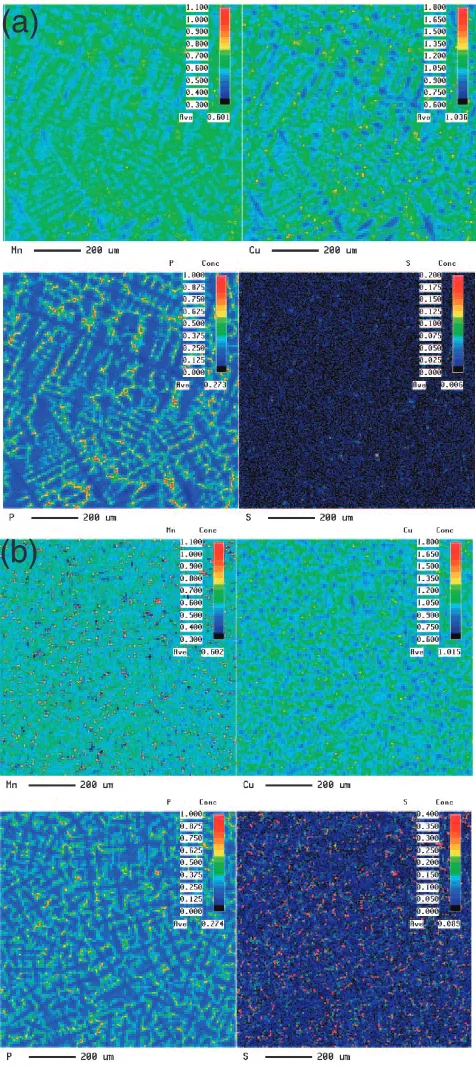
The distribution of phosphorus in CuS2P and Cu2P samples, the former contains sulfide forming elements and the later does not contain, are investigated by EPMA. Figure 6 shows the distribution of concentration of Mn, Cu, P and S elements. Whether in CuS2P sample or in Cu2P sample, most of these elements are rich in the interdendrite
(b)
100 nm E (a)
100 nm
(c) (d)
Fig. 4 Morphology and EDS of spherical sulfides in HPS sample. (a) TEM image and (b) EDS spectrum from extraction replica specimen; (c) SEM image and (d) EDS spectrum, electrolytically etched by 10% AA electrolyte.
0 100 200 300 400 500 600 700
0.0 0.1 0.2 0.3 0.4 0.5 0.6 0.7 0.8 0.9 1.0
Ni
/ N
total
or
Σ
Ni
/
Ntotal
Particle Size , X10−9 m
HPS− Ni / N total
LPS− Ni / N total
HPS−Σ Ni / Ntotal
LPS− Σ Ni / Ntotal
Fig. 5 The size distribution of sulfides in LPS and HPS samples.
(a)
(b)
[image:3.595.48.284.74.283.2] [image:3.595.307.545.78.612.2] [image:3.595.63.273.346.501.2]region, and the dots with high concentration of elements portray the sketch of dendrite structure. That means the main micro-segregation of solute elements in the as-cast sample is caused during the liquid/solid transformation process, although there are several solid phase transformations following the liquid/solid transformation.
Two parameters,K1andK2, are used to evaluate the
micro-segregation degree of phosphorus in present paper. They are defined as the following equations, respectively.
K1¼Cp;iCp;mean
Cp;mean
ð1Þ
K2¼Cp;maxCp;min
Cp;mean
ð2Þ
WhereCp;iis the concentration of phosphorus for pointi;
Cp;mean is the mean concentration of phosphorus for all the
512512 points; Cp;min and Cp;max are the minimum and
maximum concentration of phosphorus in the 512512
points.
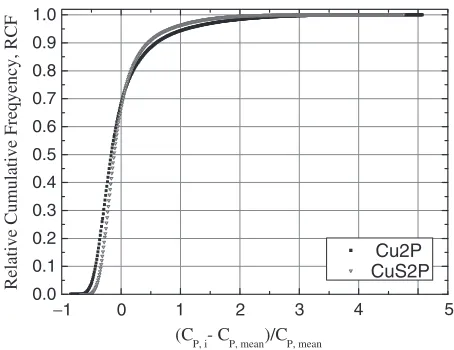
Figure 7 shows the Relative Cumulative Frequency (RCF) vs. K1 in CuS2P and Cu2P samples. The concentrations of
phosphorus for analyzed points in CuS2P sample are closer to the mean value than those in Cu2P sample, which shows the segregation degree of phosphorus in CuS2P sample is lower than that in Cu2P sample. This tendency is also supported by the data listed in Table 2, where it is shown that the micro-segregation degree evaluated byK2 in CuS2P sample (5.45)
is also lower than that in Cu2P sample (5.95). In addition, the concentration range, that is the difference betweenCp;maxand
Cp;min, in CuS2P sample is lower than that in Cu2P sample as
listed in Table 2.
4. Discussion
4.1 Effect of phosphorus on the precipitation of spher-ical sulfide
Phosphorus is a well known ferrite stabilizing element and has a great effect on the phase transformation temperature. According to the Fe-C phase diagram containing different phosphorus concentration,4,10) phosphorus decreases the
liquidus and solidus of steel and also has a great effect on Ae4 and Ae3 temperature. The addition of 0.1 mass% P in
steel may lower Ae4by 55 K and raise Ae3by 70 K.4)Since
phosphorus segregates very easily during solidification, it may have a greater effect on the local transformation temperature compared to that at the equilibrium phase state. The sulfide in the present as-cast steels may be formed in quite a different stage, for example, in the last stage during solidification, during the = transformation, in the -Fe region, and during the=transformation and so on. It is not so easy to determine when a specified sulfide is formed, but for the sulfides with a large size they are usually formed at high temperature, for example during solidification or =
transformation process. A lot of manganese sulfide particles with a large size are observed in LPS sample while few in HPS sample. Phosphorus may exert some influences on these sulfides formation due to its effect on the phase trans-formation temperature, the Equilibrium Distribution Coef-ficient (EDC) of sulfur between liquid and solid phase, the activity coefficient of sulfur and the growth behavior of sulfide.
A modified Clyne and Kurz’s13)mode is used to calculate the redistributation of solute elements during solidification. Half of the area of the secondary dendrite spacing is selected as the calculation domain and is divided into N (N¼30) nodes as shown in Fig. 8. The secondary dendrite arm space is set as 1:5105m in the present calculation based on
experimental data for both LPS and HPS samples. The calculation is carried out by the direct finite difference method which is described in detail in a previous paper.10,14)
The TL,TS,TA4 andTA3 temperatures are calculated by the
following equations,4,15)respectively:
TL¼180978½%C 7:6½%Si 4:9½%Mn 34:4½%P 38½%S 4:7½%Cu; K ð3Þ
TS¼1809175½%C 20:5½%Si 6:5½%Mn 500½%P 700½%S; K ð4Þ
TA4¼1665þ1122½%C 60½%Si þ12½%Mn 550½%P 160½%S; K ð5Þ
TA3¼1183230½%C0:5þ44:7½%Si
30½%Mn þ700½%P 20½%Cu; K ð6Þ
−1 0 2
0.0 0.1 0.2 0.3 0.4 0.5 0.6 0.7 0.8 0.9 1.0
Relative Cumulative Freqyency, RCF
(CP, i- CP, mean)/CP, mean
Cu2P CuS2P
1 3 4 5
[image:4.595.55.282.71.246.2]Fig. 7 The concentration deviation from the mean value revealed by EPMA.
Table 2 The summary of the parameters of EPMA data.
Sample Mean
CP, % SD SEM
Minimum CP, %
Maximum CP, %
CPRang,
% K2
CuS2P 0.274 0.11166 2:18104 0.088 1.582 1.494 5.45
Cu2P 0.273 0.15088 2:95104 0.040 1.664 1.624 5.95
Note: The standard deviation SD¼pffiffiffiffiffiffiffiffiVar, where Var¼ 1 n1
Pn
[image:4.595.48.551.713.766.2]The calculated composition is based on 0.088%C-0.25%Si-0.56%Mn-0.017%S-0.12%Cu. Phosphorus is set as 0.013%P and 0.081% for low P steel and high P steel, respectively. For such composition, the steels are solidified completely as a phase and then proceed to a solid =
transformation. The values of physical properties used for calculation are listed in Table 3.15–17)
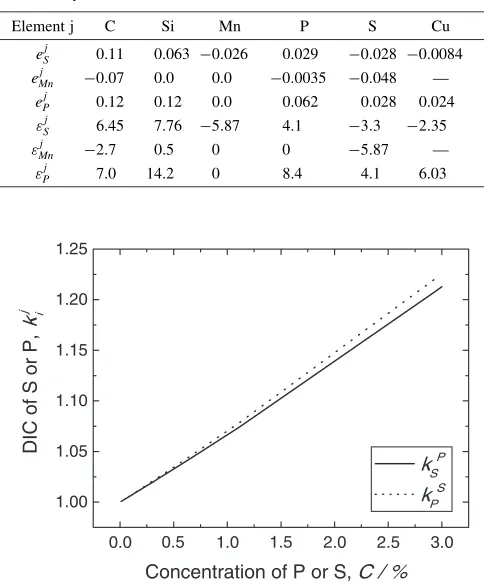
The liquid/solid Equilibrium Distribution Coefficients (EDC) of solute elements in multi-component systems may be different from those in binary systems because of the possible existence of solute interactions. It is difficult to calculate the influence of these interactions on EDC of solute elements, but it is possible to estimate the effect of an addition of one alloying element on the EDC of another element in iron phase as shown in eq. (7).18)
lnkij¼lnk 3 i k2 i
¼ ð1kj2Þ "ijNjL ð7Þ
Where kij is the Distribution Interaction Coefficient (DIC), which shows the effect of addition ofjelement on the EDC of
ielement in iron;k3i is the EDC ofielement in Fe-i-jsystem;
k2i is the EDC ofielement in Fe-isystem, which is equal to
k=L in Table 3 in present calculation; "ij is the interaction coefficient as listed in Table 4;19)NL
j is the mole fraction of j
element in liquid phase. The effects of P on EDC of S, as well as that of S on P are considered in present calculation. There
is no such interaction between P and Mn since"P
Mnis equal to
zero. That interactive effect between P and S is shown in Fig. 9. Phosphorus and sulfur could increase each other’s EDC, which means they could decrease each other’s micro-segregation to some extent.
[image:5.595.58.283.76.278.2]Figure 10 shows the temperature evolution for low P steel and high P steels during solidification. The liquidus and solidus temperature for the high P steel are lower than those for the low P steel, and this tendency is remarkable especially at the solidus temperature. The effect of phosphorus on phase transformation temperature is recently proved by an ‘‘in-situ’’ observation of the = transformation by the present authors.20)The same LPS and HPS samples are firstly hold at 1723 K for 1200 s and then cooled to an ambient temperature with a 0.33 K/s cooling rate. The observed starting temperatures of=transformation in LPS and HPS samples are close at about 1698–1701 K. However, as the transformation continues, the transformation process in the
Table 3 The equilibrium distribution coefficient and diffusion coefficient of the solute elements for mathematical calculation.15{17Þ
elements k=L D, cm2/s Dat 1790
K, cm2/s
Dat 1750
K, cm2/s
C 0.19 0:0127expð19450=RTÞ 5:36105 4:73105
Si 0.77 8:0expð59500=RTÞ 4:34107 2:96107
Mn 0.76 0:76expð53640=RTÞ 2:14107 1:52107
P 0.23 2:9expð55000=RTÞ 5:58107 3:92107
S 0.05 4:56expð51300=RTÞ 2:48106 1:79106
Cu 0.90 25expð62000=RTÞ 6:72107 4:51107
Table 4 Selected interaction coefficients in dilute solutions of ternary iron base alloys at 1873 K.19Þ
Element j C Si Mn P S Cu
eSj 0.11 0.063 0:026 0.029 0:028 0:0084 eMnj 0:07 0.0 0.0 0:0035 0:048 —
ePj 0.12 0.12 0.0 0.062 0.028 0.024
"Sj 6.45 7.76 5:87 4.1 3:3 2:35 "Mnj 2:7 0.5 0 0 5:87 — "Pj 7.0 14.2 0 8.4 4.1 6.03
0.0 1.0 2.0 2.5 3.0
1.00 1.05 1.10 1.15 1.20 1.25
DIC of S or P,
ki
j
Concentration of P or S, C / % kSP kPS
0.5 1.5
Fig. 9 The interactive effect on the distribution coefficient between P and S elements.
CSt+dt
CSt
CO
Solid liquid
Clt
Clt+dt
df
S
0 fS 1.0
δS
1 2 3 ... 28 29 30
Nodes from the center of dendrite Center of
dendrite Inter-dendrite
[image:5.595.305.547.89.382.2] [image:5.595.48.547.683.783.2]HPS becomes slower than that in the LPS, and the finishing temperature of the = transformation of the HPS at about 1585 K is much lower than that of the LPS at about 1653 K. The total times for the = transformation of the LPS and HPS samples are about 142 s and 356 s, respectively. The transformation process in the HPS is greatly retarded compared to that in the LPS, especially in the last quarter stage of the transformation process because of the addition of phosphorus. This retardation effect is also believed existing during solidification process.
During solidification, Mn and S continue to become richer in retained liquid phase due to the redistribution between liquid and solid phase. However, for the present calculation composition, the actual product of Mn and S is still much lower than the equilibrium solubility product for both low P and high P steels. Therefore, MnS could not be formed in the liquid phase in either steel.
The concentration distribution of Mn and S in the solid phase just after solidification is shown in Fig. 11. In low P steel and high P steel, the concentration distribution of Mn is similar to each other, while that of S is quite different. The S in low P steel is richer in the nodes closed to the interdendrite area and shows a steep slope, while in high P steel it is a gentler slope. That difference may be due to the effect of P on the distribution coefficient of S or the back diffusion in solid phase.
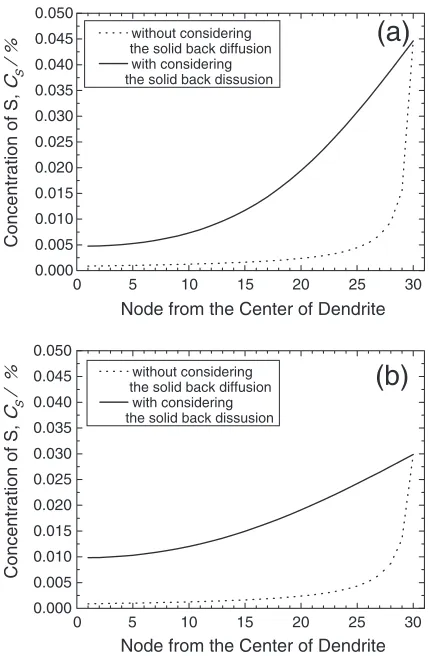
The concentration distribution of S in the solid phase just after solidification with and without considering the solid back diffusion is shown in Fig. 12. Without considering the solid back diffusion, the concentration distribution of S is close to each other in low P steel and high P steel. Only in the last solidified area, the concentration of S in low P steel is obviously higher than that in high P steel, which is caused by the effect of P on the EDC of S in steel. That also means the big difference in the concentration distribution of S (Fig. 11(b)) in both steels is mainly caused by the solid back diffusion. As shown in Fig. 10, high P steel has a wider temperature range from liquidus temperature to solidus
0 5 10 15 20 25 30
0.000 0.005 0.010 0.015 0.020 0.025 0.030 0.035 0.040 0.045 0.050
Concentration of
S,
CS
/ %
Node from the Center of Dendrite
low P steel high P steel
(a)
(b)
0 5 10 15 20 25 30
0.4 0.5 0.6 0.7 0.8 0.9 1.0
Concentration of Mn,
CMn
/
%
Node from the Center of Dendrite low P steel
[image:6.595.320.535.71.399.2]high P steel
Fig. 11 The concentration distribution of (a) Mn and (b) S in solid phase just after solidification.
(b)
0 5 10 15 20 25 30
0.000 0.005 0.010 0.015 0.020 0.025 0.030 0.035 0.040 0.045 0.050
Concentration of S,
CS
/
%
Node from the Center of Dendrite
without considering the solid back diffusion
with considering the solid back dissusion
(a)
0 5 10 15 20 25 30
0.000 0.005 0.010 0.015 0.020 0.025 0.030 0.035 0.040 0.045 0.050
without considering the solid back diffusion with considering the solid back dissusion
Concentration of S,
CS
/ %
[image:6.595.61.274.71.233.2]Node from the Center of Dendrite
Fig. 12 The concentration distribution of S with/without considering the solid back diffusion in (a) LPS and (b) HPS samples.
0.0 0.1 0.2 0.3 0.4 0.5 0.6 0.7 0.8 0.9 1.0 1730
1740 1750 1760 1770 1780 1790 1800
high P Steel
Temperature,
T / K
Solid fraction
TL TS
low P Steel
[image:6.595.66.278.283.615.2]temperature than that of low P steel. Since S is an element with a high diffusion coefficient as shown in Table 3, where the diffusion coefficient of S is more than ten times of that of Mn, and there is more time for S to yield solid back diffusion in high P steel compared with in low P steel, the segregation degree of S in the last solidified zones is quite decreased in high P steel as shown in Fig. 11. On the other hand, Mn has a lower diffusion coefficient and the temperature change has little effect on the distribution of its concentration.
Phosphorus may also have some effect on the activity coefficient of S in steel, as shown in Table 4.19) The calculation shows phosphorus may slightly improve the activity of S, but the activity coefficient product of Mn and S is almost close to 1.0 whether in low P steel or high P steel. Phosphorus not only decreases the micro-segregation of S close to the interdendrite area and retards this micro-segregation to lower temperature, which suppresses the MnS formation, but also slightly improves the activity coefficient of S, which contrarily promotes the MnS formation. The synthetic influence of phosphorus on the formation of MnS at the solidus temperature is shown in Fig. 13. In a large number of nodes the activity product of Mn and S is higher than the equilibrium product in high P steel, but the product value is not so high. On the other hand, in a small number of nodes that product is higher than the equilibrium one in low P steel, but the product value is very high compared to those in high P steel. Since the solidus temperature is quite different, it is reasonable that sulfide in high P steel will be formed from a wider region at lower temperature while in low P steel it is formed from a narrow region with high S concentration at higher temperature. The higher the precipitation temperature, the quicker the growth rate for sulfides, and the more sulfide precipitating at high temperature, the higher tendency to allure sulfide precipitat-ing from the matrix at low temperature. Thus, the retardprecipitat-ing effect of P on sulfide precipitation during solidification may have some active effects on fine sulfide precipitation at low temperature.
The above analysis is not only restricted to solidification process, but also could be applied to = transformation process, during which both of P and S are redistributed from
-phase to -phase similar to their behavior during
solid-ification process. Thus phosphorus also could retard and suppress sulfide formation during = transformation proc-ess. By these reasons, it seems reasonable that fine sulfides are popular in HPS sample while sulfides are with various sizes in LPS sample.
The sulfides in LPS and HPS have quite different com-positions besides the difference in size as shown in Fig. 2 and 4. As discussed in a previous paper,8)MnS has advantages in
precipitation at high temperature, while Cu2xS does at low
temperature. Since phosphorus could suppress sulfide pre-cipitation at high temperature, it seems reasonable that the main composition of sulfide in LPS sample is MnS while in HPS sample it is Cu2xS.
It is also interesting that the plate-like Cu2xS is found
mainly in LPS sample and seldom in HPS sample. Several detailed investigations have been reported on the formation of plate-like MnS in steel up to now. Matsubara21)mentioned
that plate-like MnS precipitated on {100} plane in austenite and was semi-coherent with austenite. Recently, Furuhara22)
confirmed the semi-coherent relationship by High Resolution TEM observation in austenite stainless steel. Kimura23)and
Yamamoto24)observed the precipitation and growth of
plate-like MnS in austenite over a certain temperature range by the Confocal Scanning Laser Microscope. Since Cu2xS and
MnS have the similar f.c.c structure, and the values of the structural parameters are also very close to each other (5:564108m for Cu
2xS and5:224108m for MnS), it
is reasonable to speculate that the present plate-like Cu2xS
precipitates in austenite. Phosphorus significantly increases the Ae3 temperature (Table 1) and therefore may promote
Cu2xS precipitation in-Fe instead of in -Fe. That is the
probable reason why few plate-like Cu2xS are found in high
phosphorus steel.
4.2 Effect of sulfide on the micro-segregation of phos-phorus
As shown in Fig. 7 and Table 2, the micro-segregation degree of phosphorus decreases in sample (CuS2P) contain-ing sulfide particles. Although the micro-segregation of elements mainly results from the redistribution during solidification in a as-cast steel, its behavior also depends on a lot of factors such as temperature history, solute concen-tration, interface and so on.25,26)In addition to free surface and grain boundaries, the following interfaces are also important to segregation behavior: stacking faults and phase interfaces, including precipitate/matrix interfaces.
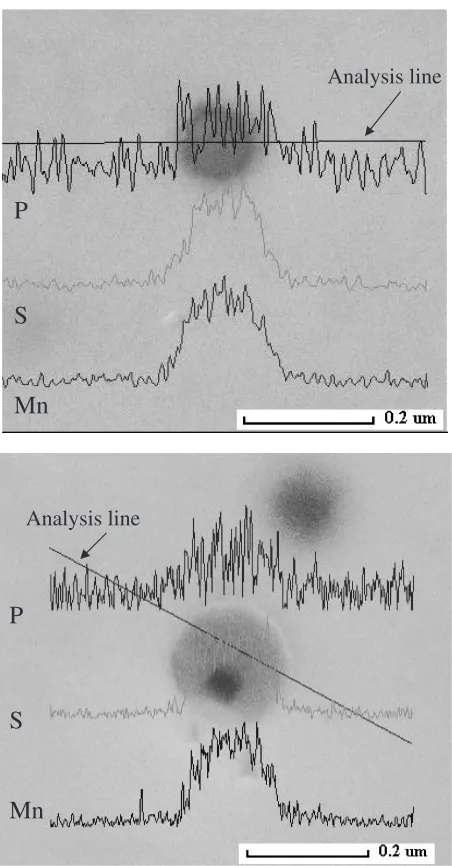
Figure 14 shows a SEM/EDS line profile of Mn, P and S elements across a sulfide particle in CuS2P sample. Phos-phorus is shown co-existing with sulfide. It seems that phosphorus segregates to the interfaces between sulfide and matrix and/or some phosphorus dissolve in the sulfide. Figure 15 shows the EDS spectrums of two sulfides on a TEM extraction replica specimen. Some phosphorus is observed co-existing with this sulfide. Although this phe-nomenon is not observed for all the sulfides, half of the sulfides contain some degree of phosphorus.
Unfortunately there are few reports on the solubility of phosphorus in sulfide and the segregation of phosphorus to the interface between sulfide/iron. Recently a related research work has been reported by Lauretta.27)The author
0 5 10 15 20 25 30
0.000 0.005 0.010 0.015 0.020 0.025 0.030 0.035 0.040 0.045 0.050
Activity Product,
aMn
*a
S
Node from the Center of Dendrite low P steel
high P steel
activity product
[image:7.595.64.276.73.230.2]equilibroum solubility product
investigated the sulfidation of a Fe-based alloy containing 4.75%Ni, 0.99%Co, 0.89%Cr, and 0.66%P in 1.1% H2S-H2
gas mixtures at 673–1274 K. After sulfidation for 4.5 hr at different temperature, a sulfide layer is present on the metal. In most experiments Ni, Co, and P are significantly enriched at the metal-sulfide interface in the mineral schreibersite. This mineral also formed at 1273 K but is not limited to the metal-sulfide interface and is instead evenly distributed as small inclusions through the sulfide layer.
It seems reasonable that the segregation degree of phosphorus in a sample containing sulfide particles is reduced if phosphorus has some solubility in sulfide particles and sulfide particles provide more interfaces for phosphorus to distribute. The area of these interfaces will greatly increase especially when the sulfide particles has a fine size.
Once phosphorus could segregate to the interface between sulfide/iron, this will also cause some influence on the sulfide growth after precipitation. The sulfide growth behavior could be described by Ostwald ripening model as the following equation:28)
r3t r03¼8D½MVm
9RT t ð8Þ
where, rt is the particle radius at time t, r0 is the particle
radius at initial time,is the surface energy of the particle-matrix interface, Dis the diffusivity of the relevant atomic species, [M] is the concentration of the relevant atomic species in the matrix,Vmis the particle molar volume,Ris the
gas constant, andTis the temperature. We can observe either a lowor low diffusion coefficients results in a low growth rate. The grain boundary energy in -Fe is decreased from 0.795 J/m2in pure Fe to 0.575 J/m2in Fe containing 0.086%
P at 1723 K,29) it is also anticipated that phosphorus will
decrease the interface energy between sulfide/iron. Although there are few data about the effect of phosphorus on interface energy between sulfide/iron, it is reasonable that the segregation of phosphorus to the interface between sulfide/ iron will restrict the growth of sulfide to some extent.
5. Conclusions
Samples with different copper, sulfur and phosphorus concentrations are prepared by rapid solidification using a pilot strip caster or a laboratory rapid solidification caster. The interaction between phosphorus and sulfide precipitation are investigated. Phosphorus are shown to suppress manga-nese sulfide precipitation at high temperature while promote copper sulfide precipitation with a finer size at low temper-ature, especially in an alpha-Fe phase. These effects result from the effects of phosphorus on phase transformation temperature, activity coefficient of sulfur and the growth
Analysis line
P
S
Mn
P
S
Mn
[image:8.595.56.282.69.502.2]Analysis line
Fig. 14 Distribution of P along/around sulfide particles, SEM/EDS line-scan profile. Sample CuS2P.
500 nm
(a)
(b) (c)
[image:8.595.305.544.72.366.2]behavior of sulfide. The segregation degree of phosphorus in steel containing sulfide particles is reduced, which may be due to the fact that phosphorus has some solubility in sulfide particles and sulfide particles provide more interfaces for phosphorus to distribute.
Acknowledgements
The authors would like to express their gratitude to Dr. F. Yin, NIMS, and Dr. N. Yoshida, Sumitomo Metals, for their fruitful discussions.
REFERENCES
1) T. Watanabe: Tetsu-to-hagane88(2002) 107–116. 2) O. Umezawa: Bull. Iron Steel Inst. Jpn.7(2002) 545–554.
3) T. Hanamura, T. Yamashita, O. Umezawa, S. Torizuka and K. Nagai: J. Advanced Science13(2002) 179–182.
4) N. Yoshida, O. Umezawa and K. Nagai: ISIJ Int.43(2003) 348–357. 5) N. Yoshida, O. Umezawa and K. Nagai: ISIJ Int.44(2004) 547–555. 6) O. Umezawa, K. Hirata and K. Nagai: Mater. Trans.44(2004) 1266–
1270.
7) Z. Liu, Y. Kobayashi and K. Nagai: Mater. Trans.45(2004) 479–487. 8) Z. Liu, Y. Kobayashi and K. Nagai: ISIJ Int.44(2004) 1560–1567. 9) A. Guillet, E. Es-Sadiqi, G. Lesperance and F. G. Hamel: ISIJ Int.36
(1996) 1190–1198.
10) Z. Liu, Y. Kobayashi and K. Nagai: Mater. Trans.46(2005) 26–33. 11) Z. Liu, Y. Kobayashi, J. Yang, K. Nagai and M. Kuwabara: Mater.
Trans.47(2006) 2312–2320.
12) F. Kurosawa and I. Taguchi: Mater. Trans.31(1990) 51–60. 13) T. W. Clyne and W. Kurz: Metall. Trans. A12(1981) 965–971. 14) Z. Liu, J. Wei and K. Cai: ISIJ Int.42(2002) 958–963.
15) Tekko-Binran(Handbook of Iron and Steel), 3rd Ed., (ISIJ, Maruzen, Tokyo, 1981) pp. 193–205.
16) Tekko-no-Gyoko(Solidification of Steel), Suppl., (ISIJ, Tokyo, 1977) pp. S32–S50.
17) Y. Ueshima, S. Mizoguchi, T. Matsumiya and H. Kajioka: Metall. Trans. B17B(1986) 845–859.
18) Z. Morita and T. Tanaka: Trans. ISIJ24(1984) 206–211.
19) J. F. Elliott: Proc. 32nd Electric Furnance Con. (Iron and Steel Society of AIME, 1974) pp. 62–74.
20) Z. Liu, Y. Kobayashi, J. Yang, K. Nagai and M. Kuwabara: ISIJ Int.46 (2006) 847–853.
21) K. Matsubara: Trans ISIJ.6(1966) 29–38.
22) T. Furuhara, T. Shinyoshi, G. Miyamoto, J. Yamaguchi, N. Sugita, N. Kimura, N. Takemura and T. Maki: ISIJ Inter.43(2003) 2028–2037. 23) S. Kimura, K. Nakajima, S. Mizoguchi and H. Hasegawa: Metall.
Mater. Trans. A33(2002) 427–436.
24) K. Yamamoto, H. Shibata and S. Mizoguchi: CAMP-ISIJ.17(2004) 72.
25) R. G. Faulkner: Inter. Mat. Rev.41(1996) 198–208.
26) E. D. Hondros and M. P. Seah: Inter. Mat. Rev.22(1977) 262–301. 27) D. S. Lauretta: Oxidation of Metals64(2005) 1–22.
28) T. Gladman: The Physical Metallurgy of Microalloyed Steels(The Institute of Materials, 2002) pp. 201–210.