Two-Dimensional Quantitative Analysis of Preferential Alignment of BAp c-axis
for Isolated Human Trabecular Bone Using Microbeam X-ray Diffractometer
with a Transmission Optical System
Sayaka Miyabe
1;*1, Takayoshi Nakano
1;*2, Takuya Ishimoto
1;*1, Naoki Takano
2, Taiji Adachi
3,
Hiroyoshi Iwaki
4, Akio Kobayashi
4, Kunio Takaoka
4and Yukichi Umakoshi
11Divison of Materials and Manufacturing Science, Graduate School of Engineering, Osaka University, Suita 565-0871, Japan 2Department of Micro System Technology, Ritsumeikan University, Kusatsu 525-8577, Japan
3Department of Mechanical Engineering and Science, Graduate School of Engineering, Kyoto University, Kyoto 606-8501, Japan 4Department of Orthopaedic Surgery, Graduate School of Medicine, Osaka City University, Osaka 545-3851, Japan
Two-dimensional quantitative analysis of microbeam X-ray diffraction (XRD) was performed using a transmission optical system to examine biological apatite (BAp) orientation in an isolated trabecula of a human fourth lumber vertebral body. The incident X-ray beam is 20mmin diameter, which is small enough for the isolated trabecula despite a slight beam divergence of 0.2. Integrated intensities of (002) and
(310) are obtained separately by different incident angles and detector positions. Distribution of the preferential orientation of the BAp c-axis is finally calculated quantitatively as an integrated intensity ratio of (002)/(310) in a plane containing the trabecular direction.
Preferential alignment of the BAp c-axis was finally determined to be perfectly parallel to the fiber direction in a rod-shaped trabecula, since accurate one-dimensional alignment is different from the alignment in the femoral cortical bone as a long bone that shows the local maximum of preferential alignment perpendicular to the longitudinal bone axis. For example, the integrated intensity ratio of (002)/(310) has a maximum value of 16 along the trabecular fiber and a minimum value of 0.09 in the perpendicular direction.
Using this method, the anisotropy of BAp orientation in the trabecular bone can be quantitatively evaluated in the plane including the trabecular fiber. Thus, we successfully obtained a methodology that two-dimensionally analyzes the distribution of the BAp c-axis along all axes within a plane in a bone specimen. [doi:10.2320/matertrans.48.343]
(Received November 22, 2006; Accepted December 18, 2006; Published February 25, 2007)
Keywords: trabecula, human vertebra, biological apatite crystallite, texture, bone quality, microbeam X-ray diffraction, position sensitive proportional counter (PSPC)
1. Introduction
Since trabecular bone shows much more metabolism activity than cortical bone, it acts as a reservoir to regulate the concentration of calcium and other mineral ions throughout the human body.1)During modeling or remodeling, on the
other hand, the trabecular direction is selected along the stress line due to one functional adaptation of bone, as originally mentioned by Wolff.2) Many trabecular bone
studies, which have been performed focusing on the patterns and distribution of trabecular fibers,3,4) have also been calculated to clarify stress distribution in cancellous bone.5,6) At the nanoscale level, bone is a composite material mainly based on biological apatite (BAp) and collagen fibrils. BAp is an ionic crystal that crystallizes in an anisotropic hexagonal lattice in which the arrangement of ionic atoms is quite different along the crystallographic directions, for example, the a- and c-axes in the BAp crystal.7)The c-axes of
BAp crystallites are basically distributed along the extending collagen fibrils in bones and form texture.8,9)
The orientation distribution of BAp in bone is crucial in terms of bone reinforcement.10)Nakanoet al.showed that by
using the microbeam X-ray diffraction technique mature cortical bones such as rabbit ulna, rabbit skull bone, and monkey dentulous mandible have unique preferential align-ment and texture of the BAp c-axis depending on in vivo stress distribution.11)This indicates that normal original bone
can exhibit an appropriate mechanical function by develop-ing material anisotropy on the basis of the applied stress field. In contrast, the degree of BAp orientation in pathological and regenerated bones differs significantly along the representa-tive bone axis from the original normal state.12–16)
Vertebral bones are frequently evaluated in diagnoses of bone diseases, mainly osteoporosis, which is a severe bone disorder in aging societies. Much attention has been paid to the trabecular bone in vertebrae because the trabecula is believed to sustain 30–50% of the vertebral strength.17)
Moreover, the disease affects the tabecular bone more than the cortical bone.18) Many studies have focused on the relationship between trabecular architecture and mechanical properties, and actually, the notable contribution of trabec-ular architecture to the mechanical properties of cancellous bone has been demonstrated.19,20)
Previous reports have focused on BAp texture in cancel-lous bone.13,21–27) Baconet al.found preferential alignment
of BAp orientation in the portion composed of numerous trabeculae in vertebral bone by using a neutron diffraction technique.21,22) Both X-ray diffraction (XRD) and
trans-mission electron techniques clarify the preferred orientation of the BAp c-axis in trabecular bone along the bone longitudinal direction in the pig distal metaphysis of femur due to the preferential arrangement of the BAp c-axis along each trabecular fiber.13)Jaschouzet al.impressively reported the preferential orientation of BAp crystal along the trabecula direction by recently conducting a microbeam X-ray tech-nique onto individual trabecula from (002) pole figure analysis with a central focus on only the trabecular
*1Graduate Student, Osaka University
*2Corresponding author, E-mail: [email protected]
direction.26) Scanning small-angle X-ray scattering (SAXS)
studies revealed that the particle shape of BAp in trabeculae tends to be elongated along the trabecular fiber.24–26)SAXS
results only indirectly represent the BAp orientation, but their data imply that the orientation of BAp particles has a close relationship to crystallographic BAp orientation.26) Recent
reports suggest that each trabecula has preferential alignment of BAp orientation in the fiber direction, but quantitative analysis for the degree of BAp c-axis orientation is needed in each trabecula between parallel and perpendicular to the fiber direction.
In this study, we performed 2D quantitative analysis of BAp orientation distribution in a plane with a trabecular fiber and then clarified the anisotropy of its distribution of BAp orientation parallel and perpendicular to the isolated trabec-ular fiber.
2. Materials and Methods
2.1 Bone specimen
A trabecula aligned approximately along the craniocaudal axis was selected from the central part of the fourth lumber vertebral body of a male cadaver (66-year-old) donated at Osaka City University Hospital. It has no evidence of metabolic bone disease. Analysis of this bone specimen was approved by the Ethics Committee. The bone specimen was fixed and kept in a 10% formalin neutral buffered solution to avoid infections and prevent denaturation of the organic matrix. The trabecula specimen is shown in an elliptical cross section about 220mmalong the long axis and 160mmalong the short axis in diameter at the analysis point.
2.2 Microbeam X-ray diffraction analysis
2D quantitative analysis of preferential BAp orientation was performed by a microbeam X-ray diffractometer system (D8 Discover with GADDS, Bruker AXS) with a trans-mission optical system (Fig. 1). The x-y-z specimen table is mounted on a chi () axis, and theaxis is further mounted on an omega (!) axis. Theaxis is always perpendicular to the !axis and parallel to rotation axis !. Cu-Kradiation was generated at a tube voltage of 45 kV and a tube current of
110 mA, and the incident beam was focused onto a beam spot of 20mmin diameter by a mono capillary collimator with a beam divergence of 0.2. Diffracted beams were detected
with a two-dimensional position sensitive proportional counter (2D PSPC) (Hi-STAR, Bruker AXS) in which the intensity of the diffracted beam could be detected along the and2axes. Distances between specimen and collimator and between specimen and detector were selected to be 5 mm and 15 cm, respectively.
The trabecular specimen was fixed on the x-y-z tables so that the fiber direction was exactly parallel to the y-z plane. Since the trabecular direction is always perpendicular to rotation axis , we can analyze the two-dimensional distribution of the BAp c-axis along all axes within the y-z plane including the trabecular fiber. The short axis on the cross section of the trabecula was fixed to be parallel to rotation axis. An online CCD camera and a laser beam were used for exact positioning of the trabecula. The center of the trabecula’s cross section was fixed to be the center of the rotation of the specimen and beam path.
We used two diffraction peaks of hexagonal-based BAp, (002) and (310), to analyze BAp orientation. The (002) and (310) diffraction peaks appear around Bragg angles of 25.9 and 39.8, respectively, by Cu-Kradiation. We defined the
degree of orientation of the BAp c-axis as an integrated intensity ratio of the (002) diffraction to the (310) diffraction. The value of the orientation degree in randomly orientated apatite (calcium hydroxyapatite) powders (NIST #2910) is 0.6 in this XRD system.
To obtain diffraction information within the y-z plane including the trabecular axis, measurements for both (002) and (310) were performed independently (Fig. 2). Since normal direction to the (002) plane corresponds to the c-axis and is parallel to (310), two diffraction peaks of (002) and (310) are suitable to determine the BAp c-axis orientation. Incident angle (!) was selected as 13 for the (002) diffraction and 20for the (310) diffraction to obtain accurate diffraction intensity along the normal direction to the
χ
Collimator Specimen 2θ
ω
x-y-z table x y
z
X-ray beam
2D PSPC
ω
rotation ω axis
y-z plane
rotation χ axis
Fig. 1 Schematic figure of microbeam X-ray diffraction system with a transmission optical system. 2D quantitative analysis of preferential BAp orientation can be performed within y-z plane by rotation ofaxis.
140° 120° 100°
60°
20°
40°
180°
160°
0°
80°
Specimen x y
z angle, χ
trabecular axis
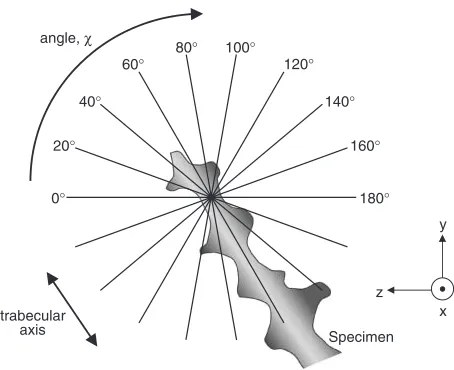
Fig. 2 Schematic drawing showing rotation of bone specimen around
rotation axis to analyze distribution of BAp orientation along directions in the y-z plane.was rotated in steps of 20, and measurements were done
[image:2.595.313.540.70.255.2] [image:2.595.49.289.75.232.2]detectable diffraction lattice planes in each Bragg condition in a plane with the y-z plane. In other words, the accurate degree of BAp orientation for the (002) and (310) planes is detectable in all directions on the y-z plane including parallel and perpendicular directions along the trabecular fiber.
In this study, the specimen was swung along the ! axis within5around the accurate Bragg angle on the y-z plane
(8!18 for (002) and 15!25 for (310)) to
compensate for the slight inclination of the trabecular fiber. The detector was placed at2¼26 and 40 for (002) and (310), respectively.
The specimen was rotated around the rotation axis to analyze the distribution of BAp orientation along the directions in the y-z plane. was rotated in steps of 20,
and measurements were done nine times to cover the 2D data aroundfrom 0 to 180(Figure 2). Diffracted intensity was
recorded for 3600 seconds at each position to obtain sufficient intensity for analysis.
The profile was calculated in steps of 1, and the
integrated intensities of (002) and (310) were obtained by subtraction of the background intensity on the side of (002) and (310) diffraction:24:4224:9and26:92
27:4for (002) and37:3238:3for (310).
3. Results and Discussion
Figures 3(a) and (b) show examples of two-dimensional XRD patterns for analyzing (002) and (310) diffraction, respectively. Several reflections such as (002), (310), and overlapping diffraction peaks of (211), (112), (300), and (202) can be recognized in the figures. The (002) diffraction in Fig. 3(a) and the (310) diffraction in Fig. 3(b) can be obtained along the common axis normal to each correspond-ing diffraction lattice plane of the trabecula, as mentioned in Materials and Methods. In other words, each diffraction represents the orientation distribution along the directions within the y-z plane containing the trabecular fiber, inde-pendent of the rotation of theaxis. The focused diffraction ring appeared through the center of the 2D detector because an appropriate detector position was selected as2¼26for
(002) and2¼40for (310).
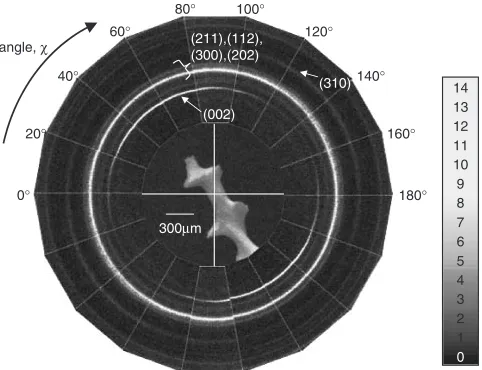
Figure 4 shows the appearance of the trabecula and the corresponding diffraction patterns. Clear arching of (002) reflection was observed, and the range of arching corresponds to the trabecular axis. This suggests that the c-axis of hexagonal BAp is preferentially orientated along the trabec-ular axis. This result is in good agreement with previous studies13,26,27) and strongly suggests that the trabecula is
reinforced along the trabecular direction not only by the distribution of the trabecular fiber network but also by the material property based on the texture formation of BAp and the related collagen. Young’s modulus of bone tissue is well-known to be closely related to the texture of bone tissue.28)In contrast, the distribution of the overlapping diffraction peaks of (211), (112), (300), and (202) along theaxis seems more homogeneous than the (002) diffraction.
We quantitatively evaluated the integrated peak intensities of (002) and (310) as a function offrom 0to 180in steps (b)
(a)
(002)
(310)
(211),(112),
(300),(202) (002)
(310)
(211),(112), (300),(202)
χ 2θ 2θ χ
10 9 8 7 6 5 4 3 2 1
0
11 12 13 14
10 9 8 7 6 5 4 3 2 1
0
11 12 13 14
Fig. 3 Typical two-dimensional microbeam XRD patterns for (002) in (a) and for (310) in (b). Several reflections such as (002), (310), and overlapping diffraction peaks of (211), (112), (300), and (202) appear as a function ofand2axes. Intensity is shown in a pseudo-gray scale.
0° 180° 140° 120° 100°
60°
20° 40°
160° 80°
300µm (002)
(310) (211),(112),
(300),(202)
10 9 8 7 6 5 4 3 2 1 0 11 12 13 14 angle, χ
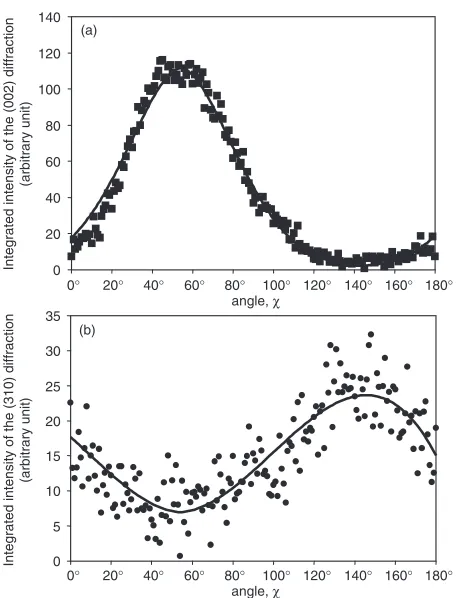
[image:3.595.85.512.70.257.2] [image:3.595.307.548.324.509.2]of 1. The analysis of (002) and (310) was of course
performed by different diffraction patterns with different incident angles (!) to avoid different Bragg conditions. After subtraction of the background from the integrated diffraction peak intensity, we obtained the actual peak intensity distribution of (002) and (310) as a function of rotation angle () (Figs. 5(a) and (b)). Intensity data were then approximated by a polynomial fitting technique, as expressed by a solid line in the figures. Determination coefficient of the fitting (R2) is 0.99 for (002) and 0.75 for (310), which means a successful approximation despite scattered (310) diffraction intensity. Since the change in the integrated intensity of (002) is in direct opposition to (310) as a function of , this measurement for both (002) and (310) diffractions is very reliable.
Figure 6 shows the preferential orientation of the BAp c-axis, which is calculated quantitatively as an integrated intensity ratio of (002)/(310) by using approximated inten-sity. A clear distribution of the preferential BAp orientation alongwas obtained within the y-z plane containing parallel and perpendicular directions to the trabecular axis. Peak maximum appears around ¼54, which corresponds to
the trabecular axis, and peak minimum appears around ¼144, which is perpendicular to the trabecular axis. The
quantitative degrees of BAp orientation as an integrated intensity ratio of (002)/(310) are 16 at maximum peak and 0.09 at minimum peak. Sasaki et al. reported that a weak preferential orientation of BAp c-axis was present in the
perpendicular direction to the long axis of the cortical portion of bovine femur in addition to strong preferential alignment along the long bone axis.9,29)In our study of human trabecular
fiber, not even weak alignment of BAp orientation was found along that direction other than the trabecular fiber because there is no local maximum of the intensity ratio of (002)/ (310) (Fig. 6). This strongly suggests that rod-shaped trabecular fiber shows accurate one-dimensional preferential alignment of the BAp c-axis along the trabecular fiber, which is different from the femoral cortical bone as a long bone.
In this study, we separately measured (002) and (310) diffractions by adjusting the incident angle to the Bragg angle. This enabled us to analyze BAp orientation exactly in the directions between parallel and perpendicular to the trabecular fiber. Hence, the degree of BAp orientation is strongly reliable in the vertebral trabecula of the 66-year-old man. In cortical bone, it is reported that the preferential degree of BAp orientation varies depending on such factors as age,10,30)distribution and magnitude ofin vivostress,11,31)
degree of disease progression,14) and fracture
heal-ing.12,13,16,32) These investigations were done using a
com-parably larger beam, which is sufficient for the cortical bone. However, since the size of the isolated trabecula is just a few hundred mm, a small beam is needed. We used an incident beam whose diameter was 20mmwith a beam divergence of 0.2, which is small enough for individual trabeculae and quantitative mapping on a trabecula within the y-z plane. Analysis on the limited local area for observation, several
mm2, is also possible when using a synchrotron micro-focus X-ray beam with significant intensity, but the system is very ambitious and inconvenient.27,33)Therefore, the technique in
this study conveniently allows verification of bone quality based on mechanical anisotropy to diagnose bone disease.
On the other hand, 2D quantitative analysis can be applied to cortical bone, which is needed to understand the 2D anisotropy of the BAp orientation in-plane. Skull bone, for example, has a unique two-dimensional BAp alignment on the skull surface, but preparing the bone specimen for quantitative analysis is troublesome.11) This technique is useful to analyze the distribution of the BAp c-axis two-dimensionally along all axes within a plane in a bone specimen.
0° 20° 40° 60° 80° 100° 120° 140° 160° 180° angle, χ
0 20 40 60 80 100 120 140
Integrated intensity of the (002) diffraction
(arbitrary unit)
(a)
0 5 10 15 20 25 30 35
(b)
Integrated intensity of the (310) diffraction
(arbitrary unit)
0° 20° 40° 60° 80° 100° 120° 140° 160° 180° angle, χ
Fig. 5 Integrated peak intensity distribution of (002) in (a) and (310) in (b) as a function of rotation angleafter subtraction of background from integrated peak intensity. Incident angle (!) was selected to be 13for
(002) and 20for (310), and the detector was placed at2¼26for (002)
and 40for (310).
0 2 4 6 8 10 12 14 16 18
0° 20° 40° 60° 80° 100° 120° 140° 160° 180°
Integrated intensity ratio of (002)/(310)
(arbitrary unit)
angle, χ
144° 54°
[image:4.595.55.284.69.368.2] [image:4.595.313.542.72.235.2]4. Conclusion
Quantitative analysis of preferential alignment of the BAp c-axis for an isolated human trabecula was two-dimension-ally performed using a microbeam X-ray diffractometer system with an incident beam 20mm in diameter using a transmission optical system. The following conclusions were reached:
(1) An exact integrated intensity ratio of (002)/(310) for bone tissue can be obtained along in all directions within a plane by microbeam XRD with a small incident beam 20mmin diameter. Thus, the anisotropy of BAp c-axis arrangement in a trabecula of human vertebra can be analyzed quantitatively in a plane containing directions parallel and perpendicular to the trabecular fiber.
(2) The rod-shaped trabecula exhibits an accurate one-dimensional alignment of BAp c-axis that is different from the femoral cortical bone as a long bone showing locally weak preferential alignment along a direction perpendicular to the longitudinal bone axis. The integrated intensity ratios of (002)/(310) are 16 and 0.09 in directions parallel and perpendicular to the trabecular fiber, respectively.
(3) The degree of BAp orientation as an integrated intensity ratio of (002)/(310) may be used to check bone quality and diagnose degree of bone disease, relating to mechanical function.
Acknowledgements
This work was supported by funds from the ‘‘Priority Assistance of the Formation of Worldwide Renowned Centers of Research—The 21st Century COE Program (Project: Center of Excellence for Advanced Structural and Functional Materials Design)’’ and a Grant-in-Aid for Scientific Research and Development from the Ministry of Education, Culture, Sports, Science and Technology of Japan. The work was partly supported by Industrial Tech-nology Research Program (Project: 03A47002) in 2003 from New Energy and Industrial Technology Development Or-ganization (NEDO) of Japan and by CREST, Japan Science and Technology Agency. The authors would like to thank Prof. Yuji Nakajima and Prof. Hiroshi Kiyama, Osaka City University for providing the bone specimen. We wish to thank the family of the donor for the generosity in the face of the bereavement.
REFERENCES
1) D. H. Copp and S. S. Shim: Oral. Surg. Oral. Med. Oral. Pathol.16
(1963) 738–744.
2) J. Wolff: Virchows Arch. Pathol. Anat. Physiol. Klin. Med.50(1870)
389–450.
3) S. Majumdar, M. Kothari, P. Augat, D. C. Newitt, T. M. Link, J. C. Lin, T. Lang, Y. Lu and H. K. Genant: Bone22(1998) 445–454. 4) J. H. Kinney, James S. Stflken, T. S. Smith, James T. Ryaby and
N. E. Lane: Bone36(2005) 193–201.
5) M. Ito, K. Nakayama, A Konaka, K. Sakata, K. Ikeda and T. Maruyama: Bone39(2006) 453–459.
6) S. D. Rockoff, E. Sweet and J. Bleustein: Calcif. Tissue Res.3(1969) 163–175.
7) J. C. Elliot:Structure and chemistry of the apatites and other calcium phosphates, (Elsevier, Amsterdam, 1994) pp. 1–389.
8) W. J. Landis: Bone16(1995) 533–544.
9) N. Sasaki and Y. Sudoh: Calcif. Tissue Int.60(1997) 361–367. 10) T. Nakano, Y. Tabata and Y. Umakoshi:Encyclopedia of Materials,
Science and Technology Updates, (Texture and Bone Reinforcement, Elsevier, Oxford, 2005) MS2061 pp. 1–8.
11) T. Nakano, K. Kaibara, Y. Tabata, N. Nagata, S. Enomoto, E. Marukawa and Y. Umakoshi: Bone31(2002) 479–487.
12) T. Nakano, K. Kaibara, Y. Tabata, N. Nagata, S. Enomoto, E. Marukawa and Y. Umakoshi:Tissue engineering for therapeutic use 6, (Analysis of hydroxyapatite (HAp) texture in regenerated hard tissues using micro-beam X-ray diffractometer technique, Elsevier, Tokyo, 2002) pp. 95–104.
13) T. Nakano, T. Ishimoto, J. W. Lee, Y. Umakoshi, M. Yamamoto, Y. Tabata, A. Kobayashi, H. Iwaki, K. Takaoka, M. Kawai and T. Yamamoto: Mater. Sci. Forum512(2006) 255–260.
14) J. W. Lee, T. Nakano, A. Kobayashi, K. Takaoka, Y. Tabata and Y. Umakoshi: Phosph. Res. Bull.17(2004) 83–84.
15) J. W. Lee, T. Nakano, S. Toyosawa, N. Ijuhin, Y. Tabata, M. Yamamoto and Y. Umakoshi: Mater. Sci. Forum512(2006) 265–268. 16) T. Ishimoto, T. Nakano, Y. Umakoshi, M. Yamamoto and Y. Tabata:
Mater. Sci. Forum512(2006) 261–264.
17) R. B. Mazess: Calcif. Tissue Int.47(1990) 191–193.
18) A. Shiraishi, S. Higashi, T. Masaki, M. Saito, M. Ito, S. Ikeda and T. Nakamura: Calcif. Tissue Int.71(2002) 69–79.
19) M. Ito, A. Nishida, A. Koga, S. Ikeda, A. Shiraishi, M. Uetani, K. Hayashi and T. Nakamura: Bone31(2002) 351–358.
20) A. M. Parfitt: Am. J. Med.82(1987) 68–72.
21) G. E. Bacon and R. K. Griffiths: J. Appl. Cryst.10(1977) 124–126. 22) G. E. Bacon, P. J. Bacon and R. K. Griffiths: J. Anat.128(1979) 277–
283.
23) S. Rinnerthaler, P. Roschger, H. F. Jakob, A. Nader, K. Klaushofer and P. Fratzl: Calcif. Tissue Int.64(1999) 422–429.
24) N. P. Camacho, S. Rinnerthaler, E. P. Paschalis, R. Mendelsohn, A. L. Boskey and P. Fratzl: Bone25(1999) 287–293.
25) P. Roschger, B. M. Grabner, S. Rinnerthaler, W. Tesch, M. Kneissel, A. Berzlanovich, K. Klaushofer and P. Fratzl: J. Struct. Biol.136(2001) 126–136.
26) D. Jaschouz, O. Paris, P. Roschger, H. Hwang and P. Fratzl: J. Appl. Cryst.36(2003) 494–498.
27) E. Rokita, P. Chevallier, P. H. A. Mutsaers, Z. Tabor and A. Wrobel: Nucl. Inst. Meth. Phys. Res. B240(2005) 69–74.
28) W. Bonfield and M. D. Grynpas: Nature270(1977) 453–454. 29) N. Sasaki, N. Matsushima, T. Ikawa, H. Yamamura and A. Fukuda:
J. Biomech.22(1989) 157–164.
30) G. E. Bacon and R. K. Griffiths: J. Anat.143(1985) 97–101. 31) T. Ishimoto, T. Nakano, Y. Umakoshi, M. Yamamoto and Y. Tabata:
Phosph. Res. Bull.17(2004) 77–82.
32) T. Nakano, K. Kaibara, T. Ishimoto, Y. Tabata and Y. Umakoshi: Tissue Eng.8(2002) 1232.