Quantitative Analysis of Texture Evolution of Direct Chill Cast and Continuous
Cast AA 1100 Aluminum Alloys during Cold Rolling
Hui Yuan, Jing Li, Dayong Cai, Qingxiang Yang and Wenchang Liu
*Key Laboratory of Metastable Materials Science and Technology, College of Materials Science and Engineering (West Campus), Yanshan University, Qinhuangdao 066004, P.R. China
The hot bands of direct chill cast (DC) and continuous cast (CC) AA 1100 aluminum alloys were annealed at 454C for 3 hours, and then cold rolled to different reductions. The texture of the cold rolled samples was measured by X-ray diffraction in order to compare the texture evolution of the DC and CC aluminum alloys during rolling. The texture volume fractions were calculated by an improved integration method. Mathematical formulae of the texture volume fractions and rolling true strain were established to simulate rolling texture evolution. The results show that the DC AA 1100 aluminum alloy exhibits a lower formation rate of thefiber than the CC AA 1100 aluminum alloy.
[doi:10.2320/matertrans.MRA2007023]
(Received January 25, 2007; Accepted April 12, 2007; Published June 20, 2007)
Keywords: aluminum, cold rolling, texture, x-ray diffraction, texture volume fraction
1. Introduction
The microstructure and texture of aluminum alloy sheets have been extensively investigated for the improvement of their formability. For a given aluminum alloy, the character-istics of texture and microstructure depend strongly on the processing method utilized and the processing variables. Therefore, the determination of the correlation between the parameters describing the characteristics of texture and microstructure and the processing variables is very important to produce high quality aluminum alloy sheets.
Twin-belt continuous cast (CC) processing of aluminum alloy sheets has recently gained extensive attention because of its high productivity and low conversion cost. In the CC processing, the molten metal is poured between two rotating steel belts to produce a cast slab, which is immediately fed into three consecutive hot rolling mills, forming hot-band products. Aluminum sheet produced by the CC processing provides an energy saving of at least 25% and an economic saving of more than 14% over sheet made from conventional direct chill (DC) cast ingots. Due to different processing routes, there are distinct differences in microstructure and texture between CC and DC hot bands, which strongly affect the evolution of microstructure and texture during subsequent processing and hence affect the formability of aluminum
sheets.1–4)Liuet al.1)studied the recrystallization behavior of
cold rolled DC and CC AA 3004 aluminum alloys. They found that it was difficult to obtain a strong cube texture in annealed CC hot bands. The recrystallization occurred more easily in cold rolled DC hot bands than in cold rolled CC hot bands. Similar results were also obtained in DC and CC AA
5182 aluminum alloys.2,3) In the present work the texture
evolution of DC and CC AA 1100 aluminum alloys during cold rolling was investigated by X-ray diffraction. The texture volume fractions of cold rolled samples were calculated by an improved integration method. The effect
of the processing method (DC vs. CC) on the texture
evolution during cold rolling was determined.
2. Experimental
The materials used in the present investigation were CC and DC AA 1100 aluminum alloys. The as-received materials were commercially produced CC and DC hot bands. The thickness of the CC and DC hot bands was 3.26 and 2.53 mm, respectively. The DC and CC hot bands were annealed at
454C for 3 hours followed by air cooling. In order to
investigate the effect of the processing method, the micro-structure and texture of the DC and CC hot bands before and
after annealing at 454C were characterized. The annealed
hot bands were then cold rolled to different reductions ranging from 0 to 92% on a laboratory rolling mill with rolls of 103 mm in diameter. Oil was used as a lubricant. The samples were rolled by alternating the top and bottom sides between passes during multipass rolling. The rolling thick-ness change per pass was about 0.12 mm.
Texture measurements were performed at one fourth-thickness of the cold rolled sheets. The (111), (200), and (220) pole figures were measured up to a maximum tilt angle
of 75 by the Schulz back-reflection method using CuK
radiation. The orientation distribution functions (ODFs) were calculated from the incomplete pole figures using the series
expansion method (lmax¼16).5)The ODFs were presented as
plots of constant ’2 sections with isointensity contours in
Euler space defined by the Euler angles’1,, and’2.
The volume fractions of texture components were
calcu-lated by an improved integration method.3,6)In this method,
Euler space representing all possible crystallographic ori-entations in rolling is subdivided into 6 regions called the
cube, Goss, rotated cube (r-cube), rotated Goss (r-Goss),
brass and copper orientation regions.7)The volume fractions
of the cube, Goss, r-cube, and r-Goss components are
calculated by integration over the cube, Goss,r-cube andr
-Goss orientation regions, respectively. Thefiber runs from
the B orientation f110gh112i through the S f123gh634i
orientation to the C orientationf112gh111i.8–10)It lies in the
brass and copper orientation regions, but does not occupy the
whole region. The orientation intensitiesf(g) within 15.5of
the center position of thefiber in the subset of Euler space
are integrated to represent the volume fraction of thefiber component. The orientations in the remaining brass and copper regions are referred to as remainder orientations.
3. Results
3.1 Microstructure and texture of DC and CC AA 1100 aluminum alloys
Figure 1 shows the microstructure of the DC and CC AA
1100 aluminum alloys before and after annealing at 454C
for 3 hours. All micrographs were taken from longitudinal sections as defined by the rolling direction and the normal direction. It is seen that the DC and CC hot bands possessed a
typical deformation structure. After annealing at 454C, the
[image:2.595.104.493.70.357.2]DC and CC hot bands were fully recrystallized, and the size of recrystallized grains in the DC aluminum alloy was smaller than that in the CC aluminum alloy.
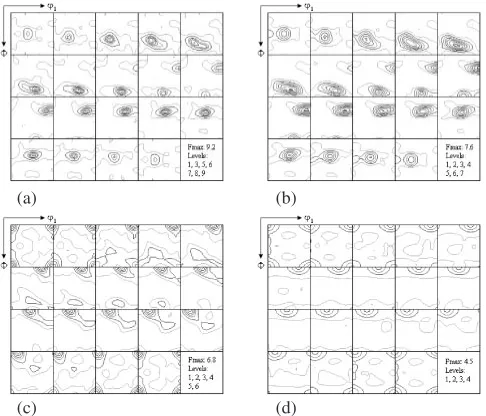
Figure 2 shows the texture of the DC and CC AA 1100
aluminum alloys before and after annealing at 454C for 3
hours. As shown in Figs. 2(a) and 2(b), the DC and CC hot
bands possessed a typicalfiber rolling texture. Thefiber
ran from the B orientation through the S orientation to the C
orientation.8–10)After the hot bands were annealed at 454C
for 3 hours, the texture of DC and CC hot bands was changed
from the fiber rolling texture to the cube recrystallization
texture. The DC aluminum alloy exhibited a stronger cube recrystallization texture than the CC aluminum alloy, which is in agreement with the results obtained in DC and CC AA
30041)and 51823)aluminum alloys. However, the difference
in strength of cube recrystallization texture between the DC and CC AA 1100 aluminum alloys was less than that between the DC and CC AA 5182 aluminum alloys.
3.2 Texture evolution of DC and CC AA 1100 aluminum alloys during rolling
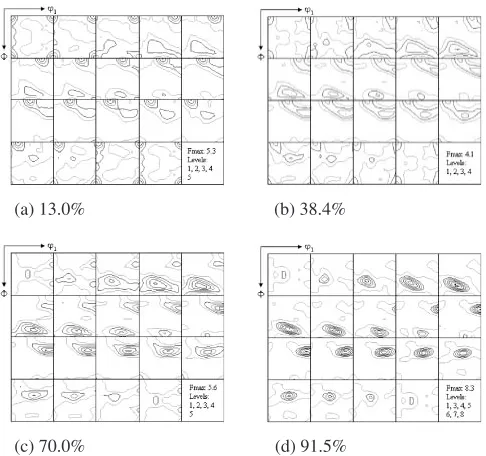
Figures 3 and 4 show the texture evolution of the DC and CC AA 1100 aluminum alloys during rolling, respectively. During cold rolling all initial orientations were rotated to the
stable end orientations,i.e.thefiber component. As the cold
rolling reduction increased, the intensity of the cube orientation decreased, whereas the intensities of orientations
along the fiber increased. After 92% cold rolling, the
Fig. 1 Microstructure of the DC and CC AA 1100 aluminum alloy before and after annealing at 454C for 3 h. (a) DC hot band, (b) CC hot band, (c) annealed DC hot band, and (d) annealed CC hot band.
(a)
(c)
(b)
(d)
[image:2.595.306.549.409.617.2]texture was mainly composed of the fiber component.
Figure 5 shows the maximum intensities of the ODF f(g) for
a particular angle’2along thefiber for the cold rolled DC
and CC AA 1100 aluminum alloys. It is seen that the increase in the intensities of the C and S orientations with reduction was higher than that of the B orientation, especially in the DC AA 1100 aluminum alloy. This was different from the results found in the CC AA 5052 aluminum alloy, in which the intensities of the B and S orientations were higher than the
intensity of the C orientation.10) The lattice rotation of the
cube orientation to the fiber during rolling has been
investigated.10)The cube orientation was rotated to thefiber
through different lattice rotation paths. The large increase in
the intensities of the C and S orientations with reduction indicates that more cube orientations are rotated to the C and S orientations.
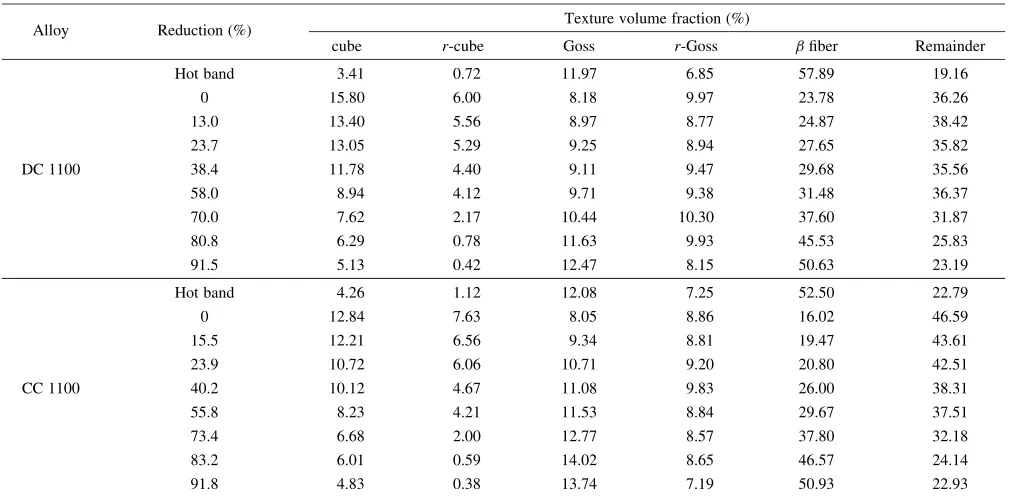
The concept of texture volume fraction has proved useful in the assessment of the orientation distribution of
poly-crystalline samples.8,9,11,12)Table 1 lists the volume fractions
of the cube, r-cube, Goss, r-Goss, fiber and remainder
components. The texture volume fractions of the hot bands are also listed in Table 1. For the DC and CC AA 1100
aluminum alloys, the volume fractions of the cube,r-cube,
Goss, r-Goss, fiber and remainder components presented
similar characteristics with reduction. As the cold rolled
reduction increased, the volume fractions of the cube,r-cube
and remainder components decreased, whereas the volume
fraction of the fiber component increased. The volume
fraction of the Goss component first increased with increas-ing reduction. When the cube component was exhausted, the volume fraction of the Goss component decreased with increasing further reduction.
3.3 Quantitative analysis of rolling texture evolution
The texture evolution of f.c.c. metals during rolling can be described by the variation in the texture volume fractions with rolling true strain. During rolling the orientations near
the cube orientation in the r-cube orientation region first
rotated to the cube component, and then rotated to thefiber.
Therefore, the volume fraction of ther-cube component and
the sum of the volume fractions of the cube and r-cube
components decreased with increasing rolling true strain. The volume fraction of the remainder component also decreased with increasing rolling true strain. The relative change of these texture volume fractions can be expressed by
fi¼ ðMi0MiÞ=Mi0 ð1Þ
whereMi0andMiare the texture volume fractions before and
after cold rolling, respectively. The volume fraction of the
fiber component increases with increasing rolling true strain.
The relative change of the volume fraction of the fiber
component can be expressed by
f¼ ðMM0Þ=ð1M0Þ ð2Þ
where M0 andM are the volume fractions of the fiber
component before and after cold rolling, respectively. Liuet
al.3,6)have studied the texture evolution of cold rolled CC AA
5xxx series aluminum alloys. They found that the
relation-(a) 13.0% (b) 38.4%
(c) 70.0% (d) 91.5%
Fig. 3 ODFs of the DC AA 1100 aluminum alloy cold rolled to reductions of (a) 13.0, (b) 38.4, (c) 70.0, and (d) 91.5%.
(a) 15.5% (b) 40.2%
(c) 73.4% (d) 91.8%
Fig. 4 ODFs of the CC AA 1100 aluminum alloy cold rolled to reductions of (a) 15.5, (b) 40.2, (c) 73.4, and (d) 91.8%.
40 50 60 70 80 90 0
2 4 6 8 10
(a)
B S C
0 13.0 23.7 38.4 58.0 70.0 80.8 91.5
f (g)
ϕ2, o
40 50 60 70 80 90 0
2 4 6 8 10
B S C (b)
0 15.5 23.9 40.2 55.8 73.4 83.2 91.8
f (g)
ϕ2, o
Fig. 5 Intensities of the ODFf(g) at the center position of thefiber as a function of a particular angle’2 for the (a) DC and (b) CC AA 1100
[image:3.595.48.291.71.299.2] [image:3.595.308.548.72.184.2] [image:3.595.47.292.352.578.2]ship betweenfiand rolling true strain (") takes the form of the
Johnson-Mehl-Avrami-Kolmogorov (JMAK) equation:
fi¼1expðki"niÞ ð3Þ
where ki is a constant, and ni is the strain exponent for
different texture components. The rolling true strain (") was
calculated from the rolling reduction (R) by "¼lnð1RÞ.
For the cube +r-cube, fiber, r-cube and remainder
components, the fi values and rolling true strain can be
presented in a ln½lnð1fiÞ vs. ln"format, as shown in
Fig. 6. The values ofkiandniwere determined by fitting the
experimental data into eq. (3). Table 2 shows the values ofki
andnias well as the correlation coefficients (r) of these linear
fits. Figure 7 shows the volume fractions calculated based on
the values ofMi0,ki andni. The experimental data are also
depicted in Fig. 7. It is found that the above JMAK equation could reflect the variation in the volume fractions of the
cube +r-cube, fiber, r-cube and remainder components
with rolling true strain. Thus, the texture evolution of AA 1100 aluminum alloy during rolling can be simulated based
[image:4.595.46.553.83.331.2]on the values ofMi0,kiandni.
Table 1 Texture volume fractions for the cold rolled DC and CC AA 1100 aluminum alloys.
Alloy Reduction (%) Texture volume fraction (%)
cube r-cube Goss r-Goss fiber Remainder
Hot band 3.41 0.72 11.97 6.85 57.89 19.16
0 15.80 6.00 8.18 9.97 23.78 36.26
13.0 13.40 5.56 8.97 8.77 24.87 38.42
DC 1100
23.7 13.05 5.29 9.25 8.94 27.65 35.82
38.4 11.78 4.40 9.11 9.47 29.68 35.56
58.0 8.94 4.12 9.71 9.38 31.48 36.37
70.0 7.62 2.17 10.44 10.30 37.60 31.87
80.8 6.29 0.78 11.63 9.93 45.53 25.83
91.5 5.13 0.42 12.47 8.15 50.63 23.19
Hot band 4.26 1.12 12.08 7.25 52.50 22.79
0 12.84 7.63 8.05 8.86 16.02 46.59
15.5 12.21 6.56 9.34 8.81 19.47 43.61
CC 1100
23.9 10.72 6.06 10.71 9.20 20.80 42.51
40.2 10.12 4.67 11.08 9.83 26.00 38.31
55.8 8.23 4.21 11.53 8.84 29.67 37.51
73.4 6.68 2.00 12.77 8.57 37.80 32.18
83.2 6.01 0.59 14.02 8.65 46.57 24.14
91.8 4.83 0.38 13.74 7.19 50.93 22.93
-3 -2 -1 0 1 2
-5 -4 -3 -2 -1 0 1 2
(a) cube + r-cube
β fibre
r-cube remanider
ln[-ln(1-f
i
)]
ln(ε)
-3 -2 -1 0 1 2
-5 -4 -3 -2 -1 0 1 2
(b) cube + r-cube
β fibre
r-cube remainder
ln[-ln(1-f
i
)]
ln(ε)
[image:4.595.46.550.369.497.2]Fig. 6 ln½lnð1fÞ vs. ln" for the (a) DC and (b) CC AA 1100 aluminum alloys.
Table 2 Values ofkiandniin Equation (3) for the DC and CC AA 1100 aluminum alloys.
Alloy Texture component Mi0(%) ki ni r
cube +r-cube 22.0 0.65 (0:610:69) 0:850:06 0.988
DC 1100 fiber 23.7 0.17 (0:150:18) 1:110:09 0.985
r-cube 6.0 0.77 (0:680:88) 1:290:12 0.979
remainder 39.0 0.18 (0:140:22) 1:090:20 0.922
cube +r-cube 20.5 0.61 (0:590:65) 1:000:05 0.994
CC 1100 fiber 16.0 0.23 (0:220:24) 0:980:03 0.997
r-cube 7.7 1.05 (0:971:13) 1:130:08 0.988
remainder 46.6 0.32 (0:300:34) 0:910:06 0.989
0.0 0.5 1.0 1.5 2.0 2.5 3.0 0
10 20 30 40 50 60 70
(a) cube + r-cube
remainder cube
r-cube
β fiber
Volume fraction, %
ε
0.0 0.5 1.0 1.5 2.0 2.5 3.0
0 10 20 30 40 50 60 70
(b) cube + r-cube
remainder cube
r-cube
β
Volume fraction, %
ε
[image:4.595.286.546.370.601.2]4. Discussion
The experimental results reveal that the processing method affects the microstructure and texture of AA 1100 aluminum alloy. Since the DC hot band is expected to experience larger plastic deformations and higher degrees of recovery than the CC hot band, the DC hot band exhibits finer deformed
microstructure and stronger fiber rolling texture than the
CC hot band. After annealing at 454C for 3 hours, the
microstructure and texture of the DC hot band is different from those of the CC hot band. The DC hot band exhibits finer recrystallized grains and stronger cube recrystallization texture than the CC hot band.
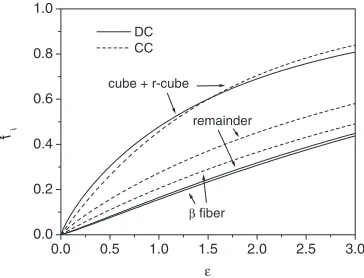
The processing method affects not only the microstructure and texture of the hot bands, but also the texture evolution during cold rolling. The effect of the processing method on
texture evolution can be revealed by thekiandni values in
these JMAK-type equations. Thekivalue reflects the rate of
formation and disappearance of each texture component.
Figure 8 shows the relationship between fi and rolling true
strain for different components. It is seen that the DC alloy
has a lower formation rate of the fiber, a higher rate of
lattice rotation in the cube +r-cube orientation region, and a
lower rate of disappearance of the remainder component than the CC alloy. The difference in the texture evolution between DC and CC alloys is mainly attributed to their initial textures. The DC alloy possesses a stronger cube recrystallization texture than its CC counterpart. The stronger cube
recrystal-lization texture prior to cold rolling decreases the formation
rate of thefiber rolling texture.13)
5. Summary
The texture evolution of the DC and CC AA 1100 aluminum alloys during rolling was investigated by X-ray diffraction. The results are summarized as follows:
(1) The DC hot band possesses finer deformed
micro-structure and strongerfiber rolling texture than the CC hot
band. After annealing at 454C for 3 hours, the DC hot band
exhibits finer recrystallized grains and stronger cube recrys-tallization texture than the CC hot band.
(2) The relationship between the texture volume fractions and rolling true strain can be quantified by using equations of
the JMAK type. Theki value in these equations reflects the
rate of formation or disappearance of each texture compo-nent.
(3) The processing method affects the texture evolution during rolling. The DC alloy has a lower formation rate of the
fiber, a higher rate of lattice rotation in the cube +r-cube
orientation region, and a lower rate of disappearance of the remainder component than the CC alloy.
REFERENCES
1) Y. S. Liu, X. M. Chen, J. T. Liu and J. G. Morris: Mater. Sci. Forum 331–337(2000) 191–196.
2) Y. L. Liu, S. Ding and J. G. Morris:Aluminum Alloys for Packaging III, ed. S. K. Das (Warrendale, Pennsylvania: TMS, 1998) pp. 101–111. 3) W. C. Liu and J. G. Morris: Mater. Sci. Eng. A339(2003) 183–193. 4) Y. M. Zhao, W. C. Liu and J. G. Morris: Metall. Trans. A35A(2004)
3613–3629.
5) H. J. Bunge: Texture Analysis in Materials Science, (Butterworths, London, 1982).
6) W. C. Liu and J. G. Morris: Metall. Trans. A35A(2004) 265–277. 7) W. C. Liu, D. Juul Jensen and J. G. Morris: Acta metall.49(2001)
3347–3367.
8) J. Hirsch and K. Lu¨cke: Acta metall. mater.36(1988) 2863–2882. 9) O. Daaland and E. Nes: Acta metall.44(1996) 1413–1435. 10) W. C. Liu, C.-S. Man and J. G. Morris: Scripta mater.45(2001) 807–
814.
11) K. Lu¨cke, J. Pospiech, J. Jura and J. Hirsch: Z. Metallk.77(1986) 312– 321.
12) M. B. Cortie: Textures and Microstructures29(1997) 155–183. 13) W. C. Liu, T. Zhai, C.-S. Man, B. Radhakrishnan and J. G. Morris: Phil.
Mag.84(2004) 3305–3321.
0.0 0.5 1.0 1.5 2.0 2.5 3.0
0.0 0.2 0.4 0.6 0.8 1.0
cube + r-cube
remainder
β fiber
DC CC
f i
ε
[image:5.595.78.260.74.213.2]