Structural Study of Zr
50Cu
50Amorphous Alloy by Anomalous X-ray
Scattering Coupled with Reverse Monte-Carlo Simulation
T. Kawamata
1;*, Y. Yokoyama
1, M. Saito
2, K. Sugiyama
1and Y. Waseda
31
Institute for Materials Research, Tohoku University, Sendai 980-8577, Japan
2School of Health Sciences, Faculty of Medicine, Niigata University, Niigata 951-8518, Japan
3Institute of Multidisciplinary Research for Advanced Materials, Tohoku University, Sendai 980-8577, Japan
Anomalous X-ray scattering (AXS) analysis was applied for the structural analysis of a rapidly quenched Zr50Cu50amorphous alloy. The
present AXS analysis provided the environmental structural information round Cu and Zr, and the subsequent reverse Monte Carlo (RMC) simulation allowed us to obtain three partial pair distribution functions together with a three-dimensional structural model. The Voronoi polyhedral analysis of the nearest-neighbor region confirms that the structural features are similar to those of the dense random packing of hard spheres (DRPHS) model. The chemical oscillatory structure composed of alternating Cu-rich and Zr-rich coordination shells was realized in the middle range, up to 0.8 nm. The shell structure is suggested to be one of the fundamental structural features of medium-range ordering in the Zr50Cu50amorphous alloy. [doi:10.2320/matertrans.MAW201016]
(Received May 13, 2010; Accepted July 12, 2010; Published August 25, 2010)
Keywords: zirconium-copper, amorphous alloy, anomalous X-ray scattering, reverse Monte-Carlo simulation
1. Introduction
The recent discovery of Zr-Cu-based bulk metallic glasses (BMGs) with interesting mechanical properties, such as high fracture strength, Young’s modulus and plasticity, have aroused much interest in terms of their practical applica-tions.1–3) These findings have also stimulated a variety of advanced structural studies on Zr-Cu glasses, because structural information on metallic glasses is important for understanding their glass forming ability and thermal stability. Fujiwara et al.4) have calculated the partial pair
distribution functions for Zr-Cu metallic glasses by means of the dense random packing of hard spheres (DRPHS) model and obtained a general agreement between their model functions and their experimental results. After their report, a new analytical approach using molecular dynamics (MD) simulation and reverse Monte-Carlo (RMC) modeling5)
against the results of X-ray diffraction and X-ray absorption spectroscopy have allowed us to discuss the structural features in more detail, and the overall preference for Cu-and Zr-centered icosahedral units has been suggested in Cu64:5Zr35:5 and Cu61:8Cu38:2 amorphous alloys.6)This geo-metrical feature was also confirmed by MD simulations,7,8)
and the increase of icosahedral short-range ordering at the Cu-rich region of a Zr-Cu binary system has been discussed in terms of the packing density.8) On the other hand,
Zetterstro¨met al.have reported in 2007 the low probability of icosahedral short-range ordering in Zr50Cu50 amorphous sample, based on the results of X-ray diffraction and neutron diffraction coupled with RMC simulation.9)This
controver-sial discussion of the short-range ordering structure is a consequence of the use of a structural modeling without important information on the three partial pair distribution functions in a binary amorphous alloy.
The concept of partial structural functions describing correlations for individual pairs of chemical constituents in multi-component disordered systems has been emphasized for a long time. The partial structure factors for a binary system can be estimated only by making available at least three independent intensity measurements, for which the weighting factors are varied without any change in their radial distribution functions. This has been achieved in neutron diffraction experiments by the technique of isotopic substitution,10)and was applied to the structural analysis of
amorphous Zr43Cu57 alloy for the first time in 1978.11) On the other hand, the anomalous X-ray scattering (hereafter referred to as ‘‘AXS’’) method12,13)utilizing the anomalous
dispersion effect near the absorption edge yields another answer. Recently, the utility of this AXS method has been greatly improved by the intense white X-rays from a synchrotron radiation source. Furthermore, the development of the reverse Monte Carlo (RMC) simulation technique has led to the reduction of the subsequent difficulty by providing a way of obtaining partial structural information on the necessary conditions.14,15)
The main purpose of the present work is to obtain detailed structural information on Zr50Cu50 amorphous alloy by AXS measurement coupled with RMC modeling (hereafter de-noted as AXS-RMC), and to elucidate the topological features of short-range ordering.
2. Method of the Present AXS-RMC Analysis
The analytical procedure for AXS measurement has been discussed previously.16) For the convenience of the present
discussion, only the a few essential points are given below. The atomic scattering factor of an atom shows a distinct energy dependence due to the anomalous dispersion effect when the energy of the incident X-rays is close to the absorption edge of a constituent element, and can be expressed by
*Corresponding author, E-mail: [email protected]. Graduate
fðQ;EÞ ¼ f0ðQÞ þf0ðEÞ þi f00ðEÞ; ð1Þ
whereQandE are the wave vector and the incident X-ray energy, respectively. The f0ðQÞis the scattering factor of the atom at the energy sufficiently away from the absorption edge, andf0ðEÞandf00ðEÞare the real and imaginary parts of
the anomalous dispersion terms, respectively. The incident X-ray energies on the lower-energy side of the absorption edges were used in the present AXS measurements, because, at the higher-energy side of the absorption edge, there exist intense fluorescent radiation from the sample, which prevents us from accurately evaluating the values of the anomalous dispersion terms. Figure 1 shows the theoretically calculated anomalous dispersion terms of the isolated Cu and Zr in the energy range including the CuK and Zr K absorption edges.13,17) When the incident energy is set to the close
vicinity below the absorption edge,Eabs, of an element, Cu in
this case, the anomalous dispersion phenomenon becomes significant, and so the variation between the intensities, iCuðQ;E1;E2Þ, measured at the incident energies ofE1and
E2 can be attributed to a change in the real part of the anomalous dispersion terms of Cu only (Eabs>E2>E1).
Therefore, the following relationship is readily obtained by using the coherent X-ray scattering intensity,IðQ;EÞ:
iCuðQ;E1;E2Þ
fIðQ;E1Þ hf 2ðQ;E
1Þig fIðQ;E2Þ hf2ðQ;E2Þig
cCuff0CuðE1Þ f0CuðE2ÞgWðQ;E1;E2Þ
¼cCu<ffCuðQ;E1Þ þfCuðQ;E2Þg WðQ;E1;E2Þ
ðaCuCuðQÞ 1Þ
þcZr<ffZrðQ;E1Þ þfZrðQ;E2Þg
WðQ;E1;E2Þ ðaCuZrðQÞ 1Þ; ð2Þ
WðQ;E1;E2Þ ¼X 2
k¼1
ck<ffkðQ;E1Þ þfkðQ;E2Þg
where ci is the atomic fraction and fiðQ;EÞ is the atomic
scattering factor of the i-th element. < denotes the real
part of the values in the brackets, since the quantity of iCuðQ;E1;E2Þ associated with Cu contains two partial structure factors, aCuCuðQÞ and aCuZrðQÞ. Similarly, the
iZrðQ;E1;E2Þ measured at the lower-energy side of the ZrK absorption edge containsaZrZrðQÞandaCuZrðQÞ. Then,
the Fourier transformation of the functions iCuðQ;E1;E2Þ and iZrðQ;E1;E2Þ readily serves the environmental radial
distribution functions (RDF) 4r2
CuðrÞ and 4r2ZrðrÞ,
respectively, by the following equation:
4r2AðrÞ ¼4r20þ
2
Z
QiAðQ;E1;E2ÞsinðQrÞdQ;
ð3Þ
where0 is the average number density in the system. The three partial structure factors can also be obtained based on the numerical solutions of the simultaneous linear equations of iCuðQ;E1;E2ÞandiZrðQ;E1;E2Þobtained through the AXS measurement, and the averaged structure factor, iðQ;EÞð¼IðQ;EÞ Pi2¼1cifi2ðQ;EÞÞ, obtained by the single diffraction measurement. However, the results calculated based on three experimental data sets frequently appear to be ill-conditioned in several positions, producing large uncer-tainties, and physically unreasonable behavior is sometimes found in the resultant pair distribution functions. The RMC simulation technique5)might be one way of reducing some of these problems, and the atomic configurations are estimated rather simply based on their consistency with the experimental data when comparing them with the case using the inter-atomic potential.4)We start with the initial config-uration of a number of atoms in the cubic box of a super-cell. The usual periodic boundary conditions, where the super-cell is surrounded by images of itself, are applied and the partial pair distribution functions, gijðrÞ, are calculated. The inter-ference functions via structure factors estimated based on the simulatedgijðrÞfunctions are compared with the experimen-tal results by calculating the following statistic:
2 ¼X n
m¼1
fiðQmÞ icðQmÞg2 2ðQ
mÞ
þX
Xn
m¼1
fiðQmÞ icðQmÞg2
2 ðQmÞ
; ð4Þ
where icðQmÞ and icðQmÞ are the calculated interference function and its difference for thecomponent, measured at Qm, respectively. ðQmÞ and ðQmÞ are estimates of the experimental error. In RMC modeling, a new configuration is generated as a result of the random movement of the atomic position. When the new configuration, gijðrÞ, produces a value2 smaller than the old one, the new configuration is accepted. This Monte-Carlo iteration process is continued until2shows a reasonable convergence. It may be noted that the cut-off distance set for eachgijðrÞis closer than the direct contact value of two particles, in order to prevent atoms coming un-physically close to one another.
3. Experimental
An alloy ingot with the nominal composition of Zr50Cu50 was prepared by conventional arc melting from a mixture of pure Zr (>99:9%) and Cu (>99:99%) in a purified Ar
Fig. 1 Energy dependence of the anomalous dispersion terms for isolated Cu and Zr near theirKabsorption edges, as calculated by the relativistic Cromer and Liberman method.17)
[image:2.595.62.278.71.270.2]atmosphere. Zr50Cu50 amorphous ribbon samples with a thickness of about 20mmand a width of 2 mm were produced by the single-roller melt-spinning technique in an Ar atmo-sphere. The density of the amorphous ribbon sample measured by Archimedes’ method was 7.36 Mg/m3. The obtained ribbons were cut into small pieces about 20 mm long, and then were closely arranged and fixed on an Al frame with a window about 20 mm wide and 15 mm high. AXS measurements at the CuK absorption edge and the ZrK absorption edge were carried out at the beam line stations 7C and NW10A of the Institute of Materials Structure Science, High Energy Accelerator Research Or-ganization, Tsukuba, Japan, respectively. A pair of incident energies corresponding to 25 eV and 300 eV below the Cu and ZrK absorption edges was used in the present AXS measurements, and the anomalous dispersion terms for Cu and Zr used in this work are listed in Table 1. It should be added that Si (111) and (311) double-crystal monochroma-tors are installed at the BL-7C and NW-10A stations, respectively.
The observed intensity was corrected for the absorption and fluorescent radiations and subsequently converted to electron units per atom by the generalized Krogh-Moe-Norman method.18) The Compton scattering effect was
corrected by using the theoretical values for a free atom with the so-called Breit-Dirac recoil factor.19) It may be
added that the atomic scattering factors, f0ðQÞ, used in this study were provided by International Tables for X-ray Crystallography.20)
As for the RMC iteration, we started with an initial model of 2,000 atoms (Zr: 1,000 and Cu: 1,000) with a body-centered cubic (BCC) arrangement in a cubic hyper-cell with a unit size ofL¼3:27nm. The number of atoms and the cell size were selected so that the model indicated the obtained chemical composition and the measured density value. Since the atoms do not approach one another inside the atomic diameter, the calculated RDFs should be zero in the small r region below the nearest neighbor peak. Therefore, the interference functions used in the RMC simulation include a correction considering the experimental uncertainty, so as to remove the spurious oscillations of the RDFs in the smallr region by the usual method.18,21)
4. Result and Discussion
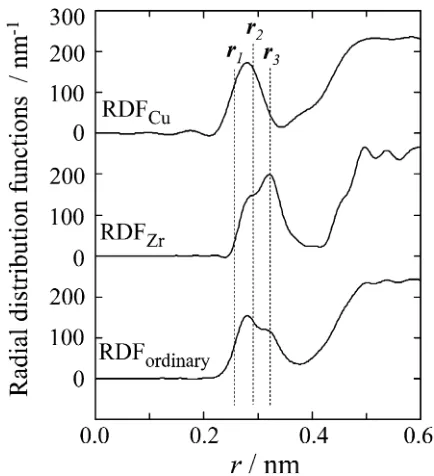
Figure 2 shows the ordinary radial distribution function (RDF) measured at E¼17:699keV (ZrK edge 300eV) and the environmental RDFs around Cu and Zr obtained by the present AXS measurements. The vertical dashed lines of r1,r2 andr3 in Fig. 2 indicate the atomic distances for the Cu-Cu, Cu-Zr and Zr-Zr pairs, respectively, estimated from
the well-organized Goldschmidt radii (Cu: 0.128 nm, Zr: 0.160 nm).22)The ordinary RDF indicates the existence of a nearest-neighbor correlation at 0.28 nm with a hump at the higher r side of the first peak. This feature in the ordinary RDF has been well reproduced in previous results.12,23)As explained in the previous section, the environmental RDF around Cu is the sum of the partial RDFs of Zr and Cu-Cu, and the environmental RDF around Zr is the sum of the partial RDFs of Zr-Cu and Zr-Zr. The correlation peak at around r3 (Zr-Zr) disappears in the environmental RDF around Cu, which indicates that the present AXS measure-ment for Cu worked well. The situation is similar in the case of Zr, where the correlation peak at aroundr1 (Cu-Cu) could not be observed in the environmental RDF around Zr. The environmental RDF around Zr indicates that the observed interatomic distance for the Zr-Cu pair appears to less than that estimated from the Goldschmidt radii. However, a detailed discussion requires the structural infor-mation on the partial distribution function for the Zr-Cu pair, and this requires further AXS-RMC modeling with the experimental constraints of the three interference functions IðQ;17:699keVÞ,iCuðQ;E1;E2ÞandiZrðQ;E1;E2Þ.
The present RMC simulation results are found to repro-duce the three independent interference functionsQiCuðQÞ,
QiZrðQÞ and QiðQÞ, as shown in Fig. 3. This agreement
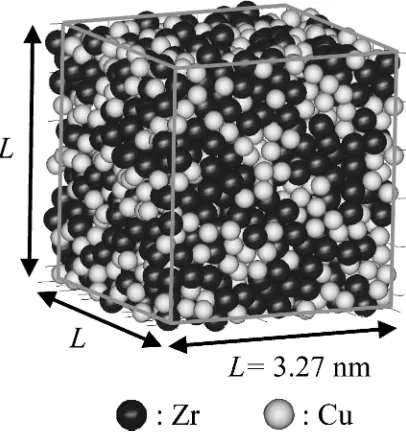
clearly indicates that the present approach works well, considering the many factors which can produce experimen-tal errors. Nevertheless, it should be kept in mind that this RMC technique is not the only possible mathematical procedure, and that the partial structure factors and corre-sponding partial distribution functions estimated from the present AXS-RMC analysis are necessary conditions at best, and not sufficient conditions. The final atomic configuration for Zr50Cu50 amorphous sample is also shown in Fig. 4.
[image:3.595.317.534.69.307.2]Figure 5 shows the resultant partial pair distribution functions, gijðrÞ, of Zr50Cu50 amorphous alloy. The three
Table 1 Anomalous dispersion terms,f0ðEÞandf00ðEÞ, used in the present
AXS measurements.
Energy f0
Zr f00Zr f0Cu f00Cu CuKedge25eV (8.955 keV) 0:472 1.861 5:634 0.485 CuKedge300eV (8.680 keV) 0:427 1.967 3:067 0.513 ZrKedge25eV (17.974 keV) 6:035 0.532 0.270 1.205 Zr K edge300eV (17.699 keV) 3:600 0.547 0.267 1.238
[image:3.595.45.291.93.159.2]partial pair distribution functions gCuCuðrÞ, gCuZrðrÞ and
gZrZrðrÞ give the first peaks at 0.264 nm, 0.282 nm and
0.319 nm, respectively. The observed value of Zr-Cu is less than the value (0.288 nm) estimated from the Goldschmidt radii, and this may correspond to negative heat mixing for this atomic pair, suggesting the preferred atomic pair bonding of unlike atoms with strong interaction. One the other hand, the distances for like pairs, Zr-Zr and Cu-Cu, are almost
equal and longer than those (0.320 nm for Zr-Zr and 0.256 nm for Cu-Cu) estimated from the Goldschmidt radii. The partial pair distribution gCuCuðrÞ gives the first sharp peak at
0.264 nm, followed by a second maximum at about 0.43 nm with a hump and a third rather broad maximum at about 0.67 nm. Similar oscillation behavior can be observed in the partial pair distributiongZrZrðrÞ, although the positions for the
three peaks are shifted toward the higherrregion, and that for the partial pair distribution gCuZrðrÞ indicates peaks just
between the corresponding ones in gCuCuðrÞ and gZrZrðrÞ.
These features of the partial giiðrÞ functions were well realized in previous results,9,12,24)and this phase lag related to the partial pairs produces a unique chemically oscillatory shell structure around each atom. In order to clarify this unique shell structure, the coordination numbers and aver-aged atomic distances up to 0.84 nm were calculated from the structural model obtained by the present RMC simulation, and are summarized in Table 2. In the first neighbor region up to 0.36 nm, the near-neighbor coordination of Zr is preferred around each atom, and the total coordination numbers around Cu and Zr are 11.4 and 13.4, respectively. These structural parameters for the nearest-neighbor region are similar to those given in previous reports,12,24) and are,
again, representative of the structural features of the nearest-neighbor region of Zr50Cu50 amorphous alloy. Nevertheless, the present authors stress the following point. The chemical oscillatory structure composed of Cu-rich shells (0.36– 0.48 nm, 0.60–0.72 nm) and Zr-rich shells (0.48–0.60 nm, 0.72–0.84 nm) can be readily specified in the longer-distance
Fig. 3 Ordinary interference function,QiðQÞ, and environmental interfer-ence functions,QiCuðQÞandQiZrðQÞ, of Zr50Cu50amorphous alloy.
The solid lines correspond to the experimental data. The dotted lines denote the values calculated by the RMC method.
Fig. 4 Final atomic configuration of Zr50Cu50amorphous alloy obtained
by the AXS-RMC method (Cu atoms: white spheres, Zr atoms: black spheres).
Fig. 5 Three partialgiiðrÞfunctions for Zr50Cu50amorphous alloy obtained
by the AXS-RMC method. The Zr- and Cu-rich regions are hatched.
[image:4.595.63.276.68.335.2] [image:4.595.319.532.71.395.2] [image:4.595.67.270.414.630.2]regions, as shown in Fig. 6. The presence of this shell structure is suggested to be one of the characteristic structural features in the middle-range structure of Zr50Cu50amorphous alloy.
Voronoi analysis is one of the most useful methods of elucidating the topology of local atomic arrangements in a disordered system, and many research groups employ this analytical tool to gain an understanding of atomic config-urations.6–8,24,25) The Voronoi polyhedron for an atom
[image:5.595.52.551.105.172.2] [image:5.595.50.285.187.330.2]contains the space that is closer to the center of the atom than to any other atom. Each Voronoi polyhedron around a center atom can be specified by a set of Voronoi index, (niÞ ¼ ðn3;n4;n5;n6;n7;. . .), whereniis the number of the i-edged face of a Voronoi polyhedron. As is often discussed in the Voronoi analysis of metallic glasses, a large number of different Voronoi polyhedra are specified in the estimated atomic configuration. Therefore, the relative frequencies of the Voronoi indices around Cu and Zr are summarized in Table 3.
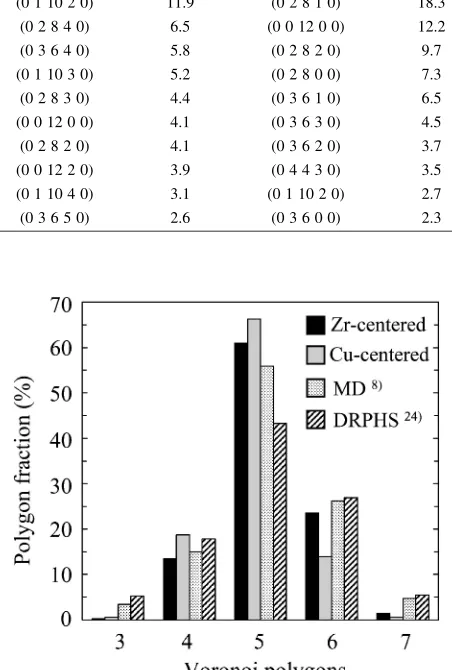
The ideal icosahedron (0,0,12,0,0) is only one of the many different polyhedra, and the corresponding fractions for the Cu- and Zr-centered icosahedra are 12.2 and 4.1%, respec-tively. The frequency of the ideal icosahedra around Cu is much larger than that around Zr, and this result is readily explained by considering the ratio, R, of the size of the
center atom to the averaged size of its first nearest neighbors. As shown in Table 2, the averaged first nearest-neighbor environments are Cu5:2Zr6:2for Cu and Cu6:2Zr7:2for Zr, and the calculated R values for Cu and Zr are 0.88 and 1.10,
respectively, where the average environment around Cu is much closer to the value ofR¼0:90, the ideal icosahedral arrangement. Although icosahedron-like local structural units, such as (0,0,12,0,0), (0,2,8,2,0) and (0,3,6,3,0), are
usually found in the present model, it appears not to be feasible to discuss general structural features by using fractions of these icosahedron-like polyhedra. In this context, the distribution of Voronoi polygons obtained by the present analysis is employed as a useful structural feature for the nearest-neighbor region.6,8,25) Figure 7 shows the frequency distribution of the Voronoi polygons calculated from the present AXS-RMC analysis of Zr50Cu50 amorphous alloy together with those obtained by the MD simulation8)and the dense random packing of hard spheres (DRPHS) model.24)
Fig. 6 Schematic model of the chemical oscillatory structure of Zr50Cu50
[image:5.595.304.548.223.381.2] [image:5.595.313.539.266.601.2]amorphous alloy. The Zr- and Cu-rich regions are indicated by gray and dotted shells, respectively.
Table 3 Frequency distribution of typical Voronoi polyhedra found in the structural model of Zr50Cu50amorphous alloy.
Zr-centered Cu-centered
Voronoi polyhedron Frequency
(%) Voronoi polyhedron
Frequency (%)
(0 1 10 2 0) 11.9 (0 2 8 1 0) 18.3 (0 2 8 4 0) 6.5 (0 0 12 0 0) 12.2 (0 3 6 4 0) 5.8 (0 2 8 2 0) 9.7 (0 1 10 3 0) 5.2 (0 2 8 0 0) 7.3 (0 2 8 3 0) 4.4 (0 3 6 1 0) 6.5 (0 0 12 0 0) 4.1 (0 3 6 3 0) 4.5 (0 2 8 2 0) 4.1 (0 3 6 2 0) 3.7 (0 0 12 2 0) 3.9 (0 4 4 3 0) 3.5 (0 1 10 4 0) 3.1 (0 1 10 2 0) 2.7 (0 3 6 5 0) 2.6 (0 3 6 0 0) 2.3
Fig. 7 Frequency distribution of Voronoi polygons for Zr50Cu50
amor-phous alloy. Those of the MD simulation and the DRPHS results are also given in this figure.8,24)
Table 2 Coordination numbers,N, and averaged atomic distance,r, of the first nearest-neighbor region (up to 0.36 nm), Cu-rich region (0.36–0.48 nm, 0.60–0.72 nm) and Zr-rich region (0.48–0.60 nm, 0.72–0.84 nm), as calculated from the structural model obtained by the present AXS-RMC modeling.
0–0.36 nm 0.36–0.48 nm 0.48–0.60 nm 0.60–0.72 nm 0.72–0.84 nm
N r/nm N r/nm N r/nm N r/nm N r/nm
Zr-Zr 7.2 0.316 4.0 0.442 15.5 0.541 17.1 0.663 29.3 0.781
Zr-Cu 6.2 0.290 6.6 0.441 14.8 0.540 18.1 0.668 28.0 0.781
Pentagons are dominant, and a rather monotonic behavior in the distribution of polygons was evident in all cases. These findings readily suggest that the local atomic arrangement of Zr50Cu50 amorphous alloy gives no particular sign of a distinct cluster or a structural unit of competing crystalline phases in the Zr-Cu binary alloy system, and that the structural features are well approximated by ordinary DRPHS models. As an example, the Voronoi index around Cu and Zr in the ordinary BCC structure is (0,6,0,8,0), and no such Voronoi polyhedron could be found in the present AXS-RMC analysis of Zr50Cu50 amorphous alloy. It should be added that the averaged fractions for (0,0,12,0,0) and (0,2,8,2,0) are a little larger than those obtained within the DRPHS model and similar to those estimated by molecular dynamic (MD) simulation, in particular.8,24)This finding also supports the idea of the usefulness of the MD method in conjunction with suitable potential parameters for estimating the probability of local structural units.
5. Concluding Remarks
An environmental AXS analysis coupled with RMC simulation was carried out for Zr50Cu50 amorphous alloy. The Voronoi analysis for the nearest-neighbor region revealed that the distribution of Voronoi polyhedra in Zr50Cu50 amorphous alloy has an overall preference for the pentagonal polygons found in the dense random packing of hard spheres (DRPHS) model. This characteristic feature in the nearest-neighbor region could not be found in the crystalline phases, and is suggested to be a very important atomic arrangement for stabilizing the amorphous struc-ture.6–8,24,25)Additionally, the chemical oscillatory structure
composed of alternating Cu-rich and Zr-rich coordination shells can be proposed as an example of middle-range ordering. The structural information on Zr50Cu50amorphous alloy obtained in this work represents a first and reliable step toward uncovering the direct link between the atomic-scale structure and the characteristic properties of amorphous alloys. It would be interesting to apply the present AXS-RMC analysis in the investigation of the composition dependence of the atomic structure of the Zr-Cu and Zr-Ni binary alloy systems.
Acknowledgments
The authors wish to express their gratitude to Professor M. Nomura, Institute of Materials Structure Science, High Energy Accelerator Research Organization, Tsukuba, Japan, for his help with the AXS measurements (Proposal
No. 2008G695). A part of this work was supported by a Grant-in-Aid for Scientific Research (B) (20340147) from the Japan Society for the Promotion of Science (JSPS) and Global COE Program ‘‘Materials Integration (International Center of Education and Research), Tohoku University’’, MEXT, Japan.
REFERENCES
1) A. Inoue and W. Zhang: Mater. Trans.45(2004) 584–587.
2) J. Das, M. B. Tang, K. B. Kim, R. Theissmann, F. Baier, W. H. Wang and J. Eckert: Phys. Rev. Lett.94(2005) 205501.
3) M. Chen, A. Inoue, W. Zhang and T. Sakurai: Phys. Rev. Lett.96
(2006) 245502.
4) T. Fujiwara, H. S. Chen and Y. Waseda: J. Phys. F13(1983) 97–102. 5) R. L. McGreevy and L. Pusztai: Mol. Simul.1(1988) 359–367. 6) X. D. Wang, S. Yin, Q. P. Cao and J. Z. Jiangb: Appl. Phys. Lett.92
(2008) 011902.
7) S.-C. Lee, C.-M. Lee, J.-C. Lee, H.-J. Kim, Y. Shibutani, E. Fleury and M. L. Falk: Appl. Phys. Lett.92(2008) 151906.
8) K. W. Park, J. I. Jang, M. Wakeda, Y. Shibutani and J. C. Lee: Scr. Mater.57(2007) 805–808.
9) P. Zetterstro¨m, R. Delaplane, Y. D. Wang, P. K. Liaw, H. Choo, K. Saksl, H. F. Zhang, Y. Ren and L. Zuo: J. Phys. Condens. Matter19
(2007) 376217.
10) J. E. Enderby, D. M. North and P. A. Egelstaff: Philos. Mag.14(1966) 961–970.
11) T. Kudo, T. Mizoguchi, N. Watanabe, N. Niimura, M. Misawa and K. Suzuki: J. Phys. Soc. Jpn.45(1978) 1773–1774.
12) H. S. Chen and Y. Waseda: Phys. Statas Solidi A51(1979) 593–599. 13) Y. Waseda: Anomalous X-ray Scattering for Materials
Character-ization, (Springer, Heidelberg, 2002).
14) M. Saito, C. Park, K. Omote, K. Sugiyama and Y. Waseda: J. Phys. Soc. Jpn.66(1997) 633–640.
15) M. Saito, C. Park, K. Sugiyama and Y. Waseda: J. Phys. Soc. Jpn.66
(1997) 3120–3126.
16) Y. Waseda, E. Matsubara and K. Sugiyama: Sci. Rep. Res. Inst. Tohoku University, Ser. A34(1988) pp. 1–14.
17) D. T. Cromer and D. Liberman: J. Chem. Phys.53(1970) 1891–1898. 18) C. N. J. Wagner, H. Ocken and M. L. Joshi: Z. Naturforsch. A20(1965)
325–335.
19) D. T. Cromer and J. B. Mann: J. Chem. Phys.47(1967) 1892–1983. 20) J. A. Ibers and W. C. Hamilton: International Tables for X-ray
Crystallography, Vol.IV, (Kynoch, Birmingham, 1974) p. 99. 21) R. Kaplow, S. L. Strong and B. L. Averbach: Phys. Rev.138(1965)
A1336–A1345.
22) E. A. Brandes and G. B. Brook:Smithells Metals Reference Book, 7th ed. (Elsevier Butterworth-Heinemann Ltd., London, 1992) pp. 4–41. 23) K. Georgarakis, A. R. Yavari, D. V. Louzguine-Luzgin, J. Antonowicz,
M. Stoica, Y. Li, M. Satta, A. LeMoulec, G. Vaughan and A. Inoue: Appl. Phys. Lett.94(2009) 191912.
24) N. Mattern, P. Jo´va´ri, I. Kaban, S. Gruner, A. Elsner, V. Kokotin, H. Franz, B. Beuneu and J. Eckert: J. Alloy. Compd. 485 (2009) 163–169.
25) T. Fukunaga, K. Ito, T. Otomo, K. Mori, M. Sugiyama, H. Kato, M. Hasegawa, A. Hirata, Y. Hirotsu and A. C. Hannon: Intermetallics14
(2006) 893–897.