Microstructure Refinement and Texture Evolution of Titanium
by Friction Roll Surface Processing
Meiqin Shi
1;*1, Yoshimasa Takayama
1;*2, Tomohiro Umetsu
1;*1,
Hajime Kato
1, Hideo Watanabe
1and Hirofumi Inoue
21Department of Mechanical and Intelligent Engineering, Graduate School of Engineering,
Utsunomiya University, Utsunomiya 321-8585, Japan
2Department of Materials Science, Graduate School of Engineering, Osaka Prefecture University, Sakai 599-8531, Japan
Friction roll surface processing (FRSP), as a novel severe plastic deformation technique, has been put forward and experimentally investigated. Commercial pure titanium sheets were subjected to FRSP and subsequent annealing. An extremely large strain was imposed on the surface layer of the sheet. Consequently, a uniform ultrafine-grained microstructure with a grain size of approximately 80 nm and a deformation texture were obtained in the surface layer. The FRSP texture was found to be strongly related to the processing direction. The evolution of texture during annealing was also investigated. The texture analysis revealed that new preferred orientations could be developed during FRSP. [doi:10.2320/matertrans.MER2008294]
(Received August 28, 2008; Accepted November 6, 2008; Published December 17, 2008)
Keywords: texture, titanium, severe plastic deformation, electron backscatter diffraction, friction roll surface processing
1. Introduction
Over the last decade, severe plastic deformation (SPD) has been successfully applied to fabricate ultrafine-grained (UFG) materials.1) Extensive investigations showed the prospect of variety of SPD techniques on the point of developing nanostructured materials.2) In addition, many mechanical and physical properties of crystals are aniso-tropic, and therefore the properties of a polycrystalline aggregate will depend on whether the individual grains or subgrains, which comprise the sample, are randomly oriented or tend to have some preferred crystallographic orientation.3)
Moreover, the preferred orientation often appeared as a consequence of deformation. This implies that preferred orientation is supposed to be formed on the metal by SPD. However, attention to this possibility of SPD technique, which is controlled by crystallographic orientation, has not been well directed. On the other hand, some of material properties, such as corrosion, formability and wear, are strongly related to the microstructure of surface layer. From this point of view, there has recently been more attention paid to the microstructure control on the surface layer of the material.
This study presents a new SPD technique named friction roll surface processing (FRSP). It has been found that FRSP and subsequent annealing have an excellent possibility for controlling both microstructure and texture in the surface layer of the materials. During FRSP, regarded as surface friction processing, a large amount of plastic strain is imposed into samples by the mechanical rolling action of a high speed rotating tool. As a result, not only grain refinement, but also formation of a crystallographic texture can be achieved.
2. Experimental Procedure
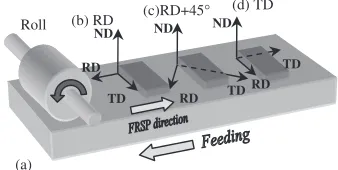
Commercial purity (CP) titanium sheet (grade 1) with an average grain size of 30mm, containing impurities (mass%) of 0.041 O, 0.002 N, 0.0024 H, 0.031 Fe and 0.009 C, was used as the starting material. Three types of samples, marked as RD, TD and RD+45 with size of 60mm20mm 1mm, were machined from the titanium sheet. FRSP was conducted with the processing direction parallel to the rolling direction (RD), transverse direction (TD) and the direction rotated by 45 degrees from RD to TD, respectively. The roll’s rotation direction, sample’s feeding direction, FRSP direc-tion and sample orientadirec-tions are sketched in Fig. 1. A fixed roll with a dimension of 7010mm and made of tool steel SK3, was rotated at 48 rpm. The indentation, defined as the depth at which the rotating roll was pressed down into the sample, was selected as 0.2 mm. The feeding speed of sample was set as 14 mm/min. FRSP was performed as follows: first, the interface where the roll and the sample just touched was located, and this was regarded as the reference plane at which the indentation was zero. Then, the roll was placed within the given indentation without contacting with the sample. After rotating the roll, the sample was moved forward until the
(a)
Roll (b) RD
ND
RD
TD
(d) TD
ND
TD RD ND
RD
(c)RD+45°
TD
Fig. 1 Schematic illustration of Friction Roll Surface Processing: (a) Indication of roll, feeding direction and FRSP direction; Configuration and name of the samples, (b) RD sample, (c) RD+45 sample and (d) TD sample.
*1Graduate Student, Utsunomiya University
*2Corresponding author, E-mail: [email protected]
[image:1.595.341.510.651.736.2]entire surface was treated. This procedure resulted in making the working plane lower than the reference plane and led to a great amount of friction. After FRSP, the samples were annealed at 823 K for 1 h in Ar gas and air cooled to study the texture evolution.
The imposed strain was examined on the ND-RD plane of RD sample (i.e.normal direction (ND)-rolling direction (RD) plane). The microstructure of FRSPed sample was observed by using optical microscopy and transmission electron microscopy (TEM). Global textures were measured as incomplete pole figures for (0002) and (10110) diffraction planes using CuK radiation X-ray diffraction (XRD) to reveal the textures of deformed materials. Evolutions of crystallographic texture of the titanium samples, after FRSP and annealing, were then evaluated using a scanning electron microscope/electron back scatter diffraction pattern tech-nique (SEM/EBSD; HITACHI S-3500H, TSL Orientation Image Microscopy system) after electropolishing. In order to depict the gradient of microstructure and texture through the thickness, the cross sections (i.e.ND-TD plane of RD sample or ND-RD plane of TD sample) were scanned continuously every 200mm from the processed surface to center part using a step size of 1mm.
3. Results and Discussion
3.1 Strain distribution
For the purpose of evaluating the strain distribution through the thickness of the FRSPed samples, shear strain measurements were carried out using the embedded-pin method.4) A cylinder-shaped pin of 2 mm in diameter and
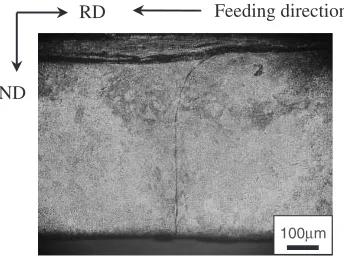
1 mm in thickness and made of the same material, was embedded at the center of the sample. The pin was supposed to be deformed to the same extent as the whole sample. After FRSP, the longitudinal plane (i.e. ND-RD plane of RD sample) of the pin was observed by optical microscopy and strain was calculated using the bent line of pin-matrix interface according to the definition of shear strain. An example of the result is displayed in Fig. 2 and listed in Table 1. This optical micrograph of pin-matrix interface reveals that FRSP generates large plastic strain that can reach about 100mm beneath the surface. These strains fall off rapidly through the thickness and give a strain gradient dependence based on depth. It was very difficult to measure
the strain just on the surface because the pin-matrix interface could not be distinguished in the vicinity of the surface. The strain of 9.35 measured on the surface should be regarded as the distinguishable maximum value, that is, an underesti-mated one. Therefore, the strain imposed by FRSP is probably much higher than a strain of about 1 by one pass of the other SPD techniques for bulk materials such as ECAP5)or ARB.6)
3.2 Refined microstructure
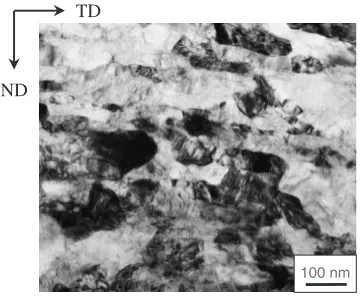
The optical micrograph on the ND-TD plane of the TD sample after FRSP is shown in Fig. 3. Material flow corresponding to the strain gradient appears evident in the vicinity of the surface. Different deformation modes7,8) are observed depending on the distance from the processed surface. In the surface layer, to a depth of about 50mm, lamellar microstructures with an inclination about 20–25to TD are found to be proof of the material flow. In the second layer, from a depth of 50mm to 200mm from the surface, there are many deformation twins are formed, which implies a low strain of deformation. In rolled titanium deformation twinning was found in all grains at a very early stage.9)The
absence of additional twinning during the large deformation of titanium has been discussed as being the result of the reduced grain size introduced by prior twinning.7) For the
center layer, equiaxed grains without twinning are observed. This heterogeneous microstructure through thickness of sample is consistent with the strain gradient formed after FRSP displayed in Fig. 2. Similar result was found during the general cold rolling. Twin was observed in some grains of the titanium sheet after 30% cold rolling. Additional cold-rolling led to the fragmentation of lamellae as a result of slip 100µm
Feeding direction
ND
RD
[image:2.595.304.549.84.158.2]Fig. 2 Optical micrograph of pin-matrix interface in the titanium sheet processed after FRSP.
Table 1 Shear strain through the thickness.
Distance from
surface ¼tan
0 9.35
50mm 1.12
100mm 0.95
200mm 0.30
ND
TD Feeding direction
50µm
[image:2.595.311.537.88.359.2] [image:2.595.82.254.629.758.2]activity and multiple twinning.10,11)TEM observation taken
in the surface layer is provided in Fig. 4 to illustrate the elongated nanostructures with 110 nm in TD and 50 nm in ND. The microstructure in this zone is fragmented down to the sub-micrometer scale due to the severe strain. Grain boundaries are well discerned and a high density of dislocation can be observed within individual grains. These lamellar structures and accumulated dislocations were observed in other heavily deformed materials processed by different SPD technique such as ECAP and ARB. However, the formation mechanism of the UFG materials during SPD is still an issue under discussion.12) On the other hand, sliding friction under a large load is especially effective for the formation of surface nanocrystallization, since it can cause a large shear stress, which is a necessary condition for the generation of severe plastic deformation. The nano-crystalline material was generated by processes similar to those involved in the early stages of mechanical alloying, commonly done in a high energy ball mill.13) It can be
suggested that during FRSP without lubrication a large amount of shear strain, owing to large friction between the roll and the sample, was introduced in the surface region. The grains became sheared resulting in an oblate grain structure with the long axis of grain inclined to the FRSP direction. Moreover, grain fragmentation set in14) and the
grain subdivision continued to refine with the increase of strain. This process led to the formation of new ultra-fined grains.
3.3 Texture evolution 3.3.1 Deformation texture
The normalized pole figures of the as received sample, RD and TD samples after FRSP measured by XRD are presented in Fig. 5. As displayed in Fig. 5(a), (0001) pole figure of the as received one indicates that the basal poles are tilted 3040 away from the ND toward the TD, thereby
exhibiting a TD-split texture (f112114gh10110iorf02255gh211110i (frolling planeghrolling directioni)) that is commonly ob-served in rolled titanium sheets after annealing. After FRSP, the (0001) pole figure of the RD sample shows that the intensity of (0001) pole spreads out between ND and TD in Fig. 5(b). The initial TD-split texture is extended from the basal texture component to higher tilted angle. In addition, the peak is also concentrated with a spread angle about TD ranging from13to +13for the as received one, while for
the RD sample after FRSP, a spread angle ranging from9
to +9about TD. It is also worth mentioning that noth10110i,
but nearh11220i, is aligned along RD in the (10110) pole figure of the RD sample (Fig. 5(b)). This is different from the texture withh10110iparallel to RD, which is well known for titanium subjected to cold-rolling.10) Thus, FRSP has a different deformation mechanism from general cold-rolling and this is possibly due to the severe shear strain imposed during FRSP. Figure 5(c) describes the main textures in the TD sample after FRSP. It is interesting to note that the resulting texture in the TD sample has the same feature as that of the RD sample except that it was rotated 90about ND
from RD to TD. Therefore, the characteristic texture was formed in the sample by FRSP, and the new FRSP texture was strongly related to the processing direction.
3.3.2 Annealing texture
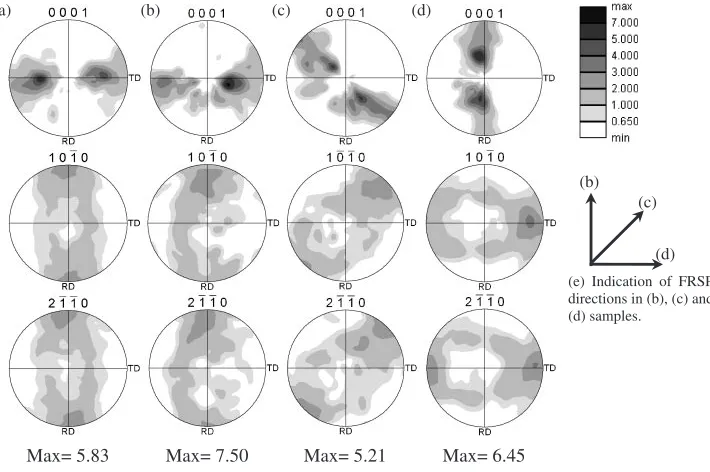
Figure 6 shows (0001), (10110) and (211110) pole figures obtained from EBSD data of RD, RD+45 and TD samples
annealed at 823 K for 1 h after FRSP. The as received sample is also presented for comparison. Analyzed ranges of RD, RD+45and the TD samples were set in the processed
100 nm
ND
TD
Fig. 4 TEM bright-field micrograph of RD sample after FRSP.
(a) As received sample (b) RD sample (c) TD sample
(0001)
(1010)
[image:3.595.79.259.73.221.2] [image:3.595.176.421.591.759.2]surface regions with 50mmthick in ND while the range of as received sample was a whole thickness of 1000mmin ND. As displayed in Fig. 6(a), (0001) pole figure of the as received one shows a typical TD-split texture, which is consistent with the XRD analysis (Fig. 5(a)). Pole figures of RD, RD+45and TD samples present distinct textures after FRSP and following annealing. Figure 6(b) displays a similar texture to the as received one in the RD sample. However, the basal pole density that was observed around ND in deformed state (Fig. 5(b)) disappears after annealing. In the TD sample shown in Fig. 6(d), the original TD-split texture in the as received one is completely replaced by RD-split texture rotated 90 about ND and the basal poles are
tilted 20–30 away from the ND toward the RD. This
emerging texture had a similar maximum intensity to that of the TD-split in the as received one. Dependence of textural evolution on FRSP direction was confirmed by the result in the case of RD+45 sample (Fig. 6(c)). A resultant texture
was rotated 45 about the normal axis compared with RD sample. Compared with the as received one, the peaks shifted along FRSP direction are found in (10110) pole figures of RD, RD+45and TD samples. This might suggest
that FRSP is a unidirectional process and the annealing texture corresponds with deformation texture (Fig. 5). These results indicate that FRSP and subsequent annealing can form a split texture reoriented on the sides of the FRSP direction. The formation of preferred orientations was already reported in various metals after sliding.15–18)
Considerable plastic deformation was produced by friction forces in the surface layers of metallic objects. This caused a preferred orientation of the crystallites in a particular direction with a large amount of strain. However, the stability and component of textures were different according to the metals, and the mechanism of texture formation was not given or clearly explained. Heilmannet al.18)explained that the special orientation was the result of the rotation of
the lattice. This rotation is about the transverse axis normal to the sliding direction and parallel to the sliding interface. After FRSP and following annealing, the distinguished changes of textures in the surface layer of RD+45 and TD
samples suggest that FRSP produces the deformation texture along the FRSP direction in the surface layer of samples irrespective of initial texture. This can be possibly attributed to three slip systems in titanium, which are f10110gh11220i, f0001gh11220iandf11101gh11220i. During FRSP, shear stress between the roll and sample is the main cause of slips on the planes. The slip direction h11220i was always parallel to the shear direction,i.e.FRSP direction, in RD, RD+45and
TD samples, as displayed in (211110) pole figures shown in Fig. 6(b), (c) and (d). It is well known that in titanium, the critical resolved shear stress for prismatic slip is lower than those for basal and pyramidal slip at room temperature. In the case of deformation by rolling, not only prismatic, but also basal and pyramidal slip should be active.19)Therefore, FRSP, which gives an extremely large strain, probably develops a ‘‘h11220ishear texture’’ due to the activation of all the three slip systems in the progress.
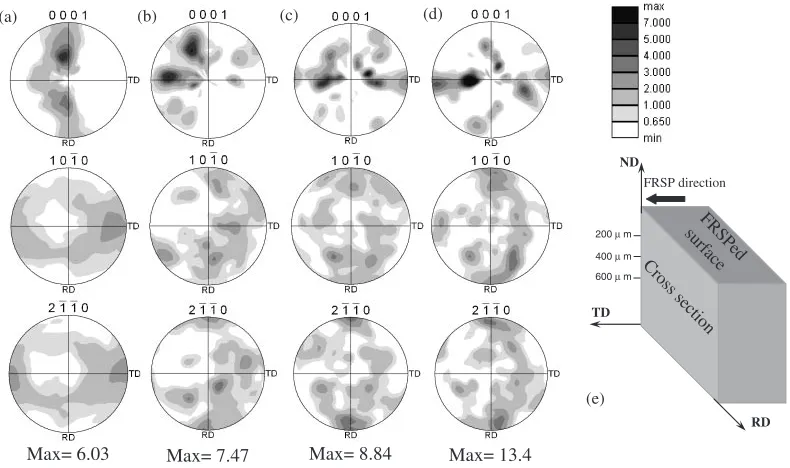
In order to explore the effect of the strain gradient on the texture evolution through the thickness, pole figures in each 200mmlayer of TD sample were also analyzed as displayed in Fig. 7. Textures in TD samples vary remarkably depend-ing on the distance from the processed surface. In the surface layer, the symmetric peaks of RD-split texture were conspicuously observed, whereas the center region without deformation by FRSP showed a high intensity of TD-split texture. The layer from 100mmto 400mmcould be regarded as a transient region where a newly formed mixed texture coexisted with the initial one. The severe strain gradually decreased from the surface to the center of the sample, and different deformation modes were adopted to accommodate to the different level of strain. The experimental texture gradient is well consistent with these findings.
Max= 5.83 Max= 7.50 Max= 6.45
(a)
Max= 5.21
(b) (c) (d)
(b) (c)
(d)
(e) Indication of FRSP directions in (b), (c) and (d) samples.
[image:4.595.121.476.73.309.2]4. Conclusions
In summary, during FRSP, a large plastic strain was imposed in the surface layer and caused grain refinement to form the nanostructured material. The deformation mode was different depending on the amount of induced strain and developed a corresponding texture gradient. Characteristic textures were formed in the surface of sample during FRSP and subsequent annealing. The FRSP texture was strongly related to the processing direction. After annealing the preferred orientation remained distinct. These preliminary studies have shown that FRSP was a process that allowed efficient control of not only microstructure, but also texture in the surface layer. This study provided a deeper understanding of the evolution of structure and texture during severe plastic straining.
REFERENCES
1) R. Z. Valiev: Nature Mater.3(2004) 511–516.
2) Y. T. Zhu, T. C. Lowe and T. G. Langdon: Scr. Mater.51(2004) 825– 830.
3) F. J. Humphreys and M. Hatherly: Recrystallization and Related Annealing Phenomena, (Pergamon Press, Oxford, 2004) pp. 67–79. 4) N. Kamikawa, T. Sakai and N. Tsuji: Acta Mater.55(2007) 5873–
5888.
5) Y. Iwahashi, J. Wang, Z. Horita, M. Nemoto and T. G. Langdon: Scr. Mater.35(1996) 143.
6) Y. Saito, N. Tsuji, H. Utsunomiya and S. Tanigawa: Scr. Mater.39 (1998) 1221.
7) Y. B. Chun, S. H. Yu, S. L. Semiatin and S. K. Hwang: Mater. Sci. Eng. A398(2005) 209–219.
8) Akhtar: Metall. Tran. A6(1975) 1105–1113.
9) F. J. Humphreys and M. Hatherly: Recrystallization and Related Annealing Phenomena, (Pergamon Press, Oxford, 2004) pp. 39–40. 10) N. Bozzolo, N. Dewobroto, H. R. Wenk and F. Wagner: J. Mater. Sci.
42(2007) 2405–2416.
11) N. Bozzolo and F. Wagner: Proc. ICOTOM15 Ed. By A. D. Rollett, (The American Ceramic Society, Pittsburgh, 2008) Symposium 9: Hexagonal Metals on CD.
12) R. Z. Valiev, M. J. Zehetbauer, Y. Estrin, H. W. Hoppel, Y. Ivanisenko, H. Hahn, G. Wilde, H. J. Roven, X. Sauvage and T. G. Langdon: Adv. Eng. Mater.9(2007) 527–533.
13) D. A. Rigney, X. Y. Fu, J. E. Hammerberg, B. L. Holian and M. L. Falk: Scr. Mater.49(2003) 977–983.
14) I. J. Beyerlein, R. A. Lebensohn and C. N. Tome: Mater. Sci. Eng. A 345(2003) 122–138.
15) H. Krause and A. H. Demirci: Wear61(1980) 325–332. 16) H. Krause and E. Ocalan: Wear108(1986) 337–342. 17) Z. N. Farhat: Wear250(2001) 401–408.
18) P. Heilmann, W. A. T. Clark and D. A. Rigney: Acta Metall.31(1983) 1293–1305.
19) H. Inoue and N. Inakazu: Proc. ICOTOM8 Ed. By J. S. Kallend and G. Gottstein, (The Metallurgical Society, Warrendale, 1988) pp. 997– 1004.
(a) (b) (c) (d)
RD ND
TD
Cross section
200 µ m 400 µ m 600 µ m
FRSPed surface FRSP direction
(e)
Max= 6.03 Max= 7.47 Max= 8.84 Max= 13.4
[image:5.595.101.496.72.306.2]