Frequency of Bubble Formation from a Multi-Hole Nozzle
Attached to a Top Lance
Hirofumi Ooyabu
1, Akira Hiratsuka
2, Ryoji Tsujino
3and Manabu Iguchi
11
Graduate School of Engineering, Hokkaido University, Sapporo 060-8628, Japan
2Faculty of Engineering, Osaka Sangyo University, Daito 574-8530, Japan 3Faculty of Engineering, Setsunan University, Neyagawa 572-8508, Japan
Water model experiments have been carried out to understand the bubble formation from a multi-hole nozzle attached to an immersion top lance in the pretreatment process for sulfur. The number of holes is varied from one to four. Although desulfurization agents such as CaO particles are injected into the reactor together with carrier gas in the real process, only gas is injected, in this study, into a water bath through the holes in the horizontal direction. Three types of bubble formation patterns are observed depending on the gas flow rate: synchronized, partly-synchronized, and non-synchronized bubble formation patterns. The frequency of bubble formation at each nozzle is measured with a high-speed camera. An empirical equation is proposed for the frequency of bubble formation as a function of the number of holes, inner diameter of hole, and the physical properties of fluids. [doi:10.2320/matertrans.M2009091]
(Received March 12, 2009; Accepted April 27, 2009; Published June 25, 2009)
Keywords: water model, bubble, multi-hole nozzle, powder injection, top lance
1. Introduction
Various types of gas injection systems are used in the current metals refining processes: bottom gas injection, lateral gas injection, and top lance gas injection. In these processes information on the frequency of bubble formation is of essential importance because the number of bubbles generated in the reactor in one second is closely associated with the circulation velocity of molten metal due to the gas-lift pump effect, the metallurgical reaction efficiency, and the
removal of non-metallic inclusions.1–7)
Many efforts have been devoted to understand the frequency of bubble formation. Unfortunately, most of them are concerned with the frequency of bubble formation from
a single-hole nozzle.1–7) Data on the frequency of bubble
formation from a multi-hole nozzle are very limited except
for those obtained in a previous paper of the present authors.8)
Accordingly, particular attention is given in this study on the bubble formation patterns from a multi-hole nozzle in top lance gas injection. This information is useful for enhancing the efficiency of the metals refining processes.
As described in the previous paper8)in detail, dispersion of
fine particles into the molten metal bath is greatly responsible for the efficiency of the steel refining processes such as
the desulfurization process.1–3) The particles are commonly
injected into the bath with carrier gas. In a strict sense, the penetration depth of particles in the reactor is affected by the interaction between the particle and the carrier gas. The penetration depth is mainly governed by the behavior of gas issuing out of the hole (or holes) settled on the side wall of the nozzle. Accordingly, as a first step of this research series,
only gas was injected into a water bath.8)The number of holes
was kept two. The number of bubbles generated from the two-hole nozzle was much greater than that from a one-hole nozzle at any gas flow rate. This result means that the total interfacial area between molten iron and carrier gas is highly increased by increasing the number of holes. As a result, the metallurgical reaction between the particle and sulfur con-tained in the molten iron also is expected to be enhanced.
Considering these circumstances, the number of holes was increased in this study up to four. The behavior of bubbles generated at each hole was observed with a high-speed camera and the bubble formation pattern was classified. An empirical equation for the frequency of bubble formation was proposed as a function of the operation parameters and the physical properties of fluids.
2. Experimental Apparatus and Procedure
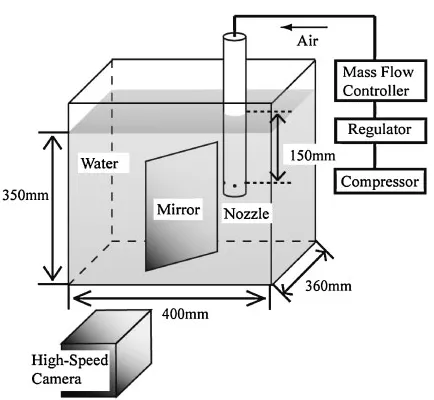
Figure 1 shows a schematic diagram of the experimental apparatus. Although we are planning to attach a nozzle with multi-holes to the top lance in the real desulfurization process, the top lance is not shown in Fig. 1 in order to avoid crowding in the figure. The test vessel had a cross-section of
360mm400mm and a height of 440 mm. Air was supplied
with a compressor and injected into a water bath through an
immersion lance. The flow rate of air, Qg, was controlled
with a mass flow controller. A nozzle having four holes on its Fig. 1 Schematic of experimental apparatus.
Materials Transactions, Vol. 50, No. 7 (2009) pp. 1812 to 1819
[image:1.595.319.536.320.520.2]side wall was attached to the lance. They are placed on the
same perimeter at equal intervals of 90, as shown in Fig. 2.
The inner diameters of the four holes are the same. The nozzle was made of brass pipe and its bottom was closed with a bolt. The brass pipe was wetted by water. The inner
diameter, Di, of the nozzle and the inner diameter of the
hole, dni, are shown in Fig. 3. The outer diameter of the
nozzle was kept at 12.7 mm.
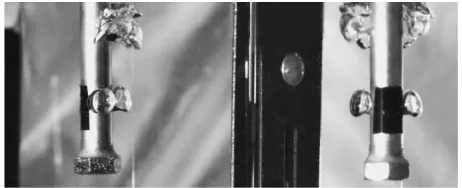
The behavior of bubbles successively generated at each exit of the holes was observed with a high-speed camera at 630 fps. A mirror was placed in the bath to observe the bubble formation from the rear hole, as shown in Fig. 4 in detail.
The gas flow rate,Qg, was varied from 5 cm3/s to 90 cm3/s.
Measurements of the frequency of bubble formation were repeated three times under every experimental condition.
3. Experimental Results and Discussion
3.1 Classification of bubble formation pattern
In the previous investigation8) two types of bubble
formation patterns were observed for a two-hole nozzle: synchronized and non-synchronized bubble formation pat-terns. In the former pattern bubbles were simultaneously
generated at the two holes and they rose at nearly the same rise velocity, as shown in Fig. 5. On the other hand, in the latter pattern bubbles were generated alternatively at the two holes.
A synchronization ratio,Rsyn, was introduced to describe
the transition of bubble formation pattern.
Rsyn¼100ns=nt ð1Þ
wherensis the number of bubbles generated simultaneously
at two holes and nt is the total number of bubbles in a
predetermined time. When bubbles are simultaneously
generated, Rsyn is defined to have a value of 100. On the
other hand, when bubbles are alternately generated all the
time, Rsyn is defined to have a value of zero. It should be
Fig. 2 Hole position.
Fig. 3 Details of nozzle.
Fig. 4 Real and mirror images.
[image:2.595.306.542.70.325.2] [image:2.595.66.274.70.478.2] [image:2.595.319.534.367.567.2]noted that Rsyn was used in this study in place of the
previously used symbol,n, in order to avoid confusion with
the index of an empirical equation for the frequency of
bubble formation.8)
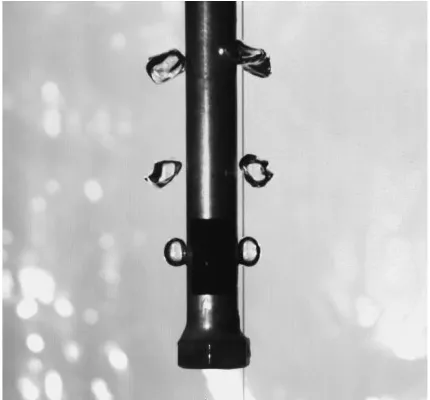
The same synchronized bubble formation pattern was observed in this study for a three-hole nozzle (see Fig. 6) and a four-hole nozzle (see Fig. 7). Concerning the four-hole
nozzle, 4 are added to ns only when bubbles are
simulta-neously generated from the four holes, otherwise ns is not
increased.
In the case of four-hole nozzle, bubbles were generated simultaneously from two holes placed on the opposite sides, as shown in Fig. 8. This type was observed at the first time and named the partly-synchronized bubble formation pattern.
It should be noted thatRsyn is zero in this case.
Figures 9 through 12 show the synchronization ratio,Rsyn,
for inner hole diameters of 1 mm, 2 mm, 3 mm, and 4 mm,
respectively. In Figs. 11 and 12 Rsyn increased with an
increase in the gas flow rate, Qg, reached 100 and then
decreased. However,Rsyn never became zero after showing
100 in the higher gas flow rate regime. The measured values
ofRsynforNn¼2and 3 in Figs. 9 and 10 also increased with
Qg in the gas flow rate regime below 5 cm3/s. The data
Fig. 6 Synchronized bubble formation (Nn¼3, dni¼3:0mm, Qg¼ 40cm3/s).
Fig. 7 Synchronized bubble formation (Nn¼4, dni¼4:0mm, Qg¼ 40cm3/s).
Fig. 8 Partly-synchronized bubble formation (Nn¼4, dni¼4:0mm,
Qg¼20cm3/s).
0 20 40 60 80 100
0 20 40 60 80 100
Gas flow rate, Qg / cm 3
s-1
Synchronization ratio,
Rsyn
/ % dni = 1.0mm
Nn=2 Nn=3 Nn=4
Fig. 9 Synchronized bubbling ratio (dni¼1:0mm).
0 20 40 60 80 100
0 20 40 60 80 100
dni = 2.0mm
Nn=2 Nn=3 Nn=4
Synchronization ratio,
Rsyn
/ %
Gas flow rate, Qg / cm 3
[image:3.595.53.284.72.166.2]s-1
Fig. 10 Synchronized bubbling ratio (dni¼2:0mm).
0 20 40 60 80 100
0 20 40 60 80 100
dni = 3.0mm
Nn=2 Nn=3 Nn=4
Synchronization ratio,
Rsyn
/ %
Gas flow rate, Qg / cm 3
s-1
[image:3.595.327.524.75.249.2] [image:3.595.55.285.220.339.2] [image:3.595.54.284.394.511.2] [image:3.595.326.523.522.696.2]however were not plotted in these figures due to poor accuracy of the mass flow controller in this gas flow rate regime.
3.2 Bubble formation pattern map
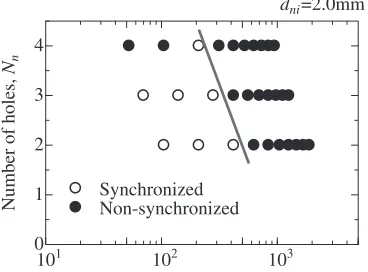
Figures 13 through 16 show the bubble formation pattern
map for multi-hole nozzles ofdniof 1 mm, 2 mm, 3 mm, and
4 mm, respectively as a function of the number of holes,Nn,
and the following Reynolds number,Ren.
Ren¼4Qg=ðgdniNnÞ ð2Þ
whereg is the kinematic viscosity of gas issuing out of the
hole. Open circles denote the synchronized bubble formation
pattern in whichRsyn is 100%. Precise measurement of the
frequency of bubble formation, fB, is necessary to obtain
Rsyn. It became difficult to count the number of bubbles
generated from four nozzles of dni¼1mm for Qg>20
cm3/s because of overlapping of the bubbles. Fortunately,
judgment of bubble formation patterns was possible even if
Qg was raised above 20 cm3/s. This is the reason why the
[image:4.595.325.513.75.212.2]number of data shown in Fig. 13 is much greater than that in Fig. 9. It seems that the bubble formation pattern is closely associated with the hydrodynamic drag at each hole of the nozzle, as shown in the following section. The hydrodynamic drag varies depending on the Reynolds number of flow
issuing out of each hole, Ren. This is the main reason why
Ren was chosen here to correlate the bubble formation
pattern. The boundary between the synchronized and non-synchronized flow patterns in higher Reynolds number regime can be satisfactorily correlated by this arrangement method, as indicated by a thick solid line in each figure. Unfortunately, it is difficult at present to identify the occurrence condition of the partly-synchronized bubble formation pattern for a four-hole nozzle due to lack of data points.
0 20 40 60 80 100
0 20 40 60 80 100
dni = 4.0mm
Nn=2 Nn=3 Nn=4
Gas flow rate, Qg / cm 3
s-1
Synchronization ratio,
Rsyn
/ %
Fig. 12 Synchronized bubbling ratio (dni¼4:0mm).
101 102 103
0 1 2 3 4
Reynolds number based on the hole diameter, Ren
Number of holes,
Nn
Synchronized Non-synchronized
[image:4.595.70.265.76.249.2]dni=1.0mm
Fig. 13 Bubble formation pattern map (dni¼1:0mm).
101 102 103
0 1 2 3 4
Synchronized Non-synchronized
dni=2.0mm
Number of holes,
Nn
Reynolds number based on the hole diameter, Ren
Fig. 14 Bubble formation pattern map (dni¼2:0mm).
101 102 103
0 1 2 3 4
Synchronized Non-synchronized Partly-synchronized
dni=3.0mm
Reynolds number based on the hole diameter, Ren
Number of holes,
Nn
Fig. 15 Bubble formation pattern map (dni¼3:0mm).
101 102 103
0 1 2 3 4
Synchronized Non-synchronized Partly-synchronized
dni=4.0mm
Number of holes,
Nn
[image:4.595.327.513.282.413.2]Reynolds number based on the hole diameter, Ren
[image:4.595.71.255.287.428.2] [image:4.595.71.255.488.624.2]3.3 Mechanism of synchronized bubble formation
The pressure drop at one of the holes, pi, is expressed
by
pi¼igvm,i2=2 ði¼1;2;3;4Þ ð3Þ
vm,i¼Qg,i=An,i ð4Þ
An,i¼dni,i2=4 ð5Þ
whereiis the loss coefficient, g is the density of gas,vm,i
is the cross-sectional mean velocity,Qg,iis the gas flow rate,
Ai is the cross-sectional area of the hole.
The power loss at that hole is given by
Pw,i¼piQg,i ð6Þ
The total power loss,Pw, therefore is expressed by
Pw¼piQg,i
¼ ðg=8Þidni,i2vm,i3 ð7Þ
As the holes have the same inner diameter
dni,i¼dni ð8Þ
the loss coefficient,i, is regarded as a constant.
i¼ ð9Þ
Accordingly, eq. (7) reduces to
Pw¼ ðgdni2=8Þvm,i3 ð10Þ
The following relationship holds under the same condition due to mass balance.
Qg¼An,ivm,i¼Anvm,i ð11Þ
An¼An,i ð12Þ
3.3.1 Condition of synchronized and partly-synchron-ized bubble formation for multi-hole nozzle The minimum power loss condition can be obtained by solving eq. (13) and eq. (14) for conditional extreme prob-lem in the example of four–hole nozzle.
Fðvm,1;vm,2;vm,3;vm,4; Þ
¼Pwðvm,13;vm,23;vm,33;vm,43Þ
ðvm,1þvm,2þvm,3þvm,4CÞ ð13Þ
vm,i¼Qg=An¼const.¼C ð14Þ
where F and Pw are the functions and is Lagrange
multiplier (= const.). By solving eq. (13) and eq. (14), extreme condition is achieved in the following manner.
vm,12 ¼vm,22¼vm,32¼vm,42 ð15Þ
namely jvm,1j ¼ jvm,2j ¼ jvm,3j ¼ jvm,4j ð16Þ
Considering eq. (14), the solutions of eq. (16) are
Answer 1: everyvm,i is 1/4C ð17Þ
Answer 2: two of thevm,iare 1/2C
and remaining two are1=2C ð18Þ
As for answer 1, synchronized bubble formation occurs in this condition. As for answer 2, partly-synchronized bubble formation pattern, as mentioned earlier, appears in this condition. Actually, in partly-synchronized bubble formation pattern, bubbles which almost become to generate in the outlet of the some remaining holes are observed to be sucked and disappear into the nozzle.
Next, in the same manner, concerning three-hole nozzle,
vm,12¼vm,22¼vm,32 ð19Þ
namelyjvm,1j ¼ jvm,2j ¼ jvm,3j ð20Þ
is obtained. In this case, only one answer 1: every vm,i¼
1=3C, can be solved, because answer 2, any vm,i have
equal absolute value with different sign of plus or minus, is impossible.
In the case of three–hole nozzle, in this study, partly-synchronized bubble formation pattern can’t be actually observed in comparison to four–hole nozzle.
Concerning two-hole nozzle,
vm,12¼vm,22 ð21Þ
namelyjvm,1j ¼ jvm,2j ð22Þ
is obtained. In this case, two answers 1 and 2 can be solved.
Answer 1: every vm,i¼1=2C and answer 2: vm,1¼ vm,2
with equal absolute value are theoretically possible. How-ever, in this study, such a case of answer 2 can’t be observed because of unbalance of the pressure in the nozzle.
Accordingly, synchronized bubble formation occurs under the following condition for every multi-hole nozzle.
vm,1¼vm,2¼ ðQg=AnÞ=2 ðtwo-hole nozzleÞ ð23Þ
vm,1¼vm,2¼vm,3¼ ðQg=AnÞ=3
ðthree-hole nozzleÞ ð24Þ
vm,1¼vm,2¼vm,3¼vm,4¼ ðQg=AnÞ=4
ðfour-hole nozzleÞ ð25Þ
On the contrary, partly synchronized bubble formation occurs only in the next condition of four–hole nozzle.
Two of the vm,i are 1/2C and the remaining two are
1=2C.
When the gas flow rate,Qg, is relatively low, it is easy for
the fluid in the nozzle to adjust the flow rate through each
hole to the same value. AsQgbecomes high, such adjustment
becomes impossible and the so-called overshooting
phenom-enon takes place as mentioned in the previous paper.8)This is
the reason why bubbles are generated in the non-synchron-ized pattern in a high gas flow rate regime. On the other hand, bubbles were preferably generated from any one of
multi-holes in a very low gas flow rate regime (Rsyn¼0).
Consequently, the minimum power loss condition is realized in a limited gas flow rate regime. Detailed discussion on this condition must be left for a future study.
3.4 Derivation of an empirical equation for the fre-quency of bubble formation at multi-hole nozzle 3.4.1 Previous empirical equation for the frequency of
bubble formation at a single-hole nozzle
One of the authors proposed previously the following
empirical equation4,5,8) for a single-hole nozzle under the
constant flow condition.6,7)
fB¼1:06kðLg3=Þ1=4ðg=LÞ1=5½ðQg2=gÞ1=5=dnin ð26Þ
where k is constant, L is the density of liquid, g is the
acceleration due to gravity,is the surface tension andgis
the density of gas. The coefficient,k, and the index,n, depend
on the configuration of the nozzle. This equation is used for deriving an empirical equation of the frequency of bubble formation from a multi-hole nozzle.
3.4.2 Experimental results of the frequency of bubble formation
(1) Total frequency of bubble formation, fBT
Figures 17 through 20 show the measured values of the
total frequency of bubble formation, fBT, for the four-hole
nozzles ofdniof 1 mm, 2 mm, 3 mm, and 4 mm, respectively
as a function of gas flow rate,Qg, and the number of holes,
Nn. It should be stressed that fBT is the number of bubbles
generated from all holes of the nozzle in one second and
fB is the number of bubbles generated from each hole in
one second. These figures collectively mean that the total
frequency of bubble formation increases as Qg and Nn
increase. When the gas flow rate is kept constant, the interfacial area between bubbles and liquid can be increased by increasing the number of holes.
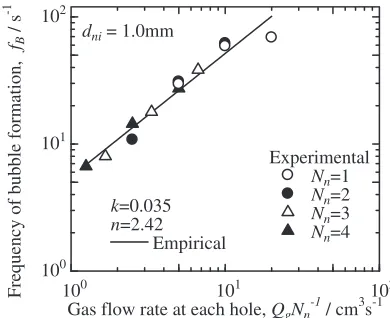
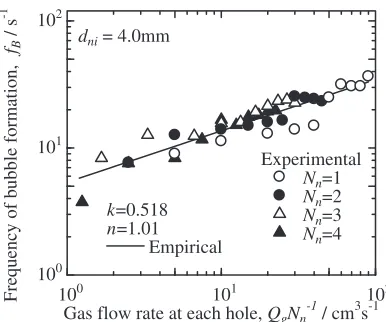
(2) Frequency of bubble formation, fB, at each hole
The frequency of bubble formation,fB, was found to be the
same at every hole regardless of the bubble formation pattern.
Accordingly, the total frequency of bubble formation, fBT,
was divided byNn and plotted against the gas flow rate at
each hole, Qg=Nn, in Figs. 21 through 24. It is evident in
each figure that the measured values of fB for the nozzles
of different number of holes overlap with one another.
Accordingly, the measured values of fB were approximated
by the following empirical equation.
100 101 102
100 101 102
Nn=1 Nn=2 Nn=3 Nn=4 dni = 4.0mm
Total frequency of bubble formation,
fBT
/ s
-1
Gas flow rate, Qg / cm 3
[image:6.595.73.266.73.244.2]s-1
Fig. 20 Relationship between total frequency of bubble formation and gas flow rate (dni¼4:0mm).
100 101 102
100 101 102
dni = 2.0mm
Nn=1 Nn=2 Nn=3 Nn=4
Total frequency of bubble formation,
fBT
/ s
-1
Gas flow rate, Qg / cm 3
[image:6.595.331.522.80.245.2]s-1
Fig. 18 Relationship between total frequency of bubble formation and gas flow rate (dni¼2:0mm).
100 101 102
100 101 102
Gas flow rate, Qg / cm 3
s-1
Total frequency of bubble formation,
fBT
/ s
dni = 1.0mm
Nn=1 Nn=2 Nn=3 Nn=4
Fig. 17 Relationship between total frequency of bubble formation and gas flow rate (dni¼1:0mm).
100 101 102
100 101 102
Nn=1 Nn=2 Nn=3 Nn=4 dni = 3.0mm
Gas flow rate, Qg / cm 3
s-1
Total frequency of bubble formation,
fBT
/ s
Fig. 19 Relationship between total frequency of bubble formation and gas flow rate (dni¼3:0mm).
100 101 102
100
101
102
dni = 1.0mm
Experimental
Nn=1 Nn=2 Nn=3 Nn=4
k=0.035
n=2.42
Empirical
Frequency of bubble formation,
fB
/ s
-1
Gas flow rate at each hole, QgNn-1 / cm3s-1
[image:6.595.329.522.305.473.2] [image:6.595.328.523.526.685.2]fB¼1:06kðLg3=Þ1=4ðg=LÞ1=5½fðQg=NnÞ2=gg1=5=dnin
ð27Þ
As mentioned earlier, the bubble formation pattern depends on the distance among holes in the nozzle. This
distance is represented by the inner diameter of the nozzle,
Di. Accordingly,dni=Diwas chosen to correlate the measured
values ofkandn. The values ofkandnthus determined were
plotted against the dimensionless nozzle diameter,dni=Di, in
Figs. 25 and 26, respectively. The following equations were derived.
k¼0:837þ0:805 logðdni=DiÞ ð28Þ
n¼0:54ðdni=DiÞ0:63 ð29Þ
4. Conclusions
The behavior of bubbles successively generated from a multi-hole nozzle attached to a top lance was observed with a high-speed camera. Some holes of the same inner diameter were settled on the same periphery of the nozzle. Main findings obtained in this study can be summarized as follows: (1) Three types of bubble formation patterns were ob-served: synchronized, partly-synchronized, and non-synchronized bubble formation patterns. The flow pattern map was correlated as a function of the number
of holes, Nn, and the Reynolds number based on the
hole diameter,Ren.
10-1 1
10-1 1 10
Index,
n
Experimental Empirical n=0.54(dni/Di)-0.63
[image:7.595.71.265.72.232.2]Ratio of hole diameter to nozzle diameter, dniDi -1
Fig. 26 Relationship betweennanddni=Di.
10-1 1
10-2 10-1 1
Coefficient,
k
Experimental Empirical
Ratio of hole diameter to nozzle diameter, dniDi -1 k=0.837+0.805 log(dni/Di)
Fig. 25 Relationship betweenkanddni=Di.
100 101 102
100
101
102
Experimental
Nn=1 Nn=2 Nn=3 Nn=4
dni = 4.0mm
k=0.518
n=1.01
Empirical
Gas flow rate at each hole, QgNn
-1
/ cm3s-1
Frequency of bubble formation,
fB
/ s
[image:7.595.328.520.76.240.2]-1
Fig. 24 Relationship between frequency of bubble formation and gas flow rate at each hole (dni¼4:0mm).
100 101 102
100
101
102
dni = 2.0mm
Experimental
Nn=1 Nn=2 Nn=3 Nn=4
k=0.265
n=1.36
Empirical
Frequency of bubble formation,
fB
/ s
-1
Gas flow rate at each hole, QgNn
-1
[image:7.595.330.519.289.455.2]/ cm3s-1
Fig. 22 Relationship between frequency of bubble formation and gas flow rate at each hole (dni¼2:0mm).
100 101 102
100
101
102
Experimental
Nn=1 Nn=2 Nn=3 Nn=4
dni = 3.0mm
k=0.419
n=1.15
Empirical
Frequency of bubble formation,
fB
/ s
-1
Gas flow rate at each hole, QgNn
-1
[image:7.595.72.266.291.450.2]/ cm3s-1
Fig. 23 Relationship between frequency of bubble formation and gas flow rate at each hole (dni¼3:0mm).
[image:7.595.72.265.508.669.2]ized bubble formations was predicted by solving the conditional extreme problem.
(3) The measured values of the frequency of bubble formation at the holes of a multi-hole nozzle were nearly equal to one another regardless of bubble formation patterns.
(4) The frequency of bubble formation from each nozzle,
fB, was satisfactorily approximated by an empirical
equation, eq. (27), proposed in this study.
1) K. Mori and M. Sano: Tetsu-to-Hagane67(1981) 672–695.
2) Y. Ozawa and K. Mori: Trans. Iron Steel Inst. Japan23(1983) 671–675. 3) Y. Sahai and G. R. St. Pierre: Advances in Transport Process in
Metallurgical Systems, (Elsevier, Amsterdam, 1992) pp. 259–326. 4) M. Iguchi and T. Chihara: Jpn. J. Multiphase Flow11(1997) 46–55. 5) O. J. Ilegbusi, M. Iguchi and W. Wahnsiedler: Mathematical and
Physical Modeling of Materials Processing Operations, (Chapman Hall/ CRC, Boca Raton, 1999) pp. 407–413.
6) I. Leibson, E. G. Holcomb, A. G. Cacoso and J. J. Jamic: AIChE J.2
(1956) 296–306.
7) L. Daividson and E. H. Amick, Jr.: AIChE J.2(1956) 337.