Grain Morphology of As-Cast Wrought Aluminium Alloys
*Mark Easton
1;2, Cameron Davidson
1;3and David StJohn
1;41
CAST Co-operative Research Centre, Monash University, Vic 3800, Australia
2Department of Materials Engineering, Wellington Road, Monash University, Vic 3800 Australia 3CSIRO Process Science and Engineering, 1 Technology Court, Pullenvale, Qld 4069, Australia
4School of Mechanical and Mining Engineering, Materials Division, The University of Queensland, Qld 4072, Australia
Two of the most important microstructural features of alloys are the grain size and the secondary dendrite arm spacing (SDAS) and these two factors are shown to combine together to describe the grain morphology. Both grain refinement and the SDAS depend upon alloy composition through constitutional undercooling, but in different ways. It is shown that there is a ‘characteristic’ SDAS for each alloy at a particular cooling rate, and reducing the grain size causes the grain morphology to change from dendritic to cellular/rosette-like to globular or spherical. Increasing the cooling rate refines both the SDAS and the grain size, but reduces the SDAS more rapidly leading to finer, more dendritic grain structures. Particular ratios of grain size to SDAS are used to define each morphology and it is shown how these can assist with obtaining a required grain size and morphology through the use of solidification conditions and alloy chemistry.
[doi:10.2320/matertrans.L-MZ201118]
(Received October 5, 2010; Accepted December 14, 2010; Published May 1, 2011)
Keywords: grain size, dendrite arm spacing, cooling rate, constitutional undercooling
1. Introduction
Two of the key microstructural parameters in the as-cast microstructure of an alloy are the grain size and the secondary dendrite arm spacing (SDAS). Fundamentally, these parameters can be used to describe the morphology of a grain. Where the grain size is large and the dendrite arm spacing is small, the grains are dendritic; when the grain size is only a little greater than the dendrite arm spacing then a rosette or cellular grain morphology is observed, and if the grains are spherical or globular then no dendrites are observed. The grain size, SDAS and grain morphology affect various properties of the alloy including their castability,1,2) especially hot tearing resistance,3)their mechanical proper-ties,4) and are especially important in semi-solid process-ing.5–7)
The equiaxed grain morphologies have some similarity to the planar, cellular and dendritic growth that have been characterized in columnar solidification,8)where the classi-cal approach attributes the growth morphology to the propensity of a perturbation to grow into a constitutionally undercooled region. Equiaxed grains tend to grow dendriti-cally because their growth is unconstrained by the temper-ature gradient. The morphology of equiaxed grains has often been related to the breakdown of spherical growth.5,9) However, it is also known that dendrites coarsen during soldification10) to the point that the grains become spher-ical.11)There is also evidence in peritectic systems such as Al-Ti and Mg-Zr that whilst initial growth is dendritic as shown by the morphology of the Ti-12) or Zr-enriched regions,13) the final grain morphology can be spherical or globular.
Hence the grain morphology can be described as a competition between the nucleation processes related to
grain refinement and the ripening processes, if it is assumed that the grain will grow dendritically. This is shown schematically in Fig. 1. Whilst there are some situations where grains will grow spherically,5,9)e.g. skip stage 2 and go directly to stage 3 or 4 in the figure, it is likely that the same processes are acting. In the end for the solidification of alloys, the SDAS will be determined by when in the coarsening process the eutectic reactions that delineate the dendrites occur.14) Hence, it appears that analytical and/or empirical models for grain size and SDAS can be used to describe the grain morphology and be complimentary to computational approaches undertaken by other research-ers.15)
There has been considerable work on determining the factors that affect grain size. These include the alloy composition,16–18) the number density and potency of nucleant particles19)(which is influenced by particle size20)), and the cooling conditions.21,22) Some of these factors are known to also affect the SDAS, e.g. the cooling rate and the alloy composition.14,23,24)
The factor that is influenced by both alloy composition and cooling rate is constitutional undercooling (CU) and this influences both the grain size and the SDAS. The parameter that is used to link both factors is the growth restriction factor,Q0,
Fig. 1 A schematic of the growth of grains during solidification. Initially nucleation occurs, the grains begin to grow dendritically, until they impinge and then the dendrites coarsen potentially to rosette-shaped and then to globular or spherical grains.
*The Paper Contains Partial Overlap with the ICAA12 Proceedings by USB under the Permission of the Editorial Committee.
[image:1.595.349.504.344.407.2]Q0¼ X
jmlc0;jðkj1Þ ð1Þ
wheremlis the liquidus gradient,c0is the alloy composition
and k is the partition coefficient for each element j in the alloy. A simple equation has been found to relate the grain size,d, and the alloy constitution through this parameter,19,25) i.e.
d¼ ffiffiffiffiffiffiffiffi1 f Nv
3
p þDTn
vQ0
ð2Þ
whereTn is the nucleation undercooling,Nvis the number of those particles, and f is the proportion that are active,Dis the diffusion coefficient and v is the growth velocity. The cooling rate affects the growth velocity through a square root relationship.17,21)
The relationship between the SDAS andQis not quite as simple. Using a diffusion ripening model, the SDAS,2can
be related to the solidification time,tf, through
2¼5:5ðMtfÞ0:33 ð3Þ
M¼
Xn
j¼1
ðQ0;jQf;jÞ=Dj
ln
Xn
j¼1
Qf;j=Dj
Xn
j¼1
Q0;j=Dj
2 6 6 6 6 4 3 7 7 7 7
5 ð3aÞ
for multi-component alloys.26) In this case there are two parameters related toQ:Q0at the beginning of solidification,
which is the same as used in eq. (2) and Qf at the end of solidification which is determined using the composition of the final segregated liquid. This formulation works reason-ably well for the prediction of SDAS in many alloys, but is limited by the assumptions in the model and factors other than diffusion controlled-ripening that influence the SDAS in commercial alloys.27)
Previous publications have focused on the effect of alloy and solidification variables on the grain size19,21,22)and the SDAS27) separately. The aim of the paper is to emphasise how this work can be used in a description of grain morphology.
2. Experimental
The details of the experimental procedure are described elsewhere.19,21,27)In summary, four wrought alloys from the
1000 to 6000 series, which have a variety of alloying elements andQvalues, were solidified at four cooling rates ranging from 0.3 to 15C/s. A constant addition of 0.005
mass% TiB2 by an Al-3 mass%Ti-1 mass%B master alloy
was made to each alloy so that the nucleant population was essentially equivalent for all of the alloys investigated. At a cooling rate of 1C/s an additional three alloys were studied
at two additional TiB2 contents. Castings 40 mm high and
30 mm in diameter were made in pre-heated graphite moulds. Typical compositions of the alloys and the Q028) andQf27) values are given in Table 1.
Metallographic samples were sectioned approximately 10 mm from the base of the ingots. These were mechanically polished and anodized using a 0.5% HBF4 solution for
approximately 2 min at 20 V. These samples were viewed optically with polarized light and the grain sizes were measured using a linear intercept technique (ASTM 112-96). At least two fields were calculated for each measurement with approximately 100 intercepts in each field depending on the grain size. The dendrite arm spacing was measured by finding a number of adjacent dendrite arms from one primary dendrite arm and measuring the distance between the dendrite centres. Wherever possible at least two fields were analysed for each measurement with approximately 50 secondary dendrite arms from multiple primary dendrite arms being counted in each field.
3. Experimental Observations
The addition of Ti solute leads to a substantial decrease in the grain size for low solute alloys,18,29)such as alloy 1050 (Fig. 2(a)), where the value ofQ0is approximately 2. This is
because Ti has a relativeQvalue 40 to 100 times that of most alloying elements.30)Likewise in high solute alloys such as alloy 2014, the value of Q0 is approximately 22 and the
addition of Ti has little effect on the grain size of alloys (Fig. 2(b)). However, the Ti content has little effect on the SDAS in either case. The other alloys studied hadQ0values
between these two alloys and the effect that Ti solute additions had on the grain size decreased as the Q0 value
increased. The addition of Ti had no observable effect on the SDAS in any of the alloys.27)
When grain refiners are added, both TiB2 particles and
[image:2.595.46.550.124.234.2]solute Ti are usually added to the alloy. It has been
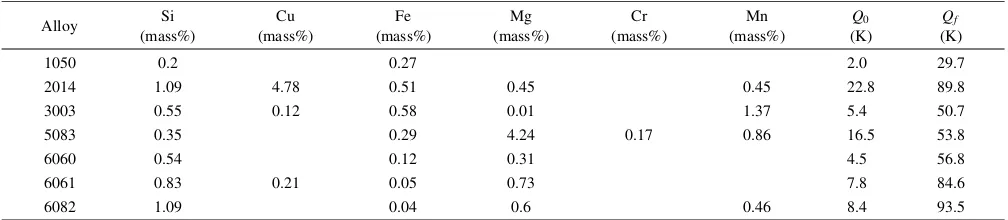
Table 1 The composition of the alloys made and an estimation of theQ0andQfvalues of the alloys for an average composition of the
alloys cast. BothQ0andQfwere determined using the additive methodology (eq. (1)). Whilst this approach has shown to be suitable for
these alloys forQ0,28Þit is less well understood forQf. The compositional values forQf were determined using data from the
Gulliver-Scheil model in Thermocalc and were chosen at a major eutectic reaction towards the end of solidification where intermetallics that outlined the dendrites were observed. More details have been provided previously.27Þ
Alloy Si (mass%) Cu (mass%) Fe (mass%) Mg (mass%) Cr (mass%) Mn (mass%) Q0 (K) Qf (K)
1050 0.2 0.27 2.0 29.7
2014 1.09 4.78 0.51 0.45 0.45 22.8 89.8
3003 0.55 0.12 0.58 0.01 1.37 5.4 50.7
5083 0.35 0.29 4.24 0.17 0.86 16.5 53.8
6060 0.54 0.12 0.31 4.5 56.8
6061 0.83 0.21 0.05 0.73 7.8 84.6
established that unlike the addition of Ti solute, the addition of TiB2 particles reduces the grain size in all alloys by
approximately the same amount,19) in line with eq. (2). However, again the SDAS is unchanged.
The effects of the combination of TiB2 additions and Ti
solute additions on the grain size and morphology are shown in Fig. 3. Especially in alloy 1050 but also alloy 2014, the initial addition of grain refiner substantially decreases the grain size whilst the grain morphology remains dendritic. A further reduction in grain size leads to the development of a cellular or rosette morphology. It is impossible to measure SDAS on grains with such morphology, and consequently this point is missing from Fig. 2(a). It appears that when the grain size to SDAS ratio is below 3 and especially when it is close to 2, the measurement of SDAS becomes impossible.
Another important factor that affects both the grain size and the SDAS is the cooling rate. This is particularly observed in Fig. 4, where it is apparent that when the cooling rate increases the grain size decreases, but there is also an obvious change in grain morphology from spherical to
(a)
(b)
Fig. 2 Variation of grain size and SDAS with the amount of Ti for (a) alloy 1050 and (b) 2014 at a cooling rate of 1C/s and a TiB
2 addition of
0.005 mass% as Al-3Ti-1B. There is no point for SDAS at 0.05 mass% Ti for 1050 in (a) as the grains were no longer dendritic. Data sourced from Eastonet al.19,27)
(d) (a)
(e) (b)
(f) (c)
500µm
500µm
500µm
Fig. 3 Optical micrographs viewed under polarised light. Alloy 1050 is shown in (a) to (c), and alloy 2014 is (d) to (f). Alloy 1050: (a) without grain refiner addition; (b) with 0.01 mass% TiB2using a Al-3Ti-1B master
alloy; (c) with 0.02 mass% TiB2and the addition of 0.05 mass% Ti solute.
Alloy 2014: (d) without grain refiner addition (e) with 0.01 mass% TiB2
using a Al-3Ti-1B master alloy and (f) with the addition of 0.05Ti solute. The scale bar on all images is 500mm.
(a)
(c)
(b)
(d)
500µm 500µm
500µm 500µm
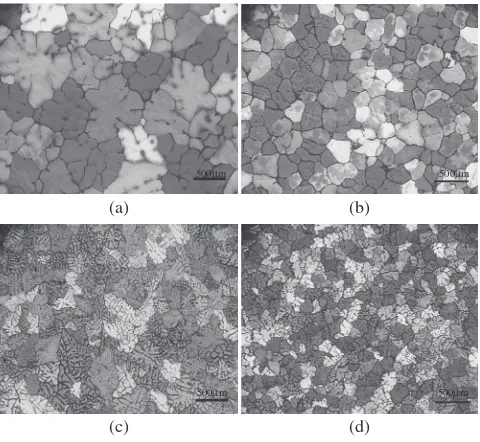
Fig. 4 Optical micrographs viewed under polarised light of Alloy 1050. (a) Grain refined with 0.005 mass% TiB2 addition at a cooling rate of
0.3C/s; (b) with a further addition of 0.05 mass% Ti solute addition also at 0.3C/s; (c) 0.005 mass% TiB
2at a cooling rate of 15C/s and (d) with a
[image:3.595.65.267.71.466.2] [image:3.595.306.546.71.389.2] [image:3.595.307.547.499.720.2]equiaxed dendritic. Also note the evidence of a prior dendritic structure in Fig. 4(b) due to the presence of Ti segregation when the final grain morphology is globular or spherical. Figure 5(a) compiles data31)for the grain size and the SDAS with cooling rate for each of the alloys. The grain size data is for the alloys with only an addition of 0.005 mass% Ti as Al-3Ti-1B master alloy, i.e. no Ti solute additions were made and it shows that the SDAS decreases towards zero as the cooling rate increases. The grain size decreases towards a finite value. Hence the SDAS decreases more rapidly than the grain size with increased cooling rate (Fig. 5(b)).
4. Discussion
Two effects on grain morphology have been demonstrated. The first one is that when the grain size is reduced the SDAS does not change and consequently the grain size becomes finer and the grain morphology changes from dendritic to rosette like/cellular to globular/spherical. This occurs through the addition of nucleant particles such as TiB2 in
Al alloys and on the addition of solute Ti to alloys with low solute levels, i.e. low Q0 values. The morphology change
with grain refinement has been observed previously in grain
refinement processes for the production of semi-solid slurries5,22,32) and for ultrasonic grain refinement of al-loys.33–35)
Interestingly Ti additions have no discernable effect on the SDAS, even in alloys with lowQ0values where they have a
very large effect on the grain size. This has been demon-strated to be because Ti affects Q0 significantly in these
alloys but has no effect on Qf,27) as Ti segregates very strongly into the-Al phase at the beginning of solidification and consequently has little effect on the CU at the end of solidification. Qf has a greater influence on the SDAS than Q0. This is because it is the restriction of coarsening towards
the end of solidification that is more important in controlling the SDAS. Hence, it is the presence of strongly segregating eutectic alloying elements that are more important. However, the values ofQf should only be used as a guide as they are very dependant upon the values chosen as they relate to particular reactions that take place. Furthermore, values ofm andkat the latter stages of solidification are likely to deviate substantially from the binary values used. Finally, other issues such as solidification time are also important. In the end, if the Q0 andQf values are high and the solidification time is short then the SDAS will be very fine and the grain morphology is more likely to be dendritic.
The second effect is that whilst the grain size and SDAS are refined by increasing cooling rate the SDAS was refined more rapidly (Fig. 4 and Fig. 5). The relationship between SDAS and cooling rate is well established and is of the form of eq. (3), wheretf is inversely proportional to the average cooling rate. Hence, the SDAS reduces with cooling rate with a power-law exponent 0.33 (eq. (3)). The measured power exponent for these alloys ranged from 0.33–0.527)which is a typical range of observed variation.36)
Grain size has been found to reduce for the samples analyzed here according to an equation of the form:21)
d¼ ffiffiffiffiffiffiffiffiffiffiffiffiffiffi1 fðTT_ÞNv
3
p þ D:Tn
QcTT_1=2 ð4Þ
where the cooling rate affects the number of active nucleants, and the growth velocity v (eq. (2)) is related to the square root of the cooling rate via a fitting factor,c. This is because the thermal gradient and growth velocity are coupled in the solidification conditions used in the experimental set-up used. Even though the power index for cooling rate is similar for SDAS and grain size, the grains become more dendritic because increasing cooling rate tends towards a positive finite value rather than zero as it does for the SDAS (Fig. 5).
This suggests that it is inevitable that obtaining a very fine grain size by thermal means will inevitably lead to a more dendritic grain morphology. However, another way of reducing the grain size is to use low temperature pouring into a chill mould, where the grain size is reduced substantially, but the cooling rate changes little. In this case, the grain size can reduce substantially without a significant change in the SDAS and consequently a more globular morphology is obtained.32,37)
To be able to characterize grain morphology it is initially important to define what different grain morphologies are. To do this, it is important to consider defining a characteristic SDAS for each alloy for a given set of solidification (a)
(b)
Fig. 5 (a) The effect of increased cooling rate on the grain size (full line) and SDAS (dashed line) for each of the alloys with a 0.005 mass% TiB2
addition as Al-3Ti-1B. Data sourced from Eastonet al.31)(b) The ratio of
[image:4.595.67.273.71.419.2]conditions. This work indicates that this is the case, i.e. that the addition of grain refiner as TiB2 particles or solute Ti
affects only the grain size and not the SDAS. Hence, reducing the grain size only makes it more difficult to measure the SDAS as the primary dendrite arms become shorter. A spherical grain structure is obtained where the number of successful nucleation events is large enough that the final grain morphology is non-dendritic.5,34)
Given that an alloy has a characteristic SDAS, particular grain morphologies can be defined. In Fig. 4(a) a cellular morphology is observed and the d :2 ratio is
approx-imately 3, whilst in Fig. 4(b), the ratio is only 1.5 assuming the same SDAS as measured from Fig. 4(a) and the grain morphology is definitely globular or spherical. This sug-gests that a criterion can be used to define grain morphology, i.e. if the d :2 ratio is less than 2, the grain
[image:5.595.66.273.72.425.2]morphology is spherical or globular, when it is between 2 and 4 it is rosette-like or cellular and above 4 it is equiaxed dendritic.
Figure 6 shows a way of plotting grain size and SDAS data that provides information on the grain morphology for two alloys. Semi-empirical relationships are available for determining the grain size19)and the SDAS38)for the range
of alloys in this work and empirical equations for other alloys can be obtained from elsewhere as well, e.g.36) Figure 6 shows both the change from dendritic to cellular to globular grain structures as grain refinement occurs and the trend towards finer, more dendritic grain morphologies as the cooling rate increases. Such diagrams may be useful in the future for tailoring grain morphologies for particular alloys for particular processes. A good example is in controlling the solidification conditions to obtain spherical grain morphologies for rheocasting.6,15,39) Another impor-tant use would be as an input for understanding perme-ability that is an important parameter in hot tearing models.40–42)
5. Summary and Conclusions
Both the grain size and the SDAS are affected by alloy composition and cooling rate through CU parameters. The major difference is that the grain size is affected by the constitutional conditions as solidification begins, whilst the SDAS is more affected by the CU generated by the liquid remaining near the end of solidification. Hence solute additions that have a large effect on the grain size, such as Ti, do not necessarily have a significant effect on the SDAS. Increasing the cooling rate decreases both the SDAS and the grain size, although it has a greater effect on the SDAS. The different effects of grain refiner additions and cooling rate on grain size and SDAS means that a wide variety of grain morphologies can be generated. It is suggested that the ratio of grain size to SDAS can be used to define the grain morphology. At ratios less than two the grain morphology is spherical or globular, between 2 and 4 it is rosette-like or cellular and above 4 it is equiaxed dendritic. Understanding these relationships may assist with engineering problems such as optimization of microstructure during rheocasting and the understanding of hot tearing.
Acknowledgements
The CAST Co-operative research centre was established under, and is supported in part by, the Australian Govern-ment’s Cooperative Research Centres scheme. Yeannette Lizama is thanked for her assistance with the metallography.
REFERENCES
1) M. A. Easton and D. H. StJohn: Inter. J. Cast Metals Res.12(2000) 393.
2) A. Dahle, S. Karlsen and L. Arnberg: Inter. J. Cast Metals Res.9(1996) 103.
3) S. Lin, C. Aliravci and M. O. Pekguleryuz: Metall. Mater. Trans. A38A
(2007) 1056.
4) C. Ca`ceres and Q. Wang: Inter. J. Cast Metals Res.9(1996) 157. 5) R. A. Martinez, A. Karma and M. C. Flemings: Metall. Mater. Trans. A
37A(2006) 2807.
6) S. B. Spencer, R. Mehrabian and M. C. Flemings: Metall. Mater. Trans. B7(1972) 1925.
7) P. J. Uggowitzer and H. Kaufmann: Steel Res.75(2004) 525. 8) W. Kurz and D. Fisher:Fundamentals of solidification, 4th edition,
(Trans Tech Publications, Switzerland., 1998) pp. 65–69. 9) M. Qian: Acta Mater.54(2006) 2241.
10) M. C. Flemings, T. Z. Kattamis and B. P. Bardes: AFS Trans.99(1991) 501.
(a)
(b)
Fig. 6 Plots of the range of grain sizes observed versus the SDAS for the different cooling rates for alloys (a) 1050 and (b) 6060. dmax is the
maximum grain size and dminis the minimum grain size. Linear best fit
11) Z. Fan: Int. Mater. Rev.47(2002) 49.
12) M. A. Easton and D. H. StJohn: Mater. Sci. Technol.16(2000) 993. 13) M. Qian, D. H. StJohn and M. T. Frost: Scr. Mater.46(2002) 649. 14) Ø. Nielsen, B. Appolaire, H. Combeau and A. Mo: Metall. Mater.
Trans. A32A(2001) 2049.
15) M.-F. Zhu, C.-P. Hong, D. M. Stefanescu and Y. A. Chang: Metall. Mater. Trans. B38B(2007) 517.
16) I. Maxwell and A. Hellawell: Acta Metall.23(1975) 229. 17) M. Johnsson: Z. Metallkde.85(1994) 781.
18) M. A. Easton and D. H. StJohn: Acta Mater.49(2001) 1867. 19) M. A. Easton and D. H. StJohn: Metall. Mater. Trans. A36A(2005)
1911.
20) T. E. Quested and A. L. Greer: Acta Mater.52(2004) 3859. 21) M. A. Easton and D. H. StJohn: Mater. Sci. Eng. A486(2008) 8. 22) D. H. StJohn, M. A. Easton and M. Qian: Solid State Phenomena141–
143(2008) 355.
23) K. P. Young and D. H. Kirkwood: Metall. Trans. A6A(1975) 197. 24) M. Bamberger, B. Z. Weiss and M. M. Stupel: Mater. Sci. Technol.3
(1987) 49.
25) M. Qian, P. Cao, M. A. Easton, S. D. McDonald and D. H. StJohn: Acta Mater.58(2010) 3262.
26) M. Rappaz and W. J. Boettinger: Acta Mater.47(1999) 3205. 27) M. A. Easton, C. J. Davidson and D. H. StJohn: Metall. Mater. Trans. A
41A(2010) 1528.
28) M. A. Easton and D. H. StJohn:Light Metals 2001, ed. by J. L. Anjier, (The Minerals, Metals and Materials Society, Warrendale, Pennsylva-nia, 2001) pp. 927–934.
29) M. A. Easton and D. H. StJohn: Metall. Mater. Trans. A30A(1999) 1625.
30) M. Johnsson and L. Ba¨ckerud: Z. Metallkde.87(1996) 216. 31) M. A. Easton, J. F. Grandfield, D. H. StJohn and B. Rinderer: Mater.
Sci. Forum519–521(2006) 1675.
32) M. A. Easton, H. Kaufmann and W. Fragner: Mater. Sci. Engng. A420
(2006) 135.
33) T. V. Atamaneko, D. G. Eskin, L. Zhang and L. Katgerman: Metall. Mater. Trans. A41A(2010) 2056.
34) G. I. Eskin and D. G. Eskin: Proc. 12th Int. Conf. on Aluminium Alloys, (Japan Inst. Light Metals, 2010) pp. 638–645 (USB).
35) G. I. Eskin: Ultrasonics Sonochem.8(2001) 319.
36) L. Ba¨ckerud, E. Kro´l and J. Tamminen:Solidification characteristics of aluminium alloys volume. 1: Wrought alloys, (AFS/Skanaluminium, 1993).
37) H. Wang, C. J. Davidson, J. A. Taylor and D. H. StJohn: Mater. Sci. Forum396–402(2002) 143.
38) M. A. Easton, D. H. StJohn and E. Sweet: Mater. Sci. Forum630(2010) 213.
39) H. Kaufmann, H. Wabusseg and P. J. Uggowitzer: Aluminium 76
(2000) 69.
40) M. Rappaz, J.-M. Drezet and M. Gremaud: Metall. Mater. Trans. A
30A(1999) 449.
41) S. Verne´de and M. Rappaz: Acta Mater.55(2007) 1703.