Effect of Injection Speed on Microstructure of AZ91D Magnesium Alloy
in Semi-Solid Injection Process
+1Yuichiro Murakami, Naoki Omura, Mingjun Li, Takuya Tamura and Kenji Miwa
+2National Institute of Advanced Industrial Science and Technology, Nagoya 463-8560, Japan
We have developed a new type of semi-solid injection process that can obtain a high material yield of about 90%for magnesium alloys. The morphology of the solid particles in the semi-solid slurry has significant effects on the rheological behavior. In this study, semi-solid injection moldings of AZ91D magnesium alloy were conducted with injection speeds of 220, 300, and 400 mm/s and for fraction solids of
fs=0.3, 0.4, and 0.5 in order to investigate the effects of shear stress on the microstructure. With a high injection speed, the¡-phase solid particles became spherical and the average particle size decreased. The average roundness of the¡-phase solid particles was correlated to the shear stress calculated on the assumption that the slurry characteristics correspond to that of the steady state at the nozzle. The reduction of the average particle size suggests that the solid particles were broken up and spheroidized by the shear stress. Under all experimental conditions, the
¡-phase particles in the plane perpendicular to theflow direction were concentrated at the center of specimen rather than on the surface. On the other hand, distribution of the¡-phase particles in the plane parallel to theflow direction depended on the injection speed. A high fraction solid zone was generated at the end of the specimen for a high injection speed. [doi:10.2320/matertrans.F-M2012811]
(Received November 10, 2011; Accepted March 1, 2012; Published April 18, 2012)
Keywords: magnesium alloy, semi-solid injection process, microstructure, viscosity, shear stress, injection speed, fraction solid
1. Introduction
Recently, the development of technology for environ-mental protection, natural resource management, and energy conservation has become increasingly important. In partic-ular, the reduction of carbon dioxide emissions and improve-ments in fuel efficiency are urgent issues for the automobile industry, and the reduction of vehicle weight is a highly effective means of improving fuel efficiency. In this regard, magnesium alloy in particular is considered to be a promising lightweight structural material because it has the lowest density among the applicable metallic materials and has excellent specific strength.
The die casting process is one of the most commonly used method for forming magnesium alloys. However, compo-nents molded by die casting contain inherent defects such as the porosity generated by trapped air or solidification contraction and oxide inclusions. Additionally, die casting of magnesium alloys requires the use of a cover gas because the alloys are easily combustible in the liquid state.
Recently, semi-solid processes have been developed to fabricate aluminum alloy products.13)These processes use a partially solidified slurry that has a higher viscosity than liquid metal. Consequently, the number of casting defects in the final components generated by trapped air or shrinkage can be reduced. Additionally, this process is useful for magnesium alloys because processing temperatures lower than conventional casting processes result in decreased combustibility of the magnesium alloy.
We have developed a new type of semi-solid injection process that can be used in the forming of magnesium alloys with a high material yield of about 90%.46)In this process, generic magnesium billets, not special billet for semisolid
process like thixo-billet, are heated to semi-solid temper-atures in an injection cylinder so that the semi-solid magnesium alloy is not exposed to air. For this reason, this process does not require the use of a cover gas.
In the semi-solid process, the morphology and agglomer-ation of solid particles is recognized as having a significant effect on the rheological characteristics of the slurry.7,8)In the general semi-solid injection process for magnesium alloys, the alloys are stirred in a barrel and injected into a mold through the nozzle.911) The effect of stirring on the morphology of the solid particles in this process has been reported. On the other hand, in our process, solid particles are subjected to shear stress only at the nozzle. In this way, the solid phases are broken up and dispersed in the slurry. Thus, understanding the effect of the shear stress at the nozzle on the microstructure is very important for this process.
In this study, an apparatus for producing the specimens by using the new semi-solid injection process was developed. Plate specimens were made by injecting AZ91D semi-solid billets into a permanent mold through a narrow nozzle. The effects of the volume fraction solid and injection speed on the microstructure (especially the morphology of the solid particles) were investigated. Additionally, the effect of shear stress was investigated by comparison with the slurry microstructure before injection.
2. Experimental Procedure
2.1 Investigation of microstructure before injection process
The chemical composition of the AZ91D magnesium alloy is given in Table 1. For the investigation of the slurry microstructure before the injection process, the sample was prepared as follows. A round bar (24.5 mm diameter and 30 mm length) was cut out from an AZ91D ingot (62 mm diameter and 300 mm length). The billet was put into a 0.7 mm thick stainless cup and heated in an electric heating furnace to a temperature in the semi-solid range, namely, 591, +1This Paper was Originally Published in Japanese in J. JFS83(2011) 315
321.
+2Present address: Aichi Science and Technology Foundation, Kariya 448-0013, Japan
586, or 581°C. The temperature was measured by a thermo-couple that was set in the center of the billet. After isothermal holding at these temperatures for 10 min, the billet, which has a semi-solid microstructure, was quenched by water cooling. This experiment was carried out under a SF6gas atmosphere. The billets were molded in epoxy resin and polished by grinding with SiC paper, followed by polishing with diamond paste. The billets were then etched in a solution of 75 mL ethylene glycol, 1 mL nitric acid, and 24 mL distilled water.
2.2 Injection molding experiment
A diagram of the semi-solid forming apparatus is shown in Fig. 1. This experimental setup has a vertical injection system. The injection cylinder has an inner diameter of 25 mm, an outer diameter of 60 mm, and a length of 475 mm; the nozzle is 3 mm in diameter. In this setup, the extrusion ratio is approximately 70.
The injection cylinder in the apparatus is constantlyfilled with billets from the nozzle to a height of 320 mm, and the billet in the uppermost part of the cylinder is heated to the semi-solid temperature range. The injection cylinder is equipped with six heaters on the surface of the outer wall.
The heaters are controlled independently by measurements from six thermocouples (H1 to H6) inserted at the location of
each heater. The thermocouples measure the temperature of the cylinder wall; hence, the actual temperature of the billet inside the cylinder differs from this value. Therefore, the actual temperature of the billet was measured by inserting a thermocouple directly into the billet from the nozzle. From these measurements, the temperature of the billet could be controlled precisely to obtain an optimal temperature balance for heaters H1 to H6. The temperature of the billet in the uppermost part of the injection cylinder (from the nozzle to a height of 130 mm) was set to a temperature of 591, 586, or 581°C, which is within the semi-solid range. The fraction solid fs was 0.3, 0.4, or 0.5 at each of these temperatures, respectively. On the other hand, the temperature of the billet closer to the bottom of the injection cylinder was set lower than the solidus temperature. Thus, as the semi-solid billet was not exposed to air, a cover gas was not used in this experiment.
The billet was inserted into the magazine and moved to a position under the cylinder by an air piston. The billet was then inserted into the injection cylinder by a hydraulic piston. The injection cylinder was continuously filled with billets, thus forcing a semi-solid billet from the uppermost part of the heated cylinder into the permanent mold through the nozzle. The injection speed was set to 220, 300, or 400 mm/s. The permanent mold had two plate cavities 20 mm in width, 100 mm in length, and 5 mm in thickness. In this experiment, two plate specimens were made per injection, or one plate specimen was made per injection when one cavity wasfilled by a dummy.
The specimens were then polished and etched as described in section 2.1. The microstructure of these specimens was observed by optical microscope.
3. Results
3.1 Investigation of microstructure before injection process
The microstructure of the as-received AZ91D alloy is shown in Fig. 2. The microstructure consists of eutectic compounds dispersed between primary dendrite¡-Mg phases. Figure 3 shows the microstructure of the billets quenched after isothermally holding for 10 min at 591, 586, and 581°C. These micrographs show that the AZ91D magnesium alloy has a homogeneous microstructure with net-like primary ¡ -Mg and eutectic ¡-Mg and ¢-Mg17Al12 phases. We can identify the ¡-Mg particles as the solid phase and the ¡+¢ phase as the liquid phase before quenching. It can be seen that with rising temperature, the liquid phase proportion increased and the network-like structure was divided. 3.2 Injection molding experiment
3.2.1 Effect of injection speed on formability
Figure 4 shows the outward appearance of the AZ91D injected into the permanent mold with an injection speed of 220 mm/s. In the case when two plate specimens were formed, a large unfilled zone was seen in the center of the specimen forfs=0.5. By decreasing the fraction solid to 0.4 and 0.3,filling degree was increased but the unfilled zone did not disappear. Thus, for the injection speed of 220 mm/s, the
fluidity was insufficient to fill two cavities. On the other (D)
(E) (F)
(G) H1
H2
H3
H4
H5
H6
(A) (B) (C)
(I)
(I) (J)
25
130
60
60
60
55
64
100 φ25
φ24.5
(H)
(A) Piston (B) Magazine (C) Billet (D) Cylinder base (E) Injection cylinder (F) Heating elements (G) Nozzle
(H) Thermocouples (I) Permanent mold (J) Cavity
[image:2.595.50.287.86.455.2]Fig. 1 Schematic representation of semi-solid forming testing machine. Table 1 Chemical composition of AZ91D magnesium alloy.
(mass%)
Al Zn Cu Fe Mn Ni Si Mg
hand, in the case when one plate specimen is formed, a fully
filled specimen could be obtained for each fraction solid. The following results are for conditions of one plate specimen per injection.
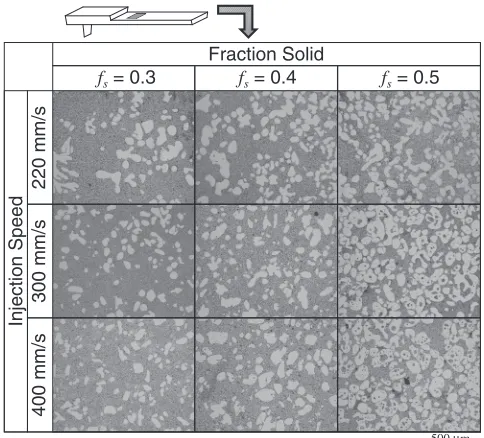
3.2.2 Effect of injection speed and fraction solid on morphology of solid particles
Figure 5 shows a typical microstructure at the center of the AZ91D magnesium alloy specimen injected under various conditions. These micrographs show that the specimen has a homogeneous microstructure with a uniform dispersion of primary¡-Mg in the matrix (eutectic¡-Mg and¢-Mg17Al12). When the slurry was injected, the solid phase consisted of the ¡-Mg particles with the matrix as the liquid phase. In comparison with the slurry before injection, the solid phase was decoupled and became spherical. Additionally, with increasing injection speed, the size of primary solid particles decreased, and the primary solid particle shape changed from irregular to spherical one. On the other hand, the primary solid particles became large and spherical with increasing fraction solid.
The primary solid particle diameter d [µm] (equivalent circle diameter) and the roundness R was measured at five locations in the specimen image.
The roundness was calculated as follows:
R¼L2=ð4³AÞ;
whereL[µm] andA[µm2] are the boundary length and area of the primary solid particle, respectively. When R=1, the particle is a true sphere. In addition, the area-weighted mean diameterds[µm] and area-weighted mean roundnessRswere calculated using the following equations:
ds¼diAi=Ai
and
Rs¼RiAi=Ai;
where di [µm], Ai[µm2], and Riare the diameter, area, and
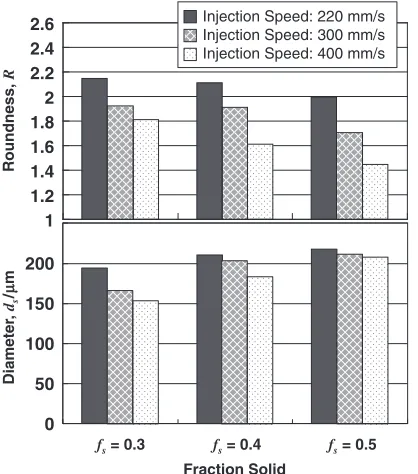
roundness, respectively, of the primary solid particles. Figure 6 shows the weighted mean diameter ds [µm] and area-weighted mean roundness Rs calculated as described
591°C 586°C 581°C
500 μm Holding Temperature
Fig. 3 Microstructure of the alloy after partial melting at various temper-atures. The sample was quenched in water just after holding at each temperature for 10 min.
250 μm
Fig. 2 Microstructure of as-received AZ91D alloy.
Two-Cavity Mold / fs = 0.5 Two-Cavity Mold / fs = 0.4
Two-Cavity Mold / fs = 0.3 Single-Cavity Mold / fs = 0.3
Single-Cavity Mold / fs = 0.4
Single-Cavity Mold / fs = 0.5
Fig. 4 Appearance of the AZ91D injected into permanent molds with an injection speed of 220 mm/s.
500 μm
Fraction Solid
Injection Speed
fs = 0.3 fs = 0.4
400 mm/s
fs = 0.5
220 mm/s
300 mm/s
[image:3.595.315.540.70.165.2] [image:3.595.97.242.71.193.2] [image:3.595.89.509.233.378.2] [image:3.595.306.548.418.637.2]above for each fraction solid and injection speed. The mean diameter reached a maximum of 218 µm forfs=0.5 and the injection speed 220 mm/s. The mean diameter ds has a tendency to decrease with increasing injection speed for the same fraction solid; the ds was 211 and 208 µm when injection speed was 300 and 400 mm/s, respectively. On the other hand, the mean diameter decreased with decreasing fraction solid; thedswas 211 and 195 µm when the fraction solid was 0.4 and 0.3, respectively, for the injection speed of 220 mm/s. Meanwhile, the mean roundness of the solid particles was at its largest value of 2.15 when the fraction solid was 0.3 and the injection speed was 220 mm/s. With increasing injection speed from 300 to 400 mm/s, the mean roundness decreased to 1.92 and 1.81, respectively. The mean roundness tended to decrease with increasing fraction solid for the same injection speed. The particle diameter distribution data is shown in Fig. 7. The peak diameter moves to smaller diameters with increasing injection speed;
fine solid particles smaller than 50 µm were the most common when the injection speed was 400 mm/s.
3.2.3 Effect of injection speed and fraction solid on distribution of solid particles
Figure 8 shows the microstructure in the plane perpendic-ular to the slurryflow direction. The observation point was 50 mm from the gate. The distribution of the solid particles in the thickness direction was nonuniform. The solid particles have a tendency to concentrate in the center of the plate for all conditions. At the injection speed of 300 and 400 mm/s, the density of the solid particles at the surface is low, and, especially at the fraction solid of 0.3, the surface was nearly devoid of solid particles. On the other hand, the solid particles were dispersed in a two-layered structure, at the surface and center of the specimen, in the case that the injection speed was 220 mm/s.
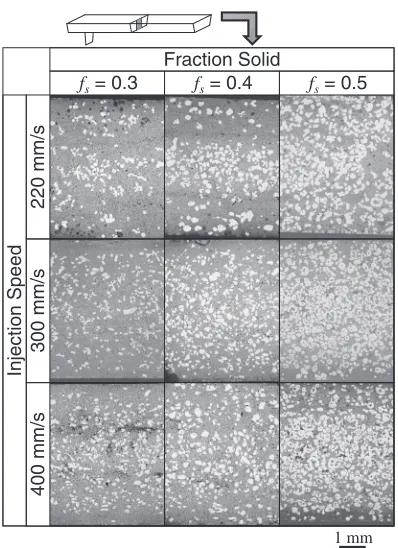
Figure 9 shows the distribution of the solid particles in the entire plate specimen. Figure 9 is composite photograph
by plurality of micrographs, and vertical stripes are caused by non-uniform brightness of microscope field. The solid particles were uniformly dispersed in the center of specimen parallel to the flow direction at the injection speeds of 220 and 300 mm/s. However, the particles were concentrated near the tip of the specimen for the injection speed of 400 mm/s. 4. Discussion
The features of this process are the breaking up of the solid phase by applying shear stress at the nozzle and the dispersion of the solid particles in a liquid phase. For this
0 50 100 150 200 1 1.2 1.4 1.6 1.8 2 2.2 2.4 2.6
fs = 0.5 fs = 0.4
fs = 0.3
Fraction Solid
Diameter
,
ds
/
μ
m
Roundness,
R
Injection Speed: 220 mm/s Injection Speed: 300 mm/s Injection Speed: 400 mm/s
Fig. 6 Effect of injection speed on the roundness and diameter of the solid particles.
50 100 150 200 250 300 350 400 450 Diameter of Solid Particle ds/μm 0.30
0.25
0.20
0.15
0.10
0.05
0.00
Frequency
0.30
0.25
0.20
0.15
0.10
0.05
0.00
Frequency
0.30
0.25
0.20
0.15
0.10
0.05
0.00
Frequency
f
s= 0.3
f
s= 0.4
f
s= 0.5
Injection Speed: 220 mm/s Injection Speed: 300 mm/s Injection Speed: 400 mm/s
[image:4.595.317.533.63.594.2] [image:4.595.67.276.71.308.2]reason, we discuss the change in shear stress caused by different injection speeds and fraction solids as follows.
The shear rate£[1/s] can be calculated from the injection speed S [m/s] and the dimensions of the nozzle and cylinder:12)
£ ¼³4Q
r13; ð1Þ
whereQ[m3/s] is theflow rate through the nozzle given by Q=³r22S,r1[m] is the diameter of the nozzle, andr2[m] is the diameter of the cylinder.
Additionally, the shear stress¸can be described in terms of the apparent viscosity©[Pa·s] as
¸¼£© ð2Þ
[image:5.595.70.269.66.340.2]Ghosh et al.13)described the effect of shear stress on the apparent viscosity at steady state as shown in the plot of Fig. 10; the shear stress was measured by stirring the semi-solid AZ91D slurry. Turng et al.14) also proposed the following approximate expression for the apparent viscosity of a Sn15%Pb semi-solid slurry as a function of the shear rate and fraction solid:
©ð£; fsÞ ¼ 1 fs
fs
mð£Þ
©1ðfsÞ 1þ £ ðfsÞ
£
a
n=a
ð3Þ
wherefs is the critical solid fraction at which the apparent viscosity goes to infinity,©¨(fs) corresponds to the asymptotic viscosity at the infinite shear rate, £(fs) characterizes the transition shear rate between the power-law and Newtonian regions, and,aandnare constants. Equation (3) agrees well with the experimental results of Ghoshet al.by assigning the following values and expressions.
fs¼0:7; mð£Þ ¼1=£; a¼1:26; n¼1:11
©1ðfsÞ ¼0:10 expð1:397fsÞ
£ðf
sÞ ¼264 expð1:88fsÞ
By substituting these into eq. (3), an approximate expression of the apparent viscosity of the AZ91D semi-solid slurry can be obtained;
©ð£; fsÞ ¼ 10f:s7
1=£
0:10 expð1:397fsÞ
1þ 264 expð1:88fsÞ
£
1:26
" #0:88
ð4Þ
The approximate values of the apparent viscosity calculated by eq. (4) for fs=0.189, 0.382, 0.515, and 0.674 describe the dashed lines in Fig. 10.
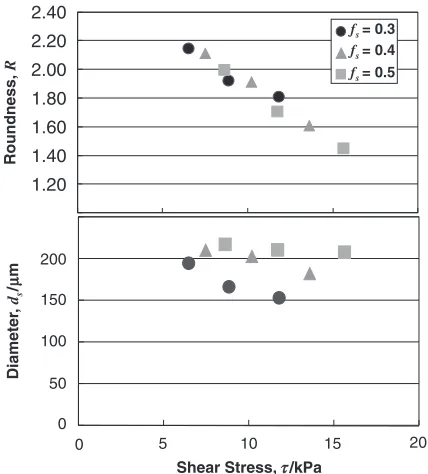
By substituting eqs. (1) and (4) into eq. (2), the shear stress at the steady state can be obtained. Figure 11 shows the relationships between the mean particle roundness and shear stress, and between the mean particle diameter and shear stress, calculated as above. The mean particle roundness decreased with increasing shear stress. It can be concluded that the solid particles deformed into spherical particles when they were subjected to a high shear stress; hence, the mean particle roundness decreased. On the other hand, the mean
Fraction Solid
Injection Speed
fs = 0.5
fs = 0.4
fs = 0.3
220 mm/s
300 mm/s
400 mm/s
1 mm
Fig. 8 Optical micrographs of the center of the specimen in the plane perpendicular to theflow direction.
Injected Direction
0.5mm from Surface
1.5mm from Surface
2.5mm from Surface (Center) Injection Speed : 400 mm/s
0.5mm from Surface
1.5mm from Surface
2.5mm from Surface (Center) Injection Speed : 300 mm/s
0.5mm from Surface
1.5mm from Surface
2.5mm from Surface (Center) Injection Speed : 220 mm/s
[image:5.595.319.546.366.426.2] [image:5.595.70.522.595.770.2]particle diameter was affected not only by the shear stress but also by the fraction solid. This is attributed to the growth of the net-like solid state with increasing fraction solid before injection as seen in Fig. 3. Meanwhile, the mean particle diameter decreased with increasing shear stress for the same fraction solid. Additionally, the number offine solid particles with a diameter smaller than 50 µm increased with increasing injection speed. From these phenomena, the solid phase is considered to be partially broken up and dispersed as fine solid particles (smaller than 50 µm) when the shear stress increased with increasing injection speed.
The apparent viscosity given by eq. (4) is the value at the steady state, so the maximum shear stress at the nozzle is thought to be larger than this value.15)However, the steady-state shear stress has a high correlation with the mean particle diameter and mean particle roundness.
The apparent viscosity of semi-solid slurry depends not only on the shear stress and fraction solid but also on the
shape of the solid particles and agglomeration. If the shape of the solid particles is spherical with a small diameter, the slurry has a low apparent viscosity. Thus, to apply a high shear rate to prevent agglomeration at the nozzle, it is important to improve the fluidity of the semi-solid slurry. In this study, the roundness of solid particles in the slurry was smaller than 2.0 if injection speeds were greater than 300 mm/s, when a shear rate greater than 5.5©104 (1/s). Additionally, solid particles were uniformly dispersed under this condition. On the other hand, at high shear rate conditions, e.g., the injection speed of 400 mm/s, the area of the high fraction solid appears as shown in Fig. 9. It is therefore necessary to consider this problem when develop-ing a castdevelop-ing system.
5. Conclusions
To investigate the effects of the fraction solid and injection speed on the microstructure, experiments on semi-solid forming of AZ91D magnesium were performed. By compar-ison of the microstructure with the shear stress at the nozzle, the following conclusions were obtained.
(1) The net-like solid phase was broken up by applying a high extrusion ratio of approximately 70 in the injection process.
(2) There is a high correlation between the steady-state shear stress at the nozzle and the mean particle roundness, which decreased with increasing shear stress. Meanwhile, the mean particle diameter was affected by both the shear stress and fraction solid, and it decreased with increasing shear stress or decreasing fraction solid. (3) Solid particles in the slurry became spherical and were uniformly dispersed by applying a shear rate greater than 5.5©104(1/s).
(4) At a high injection speed of 400 mm/s, segregated high fraction solid area was observed.
REFERENCES
1) W. G. Cho and C. G. Kang:J. Mater. Process. Technol.105(2000) 269277.
2) H. K. Jung and C. G. Kang:J. Mater. Process. Technol.120(2002) 355364.
3) S. Nafisi and R. Ghomashchi:J. Mater. Process. Technol.174(2006) 371383.
4) K. Miwa: J. Jpn. Soc. Technol. Plast.41(2000) 12101214. 5) R. S. Rachmat, T. Tamura and K. Miwa:Solid State Phenomena116
117(2006) 534537.
6) K. Miwa, R. Rachmat, T. Tamura and Y. Sakaguchi: J. JFS78(2006) 187193.
7) P. A. Joly and R. Mehravian:J. Mater. Sci.11(1976) 13931418.
8) M. C. Flemings: Metall. Mater. Trans. B22(1991) 269293. 9) T. Tsukeda and K. Saito:J. JILM47(1997) 298305.
10) F. Czerwinski:Scr. Mater.48(2003) 327331.
11) Y. F. Zhang, Y. B. Liu, Q. Q. Zhang, Z. Y. Cao, X. P. Cui and Y. Wang:
Mater. Sci. Eng. A444(2007) 251256.
12) The Society of Polymer Science, Japan (eds.):Plastic Kako Gijutsu Handbook, (The Nikkan Kogyo Shinbun, Ltd., 1995) p. 1401. 13) D. Ghosh, R. Fan and C. VanSchilt: The 3rd Int. Conf. on Semi-solid
Processing of alloys and composites, (1994) pp. 8594.
14) L. S. Turng and K. K. Wang:J. Mater. Sci.26(1991) 21732183.
15) D. B. Spencer, R. Mehrabian and M. C. Flemings: Metall. Trans.3
(1972) 19251932.
0.1 1 10 100
10 100 1000 10000
Shear Rate, γ/s-1
Apparent V
iscosity
,
η
/Pa
s
fs= 0.189 fs= 0.382
fs= 0.515
fs= 0.674 fs= 0.725
fs= 0.769
fs= 0.189
fs= 0.382
fs= 0.515 fs= 0.674
[image:6.595.56.286.72.224.2]From eq.(4)
Fig. 10 Comparison of steady-state apparent viscosity with shear rate at various fraction solids for AZ91D.13)Dashed lines show the approximate values calculated by eq. (4).
1.20 1.40 1.60 1.80 2.00 2.20 2.40
fs = 0.3 fs = 0.4 fs = 0.5
Roundness,
R
200
150
100
50
0
0 5 10 15 20
Shear Stress, τ/kPa
Diameter
,
ds
/
μ
m
[image:6.595.62.276.278.515.2]