A Numerical Method for Simulation of Nonlinear Eddy Current Testing Signals
Based on Transient
A
rFormulation
Shejuan Xie
1,2, Yunfei Li
1, Wenlu Cai
1, Hong-En Chen
1, Zhenmao Chen
1,+,
Toshiyuki Takagi
2, Tetsuya Uchimoto
2and Yasuhiko Yoshida
31State Key Lab for Strength and Vibration of Mechanical Structures, Xi’an Jiaotong University, Xi’an 710049, China 2Institute of Fluid Science, Tohoku University, Sendai 980-8577, Japan
3The Kansai Electric Power Company, Mikata-gun, Fukui 919-1141, Japan
To explore the principle and to optimize the nonlinear Eddy Current Testing (ECT) system, a forward numerical analysis code for nonlinear ECT signal simulation is indispensable. In this paper, an edge element numerical code of the transientAr(reducedA) formulation is developed for this purpose. The nonlinear feature of the permeability in each element is taken into account at every time step during step by step numerical integration procedure. The dependence of the third harmonic component of the response signals on the initial permeability is investigated by using the developed code. The qualitative agreement of the simulation and the experimental results demonstrated the feasibility of the proposed simulation method and the corresponding numerical code. [doi:10.2320/matertrans.M2013034]
(Received January 24, 2013; Accepted March 7, 2013; Published April 26, 2013)
Keywords: numerical method, nonlinear Eddy current testing (ECT), transient problem,Armethod, edge element
1. Introduction
Plastic deformation is one of the primary factors leading to material degradation and structural failure for key structural components of large mechanical system such as a nuclear power plant. To ensure the safety of a metallic structure and to reduce the maintenance cost, it is of vital importance to evaluate the level of plastic deformation prior to the initiation of macro defect. Conventional Non-destructive Evaluation (NDE) techniques such as Ultrasonic Testing (UT) and Eddy Current Testing (ECT) are efficient for detecting macro defects (cracks, corrosions etc.), but not effective for the evaluation of the material degradation such as the plastic deformation. Recently, nonlinear ECT method is found applicable for NDE of the plastic deformation in ferromag-netic metallic structures.13)In order to clarify the mechanism of the nonlinear ECT and to improve its detectability, a numerical code is developed in this paper to simulate the nonlinear ECT signals by updating a transient ECT numerical simulation code ofArformulation. Some simulation results of
the nonlinear ECT signals for test-pieces with plastic-damage perturbed permeability are presented in comparison with the measured results as a validation of the proposed method.
2. Transient ECT Simulator of ReducedAMethod 2.1 Principle of nonlinear ECT
In case of conventional ECT, only signal component of the excitation frequency is picked up through a lock-in amplifier, which enables it to exclude the noise of other frequencies. However, if the excitation current of ECT system is not small and the electromagnetic material property of the inspection target is not linear, e.g., carbon steel, super harmonic components may also be induced in the response signal of the pickup coil. As the super harmonic components in the ECT signals depend more closely on the feature of nonlinear
permeability, it has a good possibility to be applied to evaluate the permeability change due to material degradations such as plastic deformation. For this purpose, the nonlinear ECT collects pickup signals without using the lock-in amplifier, which makes it possible to obtain the super harmonic components through a signal processing. Due to the nonlinear material property, the conventional complex approximation is not suitable for the simulation of nonlinear ECT problem. A transient eddy current analysis method with consideration of the nonlinear B-H correlation is necessary to cope with the numerical simulation of nonlinear ECT signals.
2.2 Arformulation for eddy current testing problem TheArmethod, which is proposed by A. Kameariet al.,4,5)
treats the total analysis region in two parts. In the part including the inspection target, full magnetic vector potential
A is adopted as unknown variable, and a reduced vector potentialAr(=AAs, withAthe total vector potential andAs
the vector potential due to the excitation current in free space) is applied to the other part. The discretized FEM equations for these variables are joined together at the boundary layer through using the boundary conditions.
After discretized with the edge element, the governing equation of ECT problem becomes,6,7)
X
e2E Ae0Z
r Ne 1
®r Ne
0 dV
þ @ @t
X
e2Ec
Ae0Z
c
·NeNe0
dVX
e2Etr
Ase0Z
tr r
Ne 1
®0
r Ne0 dV
Z
tr
NeH
sdS¼0 ð1Þ
where As, Hs are respectively the vector potential and the
strength of the magnetic field due to the excitation current placed in a free space,AeAandAseAare the integrals ofAand
Asalong the edge,Neis the vector shape function, andEt,Er
and Etr are the sets of edges indices in the region of
inspection target ³t, region outside the target ³r, together
with the boundary region³trand at the boundary of target¥tr,
respectively. In addition,³is the total region, and³cis the
region in ³tand Eccontains the edges indices in Et where
conductivity is not zero.Etris the set of edges shared by the
sets Et and Er, and E denotes the set of all the edges. The
nonlinear feature of the problem is included in the term with permeability µ that may depend on the state of the local magnetic field. Written in matrix form, the above equations can be rewritten as follows,
½KfAg þ ½C @A
@t ¼ fFgIðtÞ ð2Þ
with I(t) the function of the excitation current, [K], [C] the coefficient matrices and
fFg ¼ X
e2Etr aSe
0Z
tr
r Ne 1
®0
r Ne0 dV
þ Z
tr
NehSdS ð3Þ
where aS and hS are respectively the integrals of the vector
potential and the magnetic field intensity vector along the edges resulting from a unit source.
2.3 Method for simulation of transient ECT signals To simulate the transient eddy current problem, a numerical code using the Crank-Nicholson time domain step calculus method is applicable.69)In practice, by replacing the
time related differential term in eq. (2) with time difference of vector potential referring to time step¦t
@A
@t ¼
AkAk1
t ð4Þ
where Ak=A(t
0+k¦t) witht0 is the initial time and kthe
k-th time step and taking
A¼ªAk1þ ð1ªÞAk ð5Þ
the following recursive linear equations can be obtained for solving the vector potentialAatk-th time step
ð½Kð1ªÞtþ ½CÞfAkg
¼tfMgIðt0þktÞ þ ð½C ½KªtÞfAk1g ð6Þ The coefficient parameterª(0<ª<1) is employed here to improve the integration stability, which is usually selected through a trial and error procedure. Equation (6) can be solved with a normal solver such as the ICCG method.
3. Treatment of the Nonlinear Permeability Term The basic idea to treat the nonlinearity in the magnetic material property is to transform the problem to a series of linear problems based on the transient Ar method. In each
time step (e.g., time ti), the relative permeability µr at any
spatial point is considered independent of time but of value determined by the local magnetic flux density B(ti) at the
present point following a given nonlinear µr-B correlation
(another form of B-H curve, Fig. 1). Based on the permeability distribution, the coefficient matrix of the transientArmethod at the present time step can be calculated
by using
½Ke¼ Z
Ve 1
®r N r NTdV ð7Þ
To avoid error due to the discontinuity of permeability between elements, a distributed permeability is adopted for the calculation of the element coefficient matrix with eq. (7). In practice, the distribution of permeability is taking into account by adopting the permeability at each gauss point as the local value during gauss integration for the element coefficient matrix calculation, i.e., eq. (8)
½Ke¼X
i;j;k
1
®ijkr fNgijk r fNgijkTwiwjwkjJj ð8Þ
where J is the Jocobi matrix,®ijk is the permeability at the
i,j,k-th gauss point, which can be calculated from the local magneticfield with
®ijk¼fðr AijkÞ ð9Þ
where f(B) is a correlation function describing the de-pendence of the permeability on the local magnetic flux density (for isotropic problem). For the carbon steel SS400, the functionffollows a complicated curve as shown in Fig. 1, where a peak permeability appears when B becomes about 0.8 T.
In this way, the nonlinear problem is simplified to a series of transient linear problems but with the spatial permeability distribution being taken into account at each integration step. To reduce the numerical error due to such a linearization process, small time step is necessary during step by step numerical integration. Through trial and error, we find that 100 steps in each sinusoid excitation period are enough to obtain a satisfactory accuracy. Based on the conventionalAr
formulation and the algorithm just described, a numerical code is developed for the nonlinear ECT problem. Figure 2 gives theflowchart of the numerical code. At each time step before termination, the permeability and the coefficient matrix [K] are recalculated.
4. Numerical Examples 4.1 Simulation results
To investigate the feasibility of the proposed method and the corresponding numerical code, nonlinear ECT signals of
[image:2.595.321.534.75.289.2]a typical TR type probe is calculated for a plate test-piece of SS400 carbon steel material. Figure 3 gives structure of the probe and the FEM mesh of the example. The sizes of the pancake coils shown in the Fig. 3 are 10 mm of outer diameter, 4 mm of inner diameter and 5 mm of thickness. The gap between the excitation and the pickup coil is 2 mm, the liftoff of the probe is 0.5 mm and the excitation frequency is adopted as 10 kHz atfirst. 10 periods (1 ms) are integrated step by step with a step length of 1 µs, and the response of the first 2 periods are neglected to omit the transient component due to a suddenly applied current source. In simulation, the total excitation current is applied as 1 A, and the number of turns of both the excitation and the pickup coils are taken as 1000. In addition, the µ-Bcurve given in Fig. 1 is applied to determine the local permeability at each time step.
Figure 4 gives a typical simulation results, with Fig. 4(a) the time history of the response signals, and Fig. 4(b) the spectrum of the pickup response. From both results, it is clear that the super harmonic component in the nonlinear ECT signal can be properly simulated. In Fig. 4(a), the 3rd harmonic component can be observed clearly. In the spectrum of the response signal, the other super harmonic responses can also be recognized though its amplitudes are much smaller than the major component (base frequency). These results are qualitatively identical with the experimental results.
4.2 Experimental setup and typical measurement results
To investigate the validity further, an experimental system is established to measure the nonlinear ECT signals for SS400 test-pieces of different plastic deformation. Due to plastic deformation, the permeability values of the test-pieces are different each other and show increasing feature with applied plastic deformation. By comparing the numerical simulation results for different permeability and the exper-imental results for test-pieces with different plastic defor-mation (i.e., different permeability), the efficiency of the simulation method can be demonstrated qualitatively.
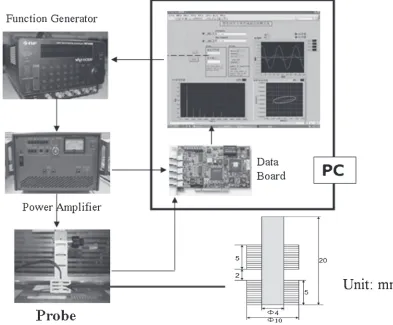
Figure 5 gives a schematic diagram of the nonlinear ECT testing system. A Labview interface was developed to collect and to process the response signals of the pickup coil through a data acquiring board. The sinusoid excitation current is provided with a function generator together with a power amplifier. The response signals and its frequency spectrum are displayed in the monitor and memorized in computer at the same time for further processing. Figure 6 is a photo-graph of the typical test-pieces being inspected. Plastic deformations of up to 10% strain are introduced to the test-pieces through tensile testing by using a MTS material testing machine. The TR type testing probe with same structure shown in Fig. 3 is set to the center of the test-pieces and
Fig. 2 Flow-chart of for nonlinear ECT simulation.
Fig. 3 FEM mesh, location and arrangement of the probe.
(a)
(b)
[image:3.595.62.273.69.242.2] [image:3.595.305.549.70.432.2] [image:3.595.74.260.280.423.2]the nonlinear ECT response signals are measured for 3 different points.
Figure 7 shows the correlation of the amplitude of the measured 3rd harmonic response with the applied plastic deformation. According to the experimental results, the plastic deformation affects the movement and rotation of magnetic domain and may cause change in theB-Hcurve of the damaged material almost linearly. In other word, the x-axis of Fig. 7 can be replaced by the permeability but with a different scale. Almost linear dependence of the 3rd harmonic components on the plastic strains shows a good possibility to apply the super harmonic component to the damage evaluation.
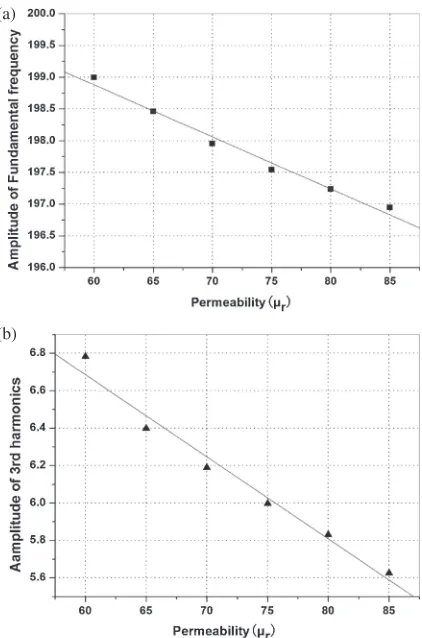
4.3 Comparison of numerical and experimental results To compare the numerical results of this work with those measured in the experiments, the nonlinear ECT response are calculated for the example shown in Fig. 3 with different initial permeability values. The initial permeability in the test-piece is considered distributed uniformly and with a value of 60, 65, 70, 75, 80 and 85 respectively. Figure 8 gives the correlation of the amplitudes of the simulated signals of the base frequency component (in Fig. 8(a)) and the 3rd harmonic component (in Fig. 8(b)) with the change of the initial permeability. In this case, the conductivity of the carbon steel material is taken as a constant for all the cases
Fig. 5 Experimental setup of nonlinear ECT system.
Fig. 6 Three typical test-pieces after plastic deformation.
[image:4.595.97.490.73.398.2] [image:4.595.56.284.444.588.2] [image:4.595.318.532.445.603.2](8.5 MS/m) as it is proved almost unchanged for different plastic deformation.10)
From simulated results such as those shown in Fig. 8, it is obviously that the amplitudes of all the base frequency components and 3rd harmonic components correlated with the initial permeability almost linearly. Comparing with Fig. 7, the results of simulations are in good qualitative agreement with the measured ones.
As the magnetic core is not considered in the numerical simulation, and the B-Hcurve of the base material is used for all the cases, the simulated and measured response signals can not be quantitatively compared directly. How-ever, the change rate of the signal amplitude is comparable. From Fig. 7, one can find that the change rate of the 3rd harmonic is about 2.9% due to 10% strain comparing with the signal of the undamaged material. Referring to Fig. 8(b), one can find that to reduce the amplitude of simulated 3rd harmonic signals 3%, the initial relative permeability have to changes from 60 to about 64, i.e., the
relative permeability was changed about 7% due to a 10% plastic strain.
From experimental results shown in Fig. 7 and the simulated results shown in Fig. 8, we can guess that the mechanism of the nonlinear ECT is most possibly due to the nonlinear feature of the B-H curve, and the plastic deformation may affect the initial permeability up to about 7% for a plastic deformation of 10% residual strain. From the results, one can also conclude that to detect the plastic deformation with the nonlinear ECT is a promising way.
5. Conclusions
In this paper, an edge element numerical code of the transient Ar (reduced A) formulation is developed for
numerical simulation of the nonlinear ECT signals. The nonlinear feature of the permeability in each element is taken into account at every time step with use of nonlinear µ-H
curve during numerical integration. The dependence of the super harmonic components of the response signals on the initial permeability is investigated by using the developed numerical code. The qualitative agreement of the simulation and the experimental results proved the feasibility of the proposed simulation method, and demonstrated that the nonlinear ECT is a very promising candidate for NDE of plastic deformation.
Acknowledgments
This work is supported in part by the National Magnetic Confinement Fusion program of China (2013GB113005) and NSFC (51277139, 11021202). This work is also supported by JSPS Grant-in-Aid for Research Activity Start-up Grant Number 24860005.
REFERENCES
1) D. C. Jiles: NDT&E Int.21(1988) 311319.
2) G. Chen, M. Shiwa and H. Yoneyama: Int. J. Appl. Electromagn. Mech.16(2002) 189196.
3) H. Chen, Y. Li and Z. Chen: Proc. 17th ENDE, (2012). 4) A. Kameari:J. Comput. Phys.42(1981) 124140.
5) H. Fukutomi, T. Takagi, J. Tani, M. Hashimoto, J. Shimone and Y. Harada:IEEE Trans. Magn.33(1997) 21232126.
6) Z. Chen, N. Yusa and K. Miya:Nondestructive Test. Eval.24(2009) 69102.
7) S. Xie, Z. Chen, T. Takagi and T. Uchimoto:IEEE Trans. Magn.47 (2011) 45824591.
8) Y. Li, G. Y. Tian and A. Simm:NDT & E Int.41(2008) 477483. 9) F. W. Fu and J. Bowler:IEEE Trans. Magn.42(2006) 20292037. 10) W. Cai, H. Chen, Y. Li and Z. Chen: submitted to 15th ISEM, (2013)
A109.
(a)
(b)
[image:5.595.65.276.69.388.2]