Morphologies of Some Graphites in Ductile Cast Irons
Takamichi Hara
1,2, Takahiro Kitagawa
2, Kenta Kuroki
2, Seiji Saikawa
3,
Kiyoshi Terayama
3, Susumu Ikeno
4and Kenji Matsuda
3,+1Komatsu Castex Ltd., Himi 935-8501, Japan
2Graduate School of Science and Engineering for Education, University of Toyama, Toyama 930-8555, Japan
3Graduate School of Science and Engineering for Research, University of Toyama, Toyama 930-8555, Japan
4Hokuriku Polytechnic Collage, Uozu 937-0856, Japan
The internal structure of different types of graphite commonly found in the ductile cast iron were investigated by TEM technique for TEM samples prepared by FIB method to understand their nucleation and growth. Spheroidal and vermicular graphite were observed in the ductile cast iron with spheroidizing treatment. Flake graphite was observed in the same cast iron without the spheroidizing treatment. The spheroidal graphite had a three-fold internal structure, with an amorphous-like central region, annual rings of a layered intermediate region, and an outer region made up of large polygonal crystalline platelets in a mosaic-like structure. The vermicular andflake graphite had a similar to that of the outer region of the spheroidal graphite, in that it consisted of similar crystalline platelets. [doi:10.2320/matertrans.M2014167]
(Received May 7, 2014; Accepted June 30, 2014; Published August 8, 2014)
Keywords: ductile cast iron, spheroidal graphite,flake graphite, vermicular graphite, transmission electron microscopy
1. Introduction
Ductile cast iron is a widely used material in vehicles and construction machinery, and has excellent mechanical proper-ties after more than 60 years of research and development.14) Flake graphite enhances the mechanical properties of cast iron,5,6) and spheroidizing has been introduced in order to further improve these properties.1,2) Various mechanisms have been proposed for the nucleation and growth of spheroidal graphite.7,8)
In this study, the microstructure of three types of graphite (flake, spheroidal and vermicular) in ductile iron was investigated by cross-sectional transmission electron microscopy (X-TEM). In order to determine the mechan-ism of spheroidal graphite formation, cross-sectional specimens were produced using focused ion beam (FIB) milling.
2. Experimental Details
2.1 Preparation of ductile iron
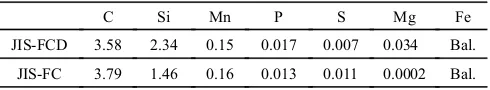
Casting was prepared in a 100 kg high-frequency induction furnace. The melt was superheated to 1784 K. A magnesium treatment was performed using the “sandwich technique” to produce a ductile cast iron. A ferrosilicon alloy containing 4.3%Mg and 1.6%rare earth element was used in the spheroidizing treatment. The casting were inoculated with 0.4 mass% of the charge with Fe-75%Si alloy. Table 1 shows the chemical composition of the cast iron used in the present study. The same alloy was also prepared without spheroidizing treatment in order to compare the morphologies of the spheroidal and flake graphite. The melt was poured into the 25 mm Y-block sand mold. To observe the graphite structure, the metallic matrix was dissolved away by deep etching in a 10% nitric acid solution.
2.2 Preparation of X-TEM samples and observation
Cross-sectional X-TEM specimens of the spheroidal graphite were prepared by FIB (Hitachi FB2100) of µ-sampling method. Rough milling by FIB used an ion beam aperture of 520 µm, intermediate milling used aperture of 300, 150, 80 and 30 µm, and afinal aperture of 15 µm was used to obtain smooth thin sample. A small X-TEM sample was mounted on the copper grid and its one side was welded by tungsten deposition, with an accelerating voltage of 40 kV. The microstructure of the spheroidal graphite was observed by scanning electron microscope (SEM; S-3500H, Hitachi, Co., Ltd.) and TEM (EM-002B, Topcon).
3. Results and Discussions
3.1 Characteristics of graphite at low magnification
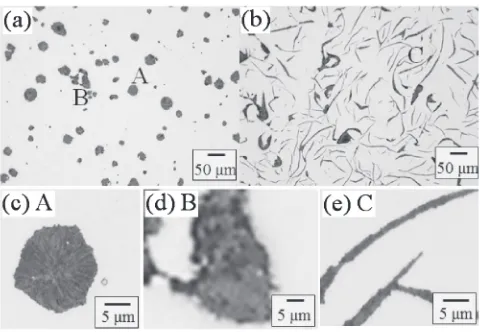
Figure 1 shows typical optical micrographs for graphite in two kinds of ductile iron. Spheroidal and vermicular graphites (labeled “A” and “B”) can be seen in Fig. 1(a). Figure 1(c) is an enlarged image of the spheroidal graphite, which has a circular shape under 2-dimensional observation, while the vermicular graphite had a more complicated shape. Figures 1(b) and 1(e) show flake graphite, which had a 3-dimensional plate shape.
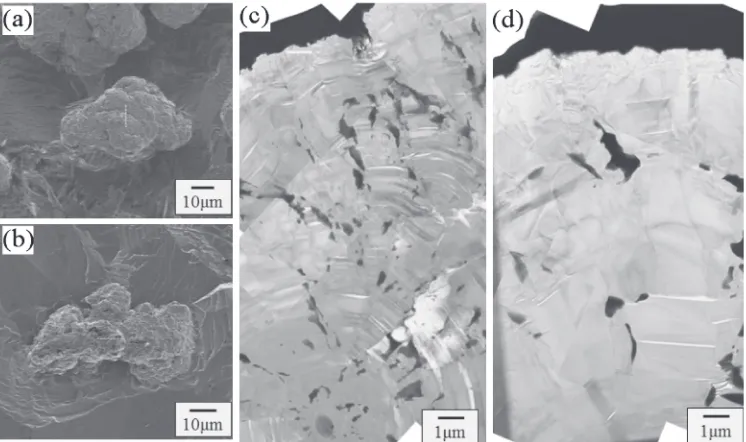
[image:1.595.305.550.346.391.2]After sample surfaces were deeply etched, the matrix was preferentially removed and graphite particles remained on the matrix. The morphologies of graphite was confirmed by FIB secondary ion (SI) imaging. Figure 2 shows secondary electron (SE) images obtained for spheroidal, vermicular and flake graphite. In Fig. 2(a), spheroidal and vermicular graphite particles are indicated by A and B, and enlarged
Table 1 Chemical composition of the alloys (mass%).
C Si Mn P S Mg Fe
JIS-FCD 3.58 2.34 0.15 0.017 0.007 0.034 Bal.
JIS-FC 3.79 1.46 0.16 0.013 0.011 0.0002 Bal.
+Corresponding author, E-mail: matsuda@eng.u-toyama.ac.jp
images are shown in Figs. 2(c) and 2(d). This spheroidal graphite in Fig. 2(c) has a clearly spherical shape with a diameter of approximately 70 µm. The mean diameter of spheroidal graphite in this alloy was about 30 µm, so this graphite particle was more than double the average size. Figure 2(d) shows the vermicular graphite particle marked by B in Fig. 2(a), which appears to be an aggregate of small imperfect spheroidal graphite particle. This structure will be described in a later section. Figure 2(b) shows SE micro-graph for embeddedflake graphite, and (e) is an enlargement of the area indicated by a white dotted square with “C”in Fig. 2(b). This morphology is quite different from spheroidal or vermicular graphite. Morrogh and Oldfield9)reported the formation mechanism for this form of graphite, and proposed that it has a complicated wavyflake-like shape resembling a cabbage.
3.2 Spherical graphite observed by TEM
Figures 3(b)3(h) show X-TEM images obtained from the region marked by a white line on the spherical graphite in (a),
which had a small diameter of about 13 µm. Figure 3(b) shows a TEM image of a thin X-TEM sample. This sample had a complicated curved polycrystalline structure similar to concentric circles, and was not a simple single crystal. Figure 3(c) is an enlarged picture of Fig. 3(b), and it is clear that the central region of this graphite particle (marked by①) did not show any clear feature, whereas regions such as ② and ③ had a thin curved layered structure. A thicker, but similar layered, structure was observed in regions④and⑤. Furthermore, large polygonal crystalline can be seen in regions ④ and ⑤, which appear to have a mosaic-like structure formed by small and many crystalline tailing. Selected-area electron diffraction (SAED) patterns were obtained for points ①⑤in Fig. 3(c), and these are shown in Figs. 3(d)3(h). These patterns are difficult to index accurately, but commonly included the ©0001ª direction of c-axis of graphite structure. Therefore, many of mosaic crystalline in this graphite have the same©0001ªaxis parallel to their thickness direction and perpendicular to the observation direction. Point ① also includes a ©0001ª axis, although it is not clear because it shows 0002 and 1010 diffraction rings. This is similar to the SAED pattern obtained for carbon black.10) There are no other recognizable compounds, such as oxide or sulfide, in the central core (region①).
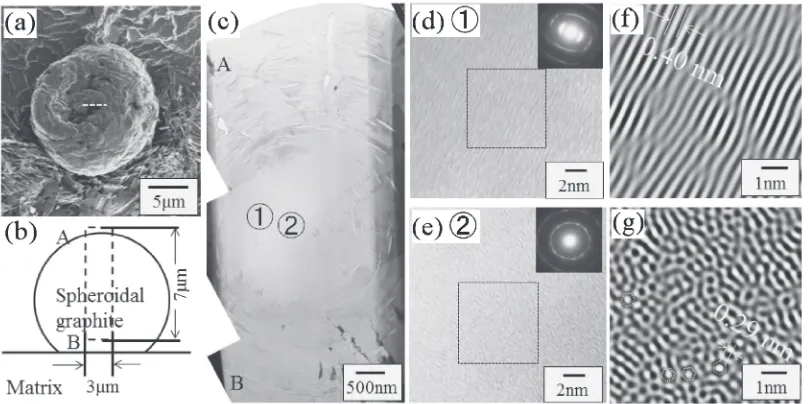
Figure 4(a) shows an X-TEM image of the central region of a spheroidal graphite particle. The dimensions of this X-TEM sample were approximately 7 µm©3 µm, and its thickness was estimated to be 100 nm based on the intensity of the zero-loss peak in electron energy loss spectroscopy. Regions “A” and “B” in Fig. 4(c) correspond to the outer region of spherical graphite, and these regions had a similar layered structure as was shown in Fig. 3(c). On the other hand, the central region indicated by①and②did not show an obvious layered structure. Figures 4(d) and 4(e) show HRTEM images and SAED patterns obtained from regions ① and ②in Fig. 4(c). Discontinuous lattice fringes can be seen in Fig. 4(d), which was obtained from region ①. The
Fig. 2 SE micrographs obtained from deep etched samples. (a) Ductile cast iron, and (b) gray cast iron. (c) Spheroidal, (d) vermicular, and (e)flake graphite marked in (a) and (b) as A, B and C.
Fig. 1 Optical micrographs of polished samples. (a) Ductile cast iron, and (b) gray cast iron. (c) Spheroidal, (d) vermicular, and (e)flake graphite marked in (a) and (b) as A, B and C.
[image:2.595.49.289.68.234.2]processed image is shown in Fig. 4(f ), in which wavy lattice fringes can be seen. The average spacing of these fringes is approximately 0.4 nm, which is close to the lattice constant of c-axis of the graphite structure. The SAED pattern in the inset of Fig. 4(d) was also obtained from region ①, and arc-like 0002 diffracted spots (not ring) were observed. This further supports the disordered structure of the graphite in this region. The mean spacing of the distorted lattice fringes was approximately 0.4 nm, which is close to the lattice spacing of
0.35 nm for {0002} plane in the graphite structure. On the other hand, no clear lattice fringes were obtained from the region ②. The SAED pattern contained a 1100 diffraction ring, as shown in the inset of Fig. 4(e), and a processed image, shown in Fig. 4(g), shows a heavily disordered structure similar to that of an amorphous of metals. There has been a report of simulation of HRTEM images of a fullerene molecule, which resembled a doughnut surrounded by a bright halo when C60 was observed parallel to the [100]C60
Fig. 3 (a) SI micrograph of the spheroidal graphite in a polished sample. (b) TEM brightfield image of a spheroidal graphite obtained from an X-TEM sample prepared from graphite marked by dotted line in (a), (c) an enlarged micrograph of the region marked by a write broken rectangular in (b). (d)(h) SAED patterns obtained from points①⑤in (c).
[image:3.595.163.436.71.339.2] [image:3.595.97.502.400.602.2]direction.11)There is similar contrast in this image, such as distorted hexagons and pentagons. This means that this sample was a mixture of distorted and ordered graphite regions, as well as some amorphous graphite, graphene and fullerenes. There are many reports discussing sulfide, oxide, or nitride cores for the formation of spheroidal graphite, and they are known to be difficult to identify.8) In our TEM observation, only 20% of the spheroidal graphite contained such compounds. Therefore, a sulfide, nitride, or oxide core is not necessary for the formation of spheroidal graphite.
3.3 Flake graphite observed by TEM
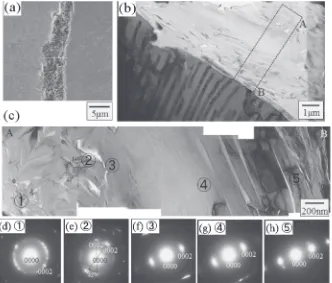
Figure 5 shows SI and TEM micrographs offlake graphite. Figure 5(b) shows the X-TEM image obtained from a thin sample prepared from the sample shown in Fig. 5(a). This sample was a cross section of flake graphite taken perpendicular to its elongated direction. Figure 5(c) shows an enlarged image of the area marked by a dotted black rectangular in Fig. 5(b). There are many flakes withinflake graphite, and the structure near the graphite-pearlite interface (marked by“B”or③⑤in Fig. 5(c)) had a layered structure similar to that of spherical graphite, as shown in Figs. 3(c) and 4(c). Theflake graphite near the original surface of the sample (area marked by①and ②) contained aggregates of small graphite flakes. SAED patterns obtained from points ①⑤ are shown in Figs. 5(d)5(h). Figures 5(e)5(h) obtained for ②⑤ shows 0002 diffraction spots, and
©0001ª direction of graphite are mostly parallel to their thickness. In Particular, region ② contained V-shaped graphite, with the dotted lines drawn perpendicular to the plane of the graphiteflake near region②forming of an angle
of approximately 40 degrees. In the SAED pattern shown in Fig. 5(e), which was obtained from region ②, ©0002ª directions form a similar angle of approximately 42 degrees. Figure 5(d), obtained from region①, shows 0002 diffraction ring because of aggregates consisting of small graphite flakes. These results suggest that each flake of graphite is formed as a layered structure, and its edge or top side includes many small graphitesflake. These layered structure and the smallflakes have a similar orientation relationship to the layered structure in the spheroidal graphite, as shown in Fig. 3. A thin X-TEM sample made from a cross section parallel to the elongated direction (marked a white line in Fig. 6(a)) was prepared to confirm the internal 3-dimensional structure of flake graphite. Figure 6(c) shows an X-TEM image, and Figs. 6(d) and 6(e) show enlarged images of the regions marked by squares ① and ②in Fig. 6(c). Layered structure marked by“B”or②can be seen in Fig. 6(c),④in Fig. 6(d), and⑤in Fig. 6(e), can be seen. Point③contained smallflakes, and its SAED pattern contained 0002 diffraction ring similar to that in Fig. 5(d).
3.4 Vermicular graphites observed by TEM
Figure 7 shows SI and TEM micrographs obtained from two vermicular graphite particles. Figures 7(c) and 7(d) show X-TEM images obtained from thin samples regions marked by white lines in Figs. 7(a) and 7(b), respectively. The two TEM images are clearly similar to each other, and also showed similar features to spherical graphite, which consists of layered mosaic structure. Unfortunately, SAED patterns could not be obtained from these X-TEM samples because of thickness. However, this result means that graphite has other
Fig. 5 (a) SI micrograph of spheroidal graphite in a polished sample, (b) TEM brightfield image of a spheroidal graphite obtained from an X-TEM sample prepared from the graphite region indicated by a write line in (a), (c) an enlarged micrograph of the region indicated by a black broken rectangular in (b), and (d)(h) SAED patterns obtained from points①⑤in (c).
[image:4.595.134.466.70.353.2]morphological features consistent with similar small piece of graphite. This small piece of graphite initially forms a layered structure, then grows larger, and finally begins to take on a mosaic structure. For flake and vermicular graphite, funda-mental mechanisms are the same, and the particle shape is determined by processes of nucleation and growth during solidification. There are many reports describing sulfide, nitride or oxide nuclei of spherical graphite. The present results demonstrate that it is possible to form spherical graphite without sulfide, nitride or oxide nucleus.
Further-more, we have identified an amorphous-like structure in the center of the spherical graphite samples examined in the present work. This result supports the results previously report by He et al.12)
4. Conclusions
Different types of graphite in the ductile cast iron were investigated by TEM using samples prepared by FIB in order to understand their nucleation and growth mechanisms.
Fig. 6 (a) SI micrograph of the spheroidal graphite in a deep etched sample. (b) Schematic diagram of the area used for the preparation of the X-TEM sample from theflake graphite of (a). (c) TEM brightfield image offlake graphite obtained from an X-TEM sample prepared from the graphite marked by a write line in (a) and black broken rectangular in (b). (d) and (e) enlarged TEM brightfield images obtained for points①and②in (c). (f )(h) SAED patterns obtained for points③and④in (d), and⑤in (e).
[image:5.595.150.445.67.326.2] [image:5.595.112.485.395.616.2](1) The spheroidal graphite had a three-fold internal structure, with an amorphous-like central region, annual rings of a layered intermediate region, and an outer region made up of large polygonal crystalline platelets in a mosaic-like structure.
(2) No sulfide, oxide or nitride core was not necessary for the formation of spheroidal graphite.
(3) The internal structure offlake graphite also consisted of thin layers of graphite and large polygonal crystalline platelets in a mosaic-like structure.
(4) The vermicular graphite was an aggregation of spheroidal graphite particles, and its internal structure was complex, consisting of large polygonal crystalline in a mosaic-like structure.
Acknowledgement
The authors thank Mr. Tatsuya Maekawa in our graduate student (present; Komatsu Castex Ltd.,) for his support to obtain a part of data.
REFERENCES
1) H. Morrogh and W. J. Grant: Foundry Trade J.8(1948) 2734. 2) P. A. Gagnebin, D. K. Millis and B. N. Pilling: Iron Age17(1949) 77
84.
3) J. Takeuchi: J. Japan Foundry Eng. Soc.80(2008) 673676. 4) M. Arft and F. Klocke:Procedia CIRP8(2013) 129134.
5) T. Okamoto, A. Kagawa, K. Kamei and K. Matsumoto: Imono 55
(1983) 107112.
6) T. Shiota and S. Komatsu:J. Soc. Mater. Sci. Japan27(1978) 291297.
7) Y. Igarashi and S. Okada: J. Japan Foundry Eng. Soc.70(1998) 329 335.
8) S. Jung and H. Nakae: J. Japan Foundry Eng. Soc.79(2007) 605615. 9) H. Morrogh and W. Oldfield: Iron Steel32(1959) 431434. 10) A. F. Heckman and F. D. Harling:F D. Rubber Chem. Tech.39(1966)
113.
11) A. Goel, B. J. Howard and V. B. J. Sande:Carbon42(2004) 1907 1915.
12) K. He, R. H. Daniels, A. Brown, R. Brydson and V. R. Edmonds:Acta Mater.55(2007) 29192927.