Abstract—This study focuses on how Deploying a Parking Guidance and Information System (PGIS) developments meet the needs of users. The indoor PGIS application integrated smart phones, parking plan and wireless network to achieve the purpose of convenience. This study used the framework of TAM proposed by Davis (1989) and integrated the concept of three external factors, convenience, security and personal innovation to create a “mobile indoor parking guidance information service model”. To validate the model research proposed, this study collected data on the relevant constructs involved in the model by obtaining questionnaires for 160 participants after used this system.
Index Terms—Indoor Parking Guidance and Information System, Technology Acceptance Model, Smartphone, Mobile Device, Application
I. INTRODUCTION
eploying a Parking Guidance and Information System (PGIS) to provide drivers with real-time parking information to solve urban traffic problems caused by the lack of parking spaces. It is an important issue for many countries. Ministry of transportation and Communications (2012) indicated that the registration of the private cars reach 5.91 million in late December. In other words, car ownership rate is 25.3% in Taiwan. The increasing car ownership means traffic congestion and other traffic problems will increase. The figures show the potential future business opportunities of parking industry.
People always suffered from the parking problems whenever traveling, shopping in the weekend. No matter finding parking spaces or forgetting where the car is, excess wasting time even result in the outgoing wishes of reducing. Smartphone users can now access the Internet and search information more easily with built-in keyboards, which allow for rapid data entry. According to the applications combine, wireless network and parking plan to achieve the purpose of practical, time-saving and convenience.
The development of indoor PGIS application is based on
Kuo-Wei Su Author is with the National Kaohsiung First University of Science and Technology, Kaohsiung, Taiwan (corresponding author to provide e-mail: [email protected]).
Chen-Ni Chen Author is with the Department of Information Management , National Kaohsiung First University of Science and Technology, Kaohsiung, Taiwan. (e-mail: [email protected]).
Nai-Hsin Kuo Author was with the Department of Information Management , National Kaohsiung First University of Science and Technology, Kaohsiung, Taiwan. (e-mail: [email protected]).
Hsin-Hui Tseng Author is with the Department of Information Management , National Kaohsiung First University of Science and Technology, Kaohsiung, Taiwan. (e-mail: [email protected]).
theories of usability. The purpose of this study is to explore the factors affecting drivers’ usage intentions of the new service for indoor parking guidance information system combined with wireless network products. The focus of this study is to understand the main factors affecting drivers’ usage intentions of technology acceptance and their perception of this service. Therefore, the purposes of this study are as follows:
1) This study used the framework of TAM to create a "mobile parking guidance information service model". 2) An empirical study was conducted and this study
expected to understand the main factors affecting drivers’ usage intentions of technology acceptance and their perceptions of this service.
3) The result would serve as a reference for authority concerned to promote mobile indoor PGIS application in the future and follow-up studies.
II. LITERATURE REVIEW
A. The Current Status of the Indoor Parking
The growing numbers of automobiles creates not only a host of problems such as air and noise pollution, traffic congestion, but also the demand for parking space. In order to solve this problem, construction of underground car parks has become a well-justified choice because of the limited aboveground land spaces, environmental and aesthetic consideration. Parking facilities include indoor and outdoor private property belonging to a house, the side of the road, a parking lot, indoor and outdoor multi-level structures, shared underground parking facilities, and facilities for particular modes of vehicle such as dedicated structures for cycle parking.
Siemens (2003) integrates information from several car parks and displays it on electronics boards located beside main roads to inform drivers about occupancy levels and let drivers decide where they want to park. The parking space in multi-storey car parks is monitored by ultrasonic sensors which determine the status (occupancy) of individual parking lots. LED displays at the car park guide the drivers to free parking space by the shortest route.
B. Parking Guidance and Information System
Parking guidance information systems (PGIS) typically rely on variable message signs (VMSs) which is used to present information of the direction and available parking spaces at car parks. There are numerous goals for PGIS, including reducing cars searching for available spaces as well as reducing queuing at popular car parks (Polak et al., 1990). A major objective of PGIS is to minimize parking search time
Applying TAM Model to Evaluate the Indoor
Parking Guidance and Information System
Kuo-Wei Su*, Chen-Ni Chen, Nai-Hsin Kuo, and Hsin-Hui Tseng
in central cities and in large parking facilities. The main functions of PGIS are: reducing the travel time of looking for a parking place; increasing the parking facility utilization rate; reducing the traffic caused by the drivers who are looking for a parking lot; balancing parking demand during time and parking lots (Mo, 2007).Parking search can be a significant contributor to solve congestion with cities during peak commute hours.
C. Technology Acceptance Behavior Study Technology Acceptance Model
Based on Theory of Reasoned Action (TRA) and Theory of Planned Behavior (TPB) that provide the theoretical framework for understanding customers’ behavior (Ajzen, 1991; Ajzen & Fishbein, 1980; Fishbein & Ajzen, 1975), the TAM was one of the models most often used to explain users’ intentions to actually use an information system (Davis, 1989). TRA assumes that human beings are basically rational use of information available to them when making decisions. According to TRA, a person’s behavior intention is determined by attitude and subject norm. TPB extended TRA by adding the construct of perceived behavioral control. In TPB, an individual’s behavior can be explained by his or her behavioral intention, which is jointly influenced by attitude, subjective norms, and perceived behavioral control. The purpose of TAM is to provide a conceptualized model with theoretical basis and simplicity for the acceptance of information technology in order to explain or predict the versatile adoption of it (Davis, 1989; Davis, Bagozzi, & Warshaw, 1989).
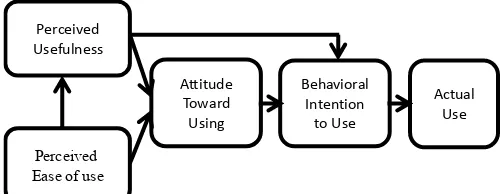
The TAM consists of four constructs (Fig. 1.) including two determining factors to accept information technologies, namely Perceived Usefulness (PU), Perceived Ease of Use (PEOU), Attitude toward using (ATT), Behavioral intention to use (BI) and Actual Use (AU). The impacts of both determining factors on attitude towards the information technology are assumed to be positive. That is when users’ perceptions of usefulness and ease of use to one information technology increase, the users’ positive attitude towards adopting that information technology is more likely. Furthermore, perceived ease of use is assumed to have a positive, direct effect on perceived usefulness while both attitude and perceived usefulness has positive, direct effects on behavioral intention. The TAM has been applied to predict and explain a variety of information technologies and the hypothetical relationships have been widely supported (Chau & Hu, 2001; Gentry & Calantone, 2002; Van der Heijden, 2003; Yu, Ha, Choi, & Rho, 2005).
Other External Factors
1) Convenience
As time passed, the concept of convenience became increasingly important to consumers, especially in a context of information and communication technology (ICT) adoption. Still, little research has been undertaken to define exactly how it could be defined or examined in m-commerce. Berry, Seiders and Grewal (2002) expanded to five types of convenience:(1) decision convenience; (2) access convenience; (3) transaction convenience; (4) benefit convenience; and (5) post-benefit convenience. Convenience is the ability to reduce consumers’ non-monetary costs (e.g., time, energy and effort) when purchasing or using goods and services (Berry et al., 2002; Farquhar & Rowley, 2009). Some firms position themselves as convenience-focused and use this benefit as a source of competitive advantage (Seiders, Berry, & Gresham, 2000).
2) Security
An increasing amount of information is being stored on mobile devices. Indeed, it has been suggested that, in business scenarios, over 80% of new and critical data is now stored in this context (Allen, 2005). Unfortunately, in addition to their capabilities, mobile devices are by their very nature more vulnerable to threats such as theft and accidental loss than larger systems in fixed locations. From a security perspective, the significant consideration here is that these devices may contain possible sensitive or valuable information (Chapman, 2007). In view of these threats, it is reasonable to suggest that security is an increasingly important consideration.
3) Personal innovation
Personal innovation is a key individual difference characteristic influencing the adoption of an innovation, and relates to the users' willingness to embrace a new information technology (Rogers, 2003). Innovative consumers feel less perceived danger and are much more open to new technology (Joseph & Vyas, 1984). They are information explores actively seeking new ideas and accepting the associated dangers and uncertainties (Rogers, 2003).Furthermore, such consumers easily embrace opportunities to buy unfamiliar products and are willing to try new, cutting-edge innovations. In sum, consumers with higher innovation accept new technology more readily (Ko et al., 2010).
III. RESERCH METHODOLOGY
A. Development of Indoor PGIS Application
This study investigated factors affecting drivers’ usage intentions of the application, parking plan and wireless network to achieve the purpose of practical, time-saving and convenience. The prototype was a Java application. Usability refers to whether an application was easy to learn, easy to use, and enjoyable to use for users. Nielsen (1993) separates five attributes for usability goals: (1) Learnability; (2) Efficiency; (3) Memorability; (4) Errors; (5) Satisfaction. According to many usability goals by literatures, we will follow the principles to design our indoor PGIS application to achieve the purpose of practical, time-saving and convenience. This indoor PGIS applications’ framework is shown in Fig. 2. The system operates on an Android mobile operating system;
Perceived
Usefulness
Perceived
Ease of use
Attitude
Toward
Using
Behavioral
Intention
to Use
Actual
[image:2.595.45.297.649.746.2]Use
using a wireless network to connect to the database; the database provides immediate parking plan and business information for users to use; mobile phone feedback information to the database.
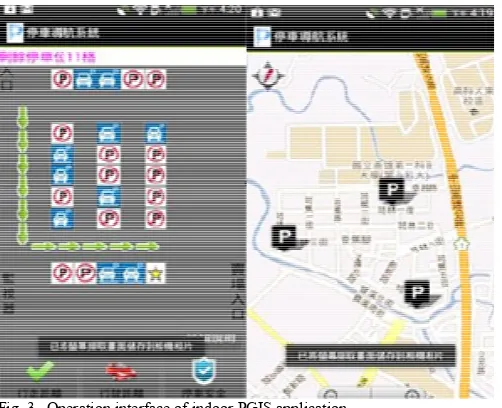
This system can record the current parking location. Therefore, we can save the time for finding parking spaces. Moreover, another feature is the combination of stores to provide consumers with information so that users can know store promotional activities in their car. In a word, this indoor PGIS application can help users to improve the convenience and efficiency of parking. Fig. 3. is the humanized operation interface of the indoor PGIS application.
There are seven characteristics of this system:
1) There is no similar software on the market that is functionally complete and easy to use.
2) This application can be installed in any android devices. 3) The application is practical and easy to operate.
4) The application is combined with Google Map that providing the map with parking locations in the vicinity. 5) Providing the proper parking space effectively and
saving time upon pickup to the driver.
6) Providing needed information for the user from the user ’s point of view.
7) This system can be combined with the industry to achieve mutually beneficial.
Fig. 4. is the operational flowchart of indoor PGIS
application that represents a process showing the steps as boxes.
B. Research Model
This study proposes a research model that describes the factors influencing mobile users’ behavioral intention to use as they search the information for parking. Many researchers suggested that TAM needed to be given additional variables to provide an even stronger model (Legris et al., 2003). Based on TAM and three external factors includes “convenience”, “security”, and “personal innovation” to create an indoor PGIS application service model.
C. Research Hypotheses
Attitude toward technology is directly related to behavioral intentions to use technology. In addition, perceived ease of use is related to perceived usefulness. This leads to the following hypothesis:
H1: Perceived usefulness will directly and positively affect behavioral intention to use.
To investigate the effect of perceived ease of use on perceived usefulness to use the indoor PGIS application. This resulted in a pair of hypotheses:
H2: Perceived ease of use will directly and positively affect behavioral intention to use.
H3: Perceived ease of use will directly and positively affect perceived usefulness.
Many studies conceived that if more convenience can be provided by service providers, consumer’s attention to the provided services and intention of purchasing and using the services will be enhanced. This leads to the following hypothesis:
H4: Convenience will directly and positively affect perceived usefulness
Users download the indoor PGIS application
Open the application
GPS automatically locate the user's location
The application provides nearby parking information
The user drove into the structure or the mall
Provides suitable parking path to the driver
[image:3.595.310.547.84.386.2]Successful Parking
[image:3.595.49.292.115.261.2] [image:3.595.48.299.399.603.2]Fig. 4. Operational flowchart of indoor PGIS application Fig. 2. Framework of indoor PGIS application
If the security of mobile commerce services, including transaction security, data confidentiality, and user authentication that can be assured, user’s intention to use mobile commerce will be seriously affected. This leads to the following hypothesis:
H5: Security will directly and positively affect perceived usefulness.
Consumers easily embrace opportunities to buy unfamiliar products and are willing to try new, cutting-edge innovations. In sum, consumers with higher innovation accept new technology more readily (Ko et al., 2010).
H6: Personal innovation will directly and positively affect perceived usefulness.
D. Experimental Design Participants
The 152 chosen participants aged from 18-50 years old who is the drivers as actual or potential indoor PGIS application users. The participant’s scope of this study is who has the experience of using a smartphone, and most of them are familiar with the basic operations of a smartphone. The participants are students, teachers and personnel from a university.
Environment and Experiment
For each experiment, we observed the behavior during the operation, and ask the participant to fill in a questionnaire. Finally, we analyzed the data and gave results. The system is presented on HTC Sensation XE, which has a capacitive multi-touch screen, 540*960 (4.3 inches) pixels resolution.
Experimental Procedure
Each subject was asked to use mobile handset that we offer and seek information related to the parking space. Specifically, they were asked to operate the application with the mobile device and follow the following oral directions: (1) find the information of available spaces, and (2) select the parking preference. This task took approximately 5 minute to complete. As soon as after performing the task, the participants were asked to respond to a structured questionnaire and indicate the extent of their perceptions according to the items on a five-point scale ("completely disagree" to "completely agree").
Questionnaire Design
Based upon TAM and unique features of the indoor PGIS applications, a self-administered questionnaire was designed and used to collect empirical data. Based on the literature review and specific features of research setting, the questionnaire consisted of two sections. The first section included 26 questions measuring respondents’ perceptions about perceived usefulness, perceived ease of use, convenience, security, personal innovation and their behavioral intention to use. All items were measured with a five-point Likert-type scale ranging from “strongly disagree (=1)” to “strongly agree (=5)”. The second section of the questionnaire is about the respondents’ information with 5 items, namely gender, age, education, occupation, and driving experience via a categorical scale.
Measurements
In order to achieve the purposes of this research and test the hypotheses, the SPSS 20.0 and SmartPLS 2.0.M3 software were employed as the tools analyze the collected data.
IV. RESULTS AND DISCUSSION
A. Descriptive Statistic Analysis
For the final survey, a total of 160 questionnaires were collected. There are 8 missing data among these 160 questionnaires. The valid rate is 95 %.
Characteristics of Samples and Respondents
The results shown 65.5% of respondents are male and 35.5% are female, there are higher percentages of female than male. The largest age consists of subjects at range 21-25 years old with 41.1%. The majority of respondents' education is graduate school with 70.4%. Most of the participants' occupation is student, there are 79.6%. It's 31.6% of participants' driving experience are 2-3 years.
Measurement Results for Relevant Research Variables
The survey includes 6 items of Perceived Usefulness, 4 items of Perceived Ease of Use, 6 items of convenience, 4 items of security, 3 items of Personal Innovation, and 3 items of behavior intention to the indoor PGIS application. For the construct of perceived usefulness and perceived ease of use, there were high scores of agreement on the measurement items with scores almost all over 4.0 in a 5-point Likert scale. It shows that service providers are required to offer service contents practically valuable to users to enhance the practicality of this service and they should contemplate how to make users feel the service is easy to learn and use. We discovered that convenience, security, and personal innovation, there were high scores of agreement on the measurement items with scores almost all over 3.7. For these factors, personal innovations’ score is higher than the others. The score of convenience is almost under 4.0 that is lowest than the others. The reason probably was that mobile phones are becoming penetrable. Usage of applications is easier than past, convenience is in a high level now. However, the score of behavior intention is almost all over 4.1, it means that drivers probably adapt the indoor PGIS application.
B. Reliability and Validity Analysis
The degree of characteristic or functions that can be measured from the research or the tools used is validity. The higher the validity, the higher the real characteristics of research target can be shown from the result of the measurement, which is the most important condition in any research tool.
Exploratory Factor Analysis (EFA)
In this study, all of the Cronbach’s α values are greater than 0.7, which indicating that all of the constructs have high reliability. These reasons further confirm the reliability of the measurement items.
C. Structural Equation Model
estimation. The purpose of measurement model estimation is to specify the pattern by which each measure (e.g. indicator or items question in this study) loads on a particular factor (e.g. construct or variable in this study) and to assure the reliability and validity of measurements and constructs (Tao, 2008).
Convergent Validity
It has been suggested that AVE should be greater than 0.5 to justify using a construct (Barclay, Thompson, & Higgines, 1995).The results of convergent validity of the model are showed in TABLE I. In this study, the result shows that all the value of AVE is larger than 0.5. Thus, convergent validity is considered to be satisfactory.
Discriminant Validity
To satisfy the requirements of discriminant validity, the AVE of two constructs must be more than the squared of the correlation between the given two constructs.
TABLE II shows the result of the calculated average variance extracted and the squared correlation between constructs. Each AVE value is found to be more than squared correlation, thus discriminant validity is supported.
Evaluation of Reliability
The construct reliability (CR) refers to the ability of measured items to tap a similar underlying construct. The construct reliability will be high if the correlation of items is high. The rule of thumb for both coefficients is 0.6, which is considered acceptable for exploratory purposes. 0.7 is adequate for confirmatory purposes, 0.8 is good for confirmatory purposes, and 0.9 is excellent for confirmatory purposes (George & Mallery, 2003; Nunnally & Bernstein, 1994). So in this study, 0.7 was used as the threshold of construct reliability.
Table III shows that the construct reliability ranges from 0.8118 to 0.9526, all of the values are exceeding the recommended minimums. Thus, this measurement model
indicates a high degree of reliability.
V. CONCLUSIONS
A. Conclusions
The indoor PGIS application, we developed based on theories of usability. Nevertheless, in this research, our focus is to understand the main factors affecting drivers’ usage intentions of technology acceptance and their perceptions of this service by extending TAM. For this purpose, this study modified the TAM and created a “mobile indoor parking guidance information service model”.
Firstly, it can be discovered from the previous analysis that the factors that affect user’s intention of use for the indoor PGIS application are “perceived usefulness” and “perceived ease of use”. In the aspect of perceived usefulness, it is conceived that service providers are required to offer service contents practically valuable to users to enhance the practicality of this service. In the aspect of perceived ease of use, service providers should contemplate how to make users feel the service is easy to learn and use. Further, it can be discovered from the standardized regression coefficients that the intensity of perceived usefulness is stronger than that of perceived ease of use. This indicates that the main factor that affects user’s adoption of the indoor PGIS application is user’s perception of the practicality of the service. In other words, it is the level of perceived usefulness that determines user’s intention to use the indoor PGIS application. If the level of perceived usefulness is more positive, user’s intention of use will be more evident.
The secondary factor is user's perception of the ease of use offered by the indoor PGIS application. That is to say, when users consider the indoor PGIS application as easy to use, their intention of using the service will be significantly affected. Simply put, it is necessary to make users feel that the service is effectively useful at first, and emphasize it is easy to learn and use, so as to promote their intention of use.
In the external variables, we discovered that convenience, security and personal innovation would significantly affect perceived usefulness.
B. Limitations
Although the research has reached its aims, there were some unavoidable limitations. First of all, because of the time is limited, this research was conducted only on a small size of population who are in Taiwan. In order to have better result for a larger group, the study should have greater number of participants with different ages, incomes, occupations, TABLEI
AVERAGE VARIANCE EXTRACTED (AVE)
Construct AVE>0.5
Perceived Usefulness (PU) 0.5263 Perceived Ease of Use (PEOU) 0.7530 Convenience (CON) 0.5592 Security (SEC) 0.6471 Personal Innovation (PI) 0.6652 Behavioral intention (BI) 0.8704
TABLEII
DISCRIMINANT VALIDITY TABLE Constr
uct PU PEOU CON SEC PI BI
PU 0.753
PEOU 0.520 0.868 CON 0.594 0.740 0.748 SEC 0.232 0.038 0.186 0.804 PI 0.666 0.458 0.451 0.079 0.816 BI 0.676 0.526 0.565 0.223 0.788 0.933
Remark: PU: Perceived Usefulness; PEOU: Perceived Ease of Use; CON: Convenience; SEC: Security; PI: Personal innovation; BI: Behavioral Intention to Use
TABLEIII RELIABILITY TEST RESULT
Construct CR>0.7
[image:5.595.312.550.91.183.2]salaries, genders, etc. Finally, since the designed questionnaire to measure consumers’ behavioral intention is only used in Taiwan, it seems provide not enough contribution to practical experience. Thus, the result should be compared with some different countries. In the future, better research can be done by pay more attention to this study's limitations.
C. Future Work
In this study, we used TAM model to understand the main factors affecting drivers’ usage intentions of technology acceptance and their perceptions of this service, future research can still be adopted by other behavioral theory as a basis for the development of framework, such as UTAUT or other theories. In addition, future researchers can put other factors that could affect the behavioral intention of indoor PGIS application into consideration.
This study discusses with the individual user's perspective. However, the researchers still could follow the other scope of the research object to be explored. For example, future researchers can target groups, organizational units, or by industry for sampling and analysis, to explore the use of driver's intention for indoor PGIS application.
REFERENCES
[1] Ajzen, I. (1991). The theory of planned behavior. Organizational Behavior and Human Decision Processes, 50(2), 179-211.
[2] Ajzen, I., & Fishbein, M. (1980). Understanding attitudes and predicting socialbehavior. Englewood Cliffs: Prentice-Hall, Inc. [3] Allen M. (2005). A day in the life of mobile data. Mobile Security.
British Computer Society. Available from: http://www.bcs.org/server.php?show=conWebDoc.2774
[4] Anckar, B., & Incau, D. (2002). Value Creation in Mobile Commerce: Findings from a Consumer Survey. Journal of Information Technology Theory, 4(1), 43.
[5] Barclay, D., Thompson, R., & Higgines, C. (1995). The partial least squares (PLS) approach to causal modeling: Personal computer adoption and use an illustration. Technology Studies, 2(2), 285-309. [6] Barry, M., & Ruther, H. (2005). Data collection techniques for informal
settlementupgrades in Cape Town, South Africa. URISA Journal, 17(1), 43-52.
[7] Bellman, S., Lohse, G. L., & Johnson, E. J. (1999). Predictors of online buying behavior. Communications of the ACM, 42(12), 32-38. [8] Berry, L.L., Seiders, K., & Grewal, D. (2002). Understanding service
convenience. Journal of Marketing, 66(3), 1-17.
[9] Bicheno, S. (2012). Global Smartphone Installed Base Forecast by Operating System for 88 Countries: 2007 to 2017. Retrieved from
strategy analytics website: https://www.strategyanalytics.com/default.aspx?mod=reportabstractvi
ewer&a0=7834
[10] Boehm, D.A., Marcus, A., Green, P.A., Hada, H., & Wheatley, D. (2003). The Next Revolution: Vehicle User-interfaces and the Global Rider/Driver Experience. Extended abstracts of human factors in computing systems. 708-709.
[11] Brown, L. G. (1989). The Strategic and Tactical Implications of Convenience in. 55 Consumer Product Marketing. Journal of Consumer Marketing, 6(3), 13-19.
[12] Bruner, G. C., & Kumar, A. (2005). Explaining consumer acceptance of handheld Internet devices. Journal of Business Research, 58(5), 553-558.
[13] Burdette, D. (2001). An evaluation of advanced parking information systems at airports Preprint. Transportation Research Board Annual Meeting, Washington D.C.
[14] Byrne, B. (2001). Structural equation modeling with AMOS: Basic concepts, application and programming. Mahwah, NJ: Lawrence Erlbaum Associates, Inc.
[15] Campbell, D., & Fiske, D. (1959). Convergent and discriminant validation by the multitrait-multimethod matrix. Psychological Bulletin, 56(4), 81-105.
[16] Carlsson, C., & Walden, P. (2002). Mobile Commerce: A summary of quests for Value-added products and services. In the proceedings of
15th Bled Electronic Commerce conference, e-Reality: Constructing the e-economy, Bled, Slovenia.
[17] Chapman, M. (2007). Mobile phone users oblivious to data threats.
Available from: http://www.vnunet.com/vnunet/news/2188621/mobile-phone-users-ob
livious
[18] Chau, P. (1996). An empirical assessment of a modified Technology Acceptance Model. Journal of Management Information Systems, 13(2), 185-203.
[19] Chau, P. Y. K., & Hu, P. J. H. (2001). Information technology acceptance by individualprofessionals: A model comparison approach. Decision Sciences, 32(4), 699-719.
[20] Chen, L., Gillenson, M. L., & Sherrell, D. L. (2002). Enticing online consumers: An extended technology acceptance perspective. Information& Management, 39(8), 705-719.
[21] Davis, F. D. (1989). Perceived usefulness, perceived ease of use, and user acceptance of information technology. MIS Quarterly, 13(3), 319-340.
[22] Davis, F. D., Bagozzi, R. P., & Warshaw, P. R. (1989). User acceptance of computer technology: A comparison of two theoretical models. Management Science, 35(8), 982-1003.
[23] Davis, F. D., Bagozzi, R. P., & Warshaw, P. R. (1992). Extrinsic and intrinsic motivation to use computers in the workplace. Journal of Applied Social Psychology, 22(1), 1111-1132.
[24] Dennis, S. F. (2006). Prospects for qualitative GIS at the intersection of youth development and participatory urban planning. Environment & Planning, 38(11), 2039-2054.
[25] Duncan, S. L., & Lach, D. J. (2006). GIS technology in natural resource management: process as a tool of change. Cartographica: The International Journal for Geographic Information and Geovisualization, 41(3), 201-215.
[26] Dunlop, M., & Brewster, S. (2002). The challenge of mobile devices for human computer interaction, Personal and Ubiquitous Computing, 6(4), 235-236.
[27] Dunn, C. E. (2007). Participatory GIS: a people’s GIS? Progress in Human Geography, 31(5), 616-637. doi:10.1177/0309132507081493 [28] Elwood, S. (2006). Critical issues in Participatory GIS:
deconstructions, reconstructions, and new research directions. Transactions in GIS 10, 693-708.
[29] Elwood, S. A. (2001). GIS and collaborative urban governance: understanding their implications for community action and power. Urban Geography 22, 737-759.
[30] Fang, X., Chan, S., Brzezinski, J., & Xu, S. (2006). Moderating effects of task type on wireless technology acceptance. Journal of Management Information Systems, 22(3), 123-157.
[31] Fang, X., Chan, S., Brzezinski, J., & Xu, S. (2006). Moderating effects of task 57 type on wireless technology acceptance. Journal of Management Information Systems, 22(3), 123-157.
[32] Kuo-Wei Su, Cheng-Yuan Chen & Nai-Hsin Kuo (2013). Applying TAM Model to Explore Usage Intentions of Indoor Parking Guidance and Information System.