Original Article
Identification of a novel miRNA-target gene regulatory
network in osteosarcoma by integrating
transcriptome analysis
Chunlei He1, Hui Gao1, Xiaona Fan2, Maoyuan Wang1, Wuyang Liu1, Weiming Huang1, Yadong Yang1
1Department of Orthopedics, First Affiliated Hospital of Gannan Medical University, Ganzhou 341000, Jiangxi
Province, China; 2Gannan Medical University, Ganzhou 341000, Jiangxi Province, China
Received December 26, 2014; Accepted February 23, 2015; Epub July 1, 2015; Published July 15, 2015
Abstract: Osteosarcoma remains a leading cause of cancer death in children and young adolescents. Although the introduction of multiagent chemotherapy, survival rates have not improved in two decades. Therefore, it is urgently needed to know the details regarding molecular etiology to driving therapeutic inroads for this disease. In this study we performed an integrated analysis of miRNA and mRNA expression data to explore the dysregulation of miRNA and miRNA-target gene regulatory network underlying OS. 59 differentially expressed miRNAs were identified, with 28 up-regulated and 31 down-regulated miRNAs by integrating OS miRNA expression data sets available. Using miRWalk databases prediction, we performed an anticorrelated analysis of miRNA and genes expression identified by a integrated analysis of gene expression data to identify 109 differently expressed miRNA target genes. A novel miRNA-target gene regulatory network was constructed with the miRNA-target gene pairs. miR-19b-3p, miR-20a-5p, miR-124-3p and their common target CCND2, the nodal points of regulatory network, may play important roles in OS. Bioinformatics analysis of biological functions and pathways demonstrated that target genes of miRNAs are highly correlated with carcinogenesis. Our findings may help to understand the molecular mechanisms of OS and identify targets of effective targeted therapies for OS.
Keywords: Integrated analysis, miRNA expression data, osteosarcoma, miRNA target genes
Introduction
Osteosarcoma (OS) is the most common pri-mary bone malignancy in children and young adolescents characterized by malignant oste-oid production and osteoblastic differentiation. After the introduction of multiagent chemother-apy in the 1980s, the 5-year survival rate has increased to approximate 60%-65% for patients without evidence of metastasis [1]. However, for patients with recurrent or metastatic OS, the prognosis is still very poor [2]. Therefore, it is urgently needed to identify the details regard-ing tumor progression and to discover new insights into novel therapy strategies for this disease.
MicroRNA (miRNA) are small (~22 nucleotides) non-coding RNAs, which negatively regulates gene expression by binding to the 3’-untrans-lated region (3’-UTR) of their target mRNA [3].
Thus, over-expression of miRNAs usually gives rise to the deceased expression of target genes. Amounts of evidence show that miRNA are deregulated in various types of cancer and play crucial roles in tumor formation and develop-ment [4, 5]. miRNAs is still considered to be applied in diagnosis and prognosis as well as eventual therapy of malignant neoplasm [6]. Complex genomic aberrations and highly vari-able patterns of gene expression were detected in conventional OS [7]. With advances in molec-ular biology, emerging evidence using microar-ray-based approaches shows that miRNAs were deregulated in human OS compared to bone, osteoblasts and mesenchymal stem cells
[8-11]. In addition, some studies identified their
gene. miR-20a promotes OS metastasis by down-regulating Fas expression [12]. miR-155 involves in oncogenic regulation of OS progres-sion such as proliferation, invaprogres-sion and
migra-tion [13]. Despite these findings, the progress
and development of the disease are still not clearly elucidated.
High-throughput technologies could be used for systematic researches on complex molecu-lar processes in diseases, such as OS. Over the last two decades, many mRNA and miRNA expression studies have been performed by using microarray, a high-throughput technology to more comprehensively increase knowledge about the cellular and molecular changes in OS. However, miRNA-mRNA regulatory net-works based on miRNA and mRNA expression data has not been previously elucidated. In this study, we integrated miRNA dysregulation and altered mRNA expression that occur in OS to construct identify miRNA-mRNA regulatory net-works, which may provide novel insights for innovative diagnostic and treatment strategies of OS, In addition, our study would help to understand the pathology of OS.
Materials and methods
Eligible miRNA expression profiling and data
preprocessing
We searched the Gene Expression Omnibus database (GEO, http://www.ncbi.nlm.nih.gov/ geo) and ArrayExpress (http://www.ebi.ac.uk/
arrayexpress/), for miRNA expression profiling
studies in OS. We only retained miRNA
expres-sion profiling studies between OS and normal
tissues by microarray. The raw microarray data
was firstly downloaded from GEO and Array
Express. The log2 transformation, background correction and Quantile normalization were performed for the downloaded original microar-ray data by MATrix LABoratory (MATLAB) software.
Differential analysis of miRNA
Based on the pretreatment results of miRNA expression values, two-tailed Student’s t-test was used to identify the differently expressed miRNA in OS compared to the normal tissues.
[image:2.612.91.289.98.726.2]P-values and effect sizes of individual microar-ray study were obtained. P-values from multiple studies were combined by Fisher’s method, and effect sizes from multiple studies were
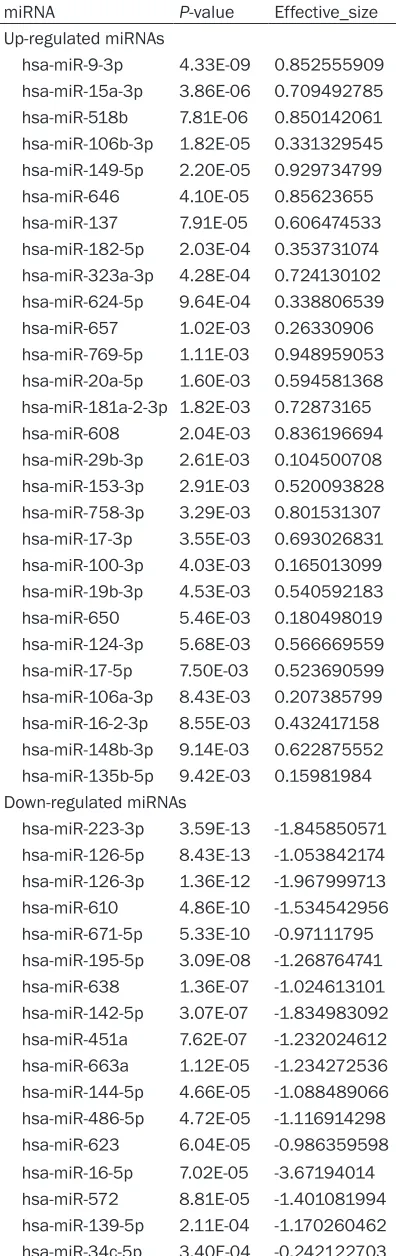
Table 1. List of differentially expressed miR-NAs
miRNA P-value Effective_size Up-regulated miRNAs
hsa-miR-9-3p 4.33E-09 0.852555909 hsa-miR-15a-3p 3.86E-06 0.709492785 hsa-miR-518b 7.81E-06 0.850142061 hsa-miR-106b-3p 1.82E-05 0.331329545 hsa-miR-149-5p 2.20E-05 0.929734799 hsa-miR-646 4.10E-05 0.85623655 hsa-miR-137 7.91E-05 0.606474533 hsa-miR-182-5p 2.03E-04 0.353731074 hsa-miR-323a-3p 4.28E-04 0.724130102 hsa-miR-624-5p 9.64E-04 0.338806539 hsa-miR-657 1.02E-03 0.26330906 hsa-miR-769-5p 1.11E-03 0.948959053 hsa-miR-20a-5p 1.60E-03 0.594581368 hsa-miR-181a-2-3p 1.82E-03 0.72873165 hsa-miR-608 2.04E-03 0.836196694 hsa-miR-29b-3p 2.61E-03 0.104500708 hsa-miR-153-3p 2.91E-03 0.520093828 hsa-miR-758-3p 3.29E-03 0.801531307 hsa-miR-17-3p 3.55E-03 0.693026831 hsa-miR-100-3p 4.03E-03 0.165013099 hsa-miR-19b-3p 4.53E-03 0.540592183 hsa-miR-650 5.46E-03 0.180498019 hsa-miR-124-3p 5.68E-03 0.566669559 hsa-miR-17-5p 7.50E-03 0.523690599 hsa-miR-106a-3p 8.43E-03 0.207385799 hsa-miR-16-2-3p 8.55E-03 0.432417158 hsa-miR-148b-3p 9.14E-03 0.622875552 hsa-miR-135b-5p 9.42E-03 0.15981984 Down-regulated miRNAs
ducted a regulatory network of miRNAs and
genes in OS with the identified miRNA-target
gene interacting pairs, and visualized with Cytoscape [19].
Functional annotation
To gain insights into the biological functions of miRNA target genes, we performed Gene ontol-ogy (GO) functional and Kyoto Encyclopedia of Genes and Genomes (KEGG) pathway enrich-ment analysis. GO provides a common descrip-tive framework and functional annotation and
classification for analyze the gene sets data.
KEGG pathway database is a recognized and comprehensive database including all kinds of biochemistry pathways [20]. The online based software GENECODIS was utilized in this analy-sis [21].
Results
Differentially expressed miRNAs in OS
In this work, we collected one expression profil -ing study respectively in GEO database (Acc- ession: GSE28425) and ArrayExpress (Acce- ssion: E-MTAB-1136), including 16 samples of OS and 56 samples of normal control. After nor-malization of the original miRNA expression
profiling, we performed miRNA differential
ex-pressed analysis between OS and normal con-trol samples using MATLAB. Finally, 59 miRNAs
were regarded as significantly differentially
expressed under the threshold of P-value < 0.01, with 28 up-regulated and 31 down-regu-lated miRNAs (Table 1).
Identification of differently expressed miRNA
target genes
To know target genes of differentially expressed miRNA in OS, bioinformatics prediction was performed by miRWalk database. In addition we compared the predicted target genes rec-
orded by ≥ 4 algorithms, to gene expression profiling data from an integrated analysis con -ducted by Zuozhang Yang. As a result, we
iden-tified 158 miRNA-target gene pairs for 10
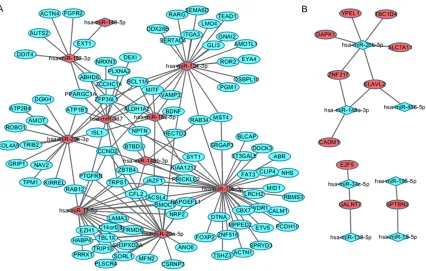
up-regulated miRNA, and 15 miRNA-target gene pairs for 7 down-regulated miRNA (Table 2). Regulatory network of miRNAs and target
genes
The miRNA-target genes regulatory network in OS was constructed with the miRNA-target hsa-miR-32-3p 3.45E-04 -0.95081882
hsa-miR-557 4.81E-04 -0.985588105 hsa-miR-146b-5p 5.77E-04 -1.562558191 hsa-miR-135a-3p 1.27E-03 -1.183892229 hsa-miR-150-5p 1.37E-03 -1.277301371 hsa-miR-26b-5p 2.15E-03 -1.943465941 hsa-miR-302d-3p 2.90E-03 -3.123108199 hsa-miR-659-3p 3.94E-03 -1.194627283 hsa-miR-335-5p 4.09E-03 -2.224509509 hsa-miR-217 4.14E-03 -2.969063299 hsa-miR-200a-5p 4.74E-03 -1.031405471 hsa-miR-148a-3p 7.52E-03 -0.15955827 hsa-miR-652-3p 9.43E-03 -2.274455133 hsa-miR-135b-3p 9.72E-03 -2.59797485
combined by the random effects model. The thresholds for differentially expressed miRNAs were P-value < 0.01.
Bioinformatics prediction of miRNA targets
As miRNAs function by down-regulating the expression of target genes, bioinformatics pre-diction of miRNA targets is important for the research of miRNA function. The target genes of differentially expressed miRNAs were pre-dicted by 6 bioinformatic algorithms (DIANAmT, miRanda, miRDB, miRWalk, PICTAR and Targe- tscan) by the online tools of miRWalk (http:// www.umm.uni-heidelberg.de/apps/zmf/mir-walk/) [14].
Combining predicted targets with gene expres
-sion profiling
Due to the reversely correlated expression between miRNA and its target genes, we com-bined predicted targets with gene expression
profiling which was available in an recently pub -lished integrated analysis of 8 microarray data-sets (PMID: 25023069) [15]. The target genes
recorded by ≥ 4 algorithms were selected to compare with the gene expression profiling
data, and we selected microRNA-target gene pairs with opposing expression patterns to sub-ject to further investigation [16-18].
Constructing regulatory network between miR -NAs and their targets
The posttranscriptional regulatory network is
defined as a directed and bipartite graph in
con-Table 2. The 109 miRNA-target gene pairs reversely correlated with the expressions of 17 differentailly expression miRNAs
miRNA Regulation (miRNA) Count of targets Target Genes
hsa-miR-124-3p up 22 AMOTL1, BCL11A, CCND2, DDX26B, EYA4, GLI3, GNAI2, HECTD2, ITGA3, LMO4, MITF, MST4, OSBPL10, PGM1, RAB34, RARG, ROR2, SEMA6D, SERTAD4,TEAD1, VAMP3, ZFP36L1
hsa-miR-137 up 12 ABHD6, ALDH1A2, ATP1B1, DEXI, MITF, NRXN3, PLXNA2, PPARGC1A, PTGFRN, SYT1, TRPS1, ZBTB4
hsa-miR-139-5p down 1 GALNT7
hsa-miR-148a-3p down 3 CADM1, ELAVL2, ZNF217
hsa-miR-148b-3p up 6 BTBD3, CFL2, KIAA1217, NPTN, PRICKLE2, RAB34
hsa-miR-149-5p up 1 EXT1
hsa-miR-153-3p up 8 ACTN4, AUTS2, DDIT4, EXT1, FGFR2, NPTN, PPARGC1A, ZCCHC14
hsa-miR-16-5p down 1 SPTBN2
hsa-miR-17-5p up 21 ACSL4, C14orf28, CCND2, CFL2,EZH1, FRMD6, HABP4, JAZF1, LAMA3, NRP2, PRRX1, PTGFRN, RAB12, RAPGEFL1, SH3PXD2A, SMOC1, SORL1, TBL1X, TRIP10, TRPS1, ZBTB4
hsa-miR-182-5p up 9 BCL11A, BDNF, ISL1, JAZF1, KIAA1217, MITF, VAMP3, ZCCHC14, ZFP36L1
hsa-miR-195-5p down 1 SPTBN2
hsa-miR-19b-3p up 37 ABR, ACSL4, ACTN1, BLCAP, CALM1, CBX7, CCND2, CLIP4, DOCK3, DTNA, ETV5, FAT3, FOXP2, JAZF1, KIAA1217, LRCH2, MID1, MPPED2, MST4, NHS, NPTN, NRP2, PCDH10, PRICKLE2, RAB34, RAPGEFL1, RBMS3, SMOC1, SPRYD3, SRGAP3, ST3GAL5, SYT1, TRPS1, TSHZ3, WDR1, ZBTB4, ZNF516
hsa-miR-20a-5p up 26 ACSL4, ANO6, C14orf28, CCND2, CFL2, CSRNP3, EZH1, FRMD6, HABP4, HECTD2, JAZF1, LAMA3, MFN2, NRP2, PLSCR4, PRRX1, PTGFRN, RAB12, RAPGEFL1, SH3PXD2A, SMOC1, SORL1, TBL1X, TRIP10, TRPS1, ZBTB4
hsa-miR-26b-5p down 6 DAPK1, ELAVL2, SLC7A11, TBC1D4, YPEL1, ZNF217
hsa-miR-29b-3p up 16 AMOT, ATP1B1, ATP2B4, BCL11A, CCND2, COL4A5, DGKH, GRIP1, ISL1, KIRREL, NAV2, RAB12, ROBO1, TPM1, TRIB2, ZFP36L1
hsa-miR-34c-5p down 2 E2F5, GALNT7
[image:4.792.93.699.84.341.2]hsa-miR-486-5p down 1 ELAVL2
Table 4. KEGG pathway enrichment analysis of differential expression miRNA target genes (Top 15)
KEGG ID KEGG term Count FDR Genes
hsa04510 Focal adhesion 9 1.34E-04 TLN1, LAMA3, ACTN4, CCND2, BCL2, ACTN1, ITGA3, ITGB3, COL4A6
hsa04360 Axon guidance 6 3.14E-03 GNAI2, SEMA6D, ROBO1, PLXNA2, CFL2, SRGAP3
hsa05200 Pathways in cancer 8 1.28E-02 FGFR2, LAMA3, BCL2, MITF, RUNX1T1, ITGA3, GLI3, COL4A6 hsa05412 Arrhythmogenic right ventricular cardiomyopathy (ARVC) 4 2.13E-02 ACTN4, ACTN1, ITGA3, ITGB3
hsa04810 Regulation of actin cytoskeleton 6 2.54E-02 FGFR2, ACTN4, CFL2, ACTN1, ITGA3, ITGB3 hsa05222 Small cell lung cancer 4 2.77E-02 LAMA3, BCL2, ITGA3, COL4A6
hsa04512 ECM-receptor interaction 4 2.77E-02 LAMA3, ITGA3, ITGB3, COL4A6
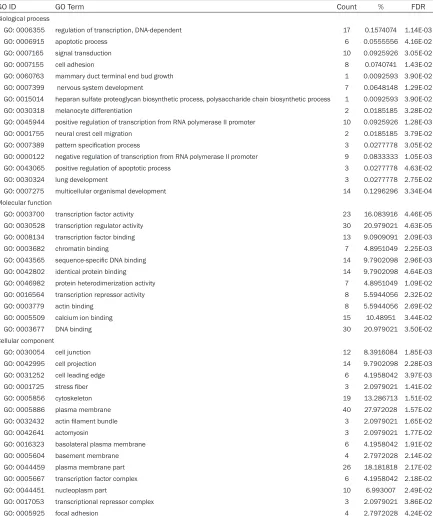
[image:4.792.92.703.373.496.2]GO classification and KEGG pathways of miR -NA target genes
GO functional and KEGG pathway enrichment analyses were performed for the 109 target gens. We found that regulation of transcription, DNA-dependent (GO: 0006355, P = 1.14E-03) and apoptotic process (GO: 0006915, P =
4.16E-02) were significantly enriched for bio -logical processes. While for molecular func-tions, transcription factor activity (GO: 000- 3700, P = 4.46E-05) and transcription regula-tor activity (GO: 0030528, P = 4.63E-05) were
significantly enriched, and for cellular compo -nent, cell junction (GO: 0030054, P = 1.85E-03) and cell projection (GO: 0042995, P =
2.28E-03) were significantly enriched (Table 3,
[image:5.612.96.521.71.476.2]Figure 2A).
Figure 1. Significantly enriched functional annotation of differently expressed miRNA target genes. A. The top 10 enriched GO categories for biological process; B. The significantly enriched KEGG pathway.
gene pairs by Cytoscape software. As a result, 17 miRNAs and 109 differentially expressed genes formed 173 miRNA-target gene pairs with an inverse correlation of expression (Fi- gure 1). Among all the differentially expressed miRNAs, miR-19b-3p had the most regulatory target genes (37 target genes) and miR-20a-5p and miR-124-3p targeted 26 and 22 differen-tially expressed genes. Additionally among the differentially expressed genes, CCND2 had most regulatory miRNAs (5 potential controlling miRNAs) and ZBTB4, TRPS1 and JAZF1 were regulated by 4 miRNAs. Those miRNAs target-ing multiple genes and those genes targeted by multiple miRNAs, which demonstrated the nodal points of regulatory network, may play
Table 3. GO functional annotation of differentially expression miRNA target genes (Top 15)
GO ID GO Term Count % FDR
Biological process
GO: 0006355 regulation of transcription, DNA-dependent 17 0.1574074 1.14E-03
GO: 0006915 apoptotic process 6 0.0555556 4.16E-02
GO: 0007165 signal transduction 10 0.0925926 3.05E-02
GO: 0007155 cell adhesion 8 0.0740741 1.43E-02
GO: 0060763 mammary duct terminal end bud growth 1 0.0092593 3.90E-02
GO: 0007399 nervous system development 7 0.0648148 1.29E-02
GO: 0015014 heparan sulfate proteoglycan biosynthetic process, polysaccharide chain biosynthetic process 1 0.0092593 3.90E-02
GO: 0030318 melanocyte differentiation 2 0.0185185 3.28E-02
GO: 0045944 positive regulation of transcription from RNA polymerase II promoter 10 0.0925926 1.28E-03
GO: 0001755 neural crest cell migration 2 0.0185185 3.79E-02
GO: 0007389 pattern specification process 3 0.0277778 3.05E-02
GO: 0000122 negative regulation of transcription from RNA polymerase II promoter 9 0.0833333 1.05E-03
GO: 0043065 positive regulation of apoptotic process 3 0.0277778 4.63E-02
GO: 0030324 lung development 3 0.0277778 2.75E-02
GO: 0007275 multicellular organismal development 14 0.1296296 3.34E-04
Molecular function
GO: 0003700 transcription factor activity 23 16.083916 4.46E-05
GO: 0030528 transcription regulator activity 30 20.979021 4.63E-05
GO: 0008134 transcription factor binding 13 9.0909091 2.09E-03
GO: 0003682 chromatin binding 7 4.8951049 2.25E-03
GO: 0043565 sequence-specific DNA binding 14 9.7902098 2.96E-03
GO: 0042802 identical protein binding 14 9.7902098 4.64E-03
GO: 0046982 protein heterodimerization activity 7 4.8951049 1.09E-02
GO: 0016564 transcription repressor activity 8 5.5944056 2.32E-02
GO: 0003779 actin binding 8 5.5944056 2.69E-02
GO: 0005509 calcium ion binding 15 10.48951 3.44E-02
GO: 0003677 DNA binding 30 20.979021 3.50E-02
Cellular component
GO: 0030054 cell junction 12 8.3916084 1.85E-03
GO: 0042995 cell projection 14 9.7902098 2.28E-03
GO: 0031252 cell leading edge 6 4.1958042 3.97E-03
GO: 0001725 stress fiber 3 2.0979021 1.41E-02
GO: 0005856 cytoskeleton 19 13.286713 1.51E-02
GO: 0005886 plasma membrane 40 27.972028 1.57E-02
GO: 0032432 actin filament bundle 3 2.0979021 1.65E-02
GO: 0042641 actomyosin 3 2.0979021 1.77E-02
GO: 0016323 basolateral plasma membrane 6 4.1958042 1.91E-02
GO: 0005604 basement membrane 4 2.7972028 2.14E-02
GO: 0044459 plasma membrane part 26 18.181818 2.17E-02
GO: 0005667 transcription factor complex 6 4.1958042 2.18E-02
GO: 0044451 nucleoplasm part 10 6.993007 2.49E-02
GO: 0017053 transcriptional repressor complex 3 2.0979021 3.86E-02
GO: 0005925 focal adhesion 4 2.7972028 4.24E-02
We also performed the KEGG pathway enrich-ment analysis for differently expressed miRNA target genes. Hypergeometric test with P value < 0.05 were used as the criteria for pathway
detection. The most significant pathway in our
analysis was focal adhesion (P = 1.34E-04). Furthermore, axon guidance (P = 3.14E-03) and pathways in cancer (P = 1.28E-02) are also highly enriched (Table 4, Figure 2B).
Discussion
be significantly differentially expressed in the
OS by integrating the acquired 2 data sets. The up-regulated miRNA with the lowest P-value was miR-9-3p, which has been found to regu-late osteoblastic differentiation of mouse induced pluripotent stem (iPS) cells [22]. The expression of miR-9-3p altered in multiple can-cers such as neuroblastoma, [23] colorectal cancer [24] and breast cancer [25], suggesting miR-9-3p was of potential importance in tumor formation and development. The down-regulat-ed gene with the lowest P-value was
miR-223-3p, which was significantly associated with a
higher risk for progression of non-small cell lung carcinoma [26].
In addition, there are evidences showing that some genes implicated in the development of OS. Sun XH et al. discovered the altered expres-sion of miR-646 in OS cell lines and OS tissues compared with normal osteoblast cell line. In vitro experiments showed that miR-646 regu-lated OS cells proliferation, migration, and inva-sion by targeting FGF2 [27]. miR-100-3p and miR-135b-5p were expressed differentially in OS cell lines and may be associated with the metastatic capacity of the disease [28]. Jones
KB et al. found that miR-142-5p exhibit reduced expression in human OS tissues [10]. miR-486-5p was found to be down-regulated in OS cell lines relative to normal bone [29]. Shen L et al.
identified a tumor-suppressive role of miR-217
in OS tumorigenesis through targeting WASF3 [30].
[image:7.612.96.522.70.341.2]tifractionated radiation in human breast cancer cells [31]. miR-124-3p exhibited altered expres-sion in several kinds of cancers including glio-ma, oral squamous cell carcinomas, hepatocel-lular carcinoma and breast cancer [32-35], suggesting that its function is related to carcinogenesis.
Additionally in the miRNAs and mRNA regulato-ry network, CCND2 had most regulatoregulato-ry NAs including 124-3p, 17-5p, miR-19b-3p, miR-20a-5p, miR-29b-3p and the top 3 miRNA with the most regulatory target genes were contained. CCND2, located at chromo-some 12p13, plays a key role in cell cycle G1/S transition by regulating phosphorylation of the tumor suppressor protein Rb [36]. DNA copy number alterations of CCND2 showed remark-able enhancement in OS metastatic lesion compared to a primary lesion by array compar-ative genomic hybridization analysis, leading to overexpression of CCND2 in OS [37, 38]. CCND2 may be considered a therapy target for OS. Finally, through GO and pathway analysis of putative targets of miRNA we found that some of the biological function may be cancer-related including regulation of transcription, DNA-dependent, apoptotic process, signal
transduc-tion and cell adhesion. The most significant
pathway in our analysis was focal adhesion, which plays a fundamental role in carcinogen-esis, tumor progression and metastasis. Am- ounts of focal adhesion molecules including integrins, integrin-associated proteins and growth factor were found to be deregulated in several kinds of cancer [39]. Many of the
differ-ently expressed target genes identified in this
study were involved in pathways in cancer, including FGFR2, LAMA3, BCL2, MITF, RU- NX1T1, ITGA3, GLI3 and COL4A6 as cancer suppressors or oncogenes.
In this study, differentially expressed miRNA
were identified between OS and normal tissues
by combining OS miRNA expression data sets available. Based on a published integrated study, 109 miRNA target genes found to be anticorrelated with miRNA expressions in OS. A novel miRNA-target gene regulatory network was constructed with the miRNA-target gene pairs. miR-19b-3p, miR-20a-5p, miR-124-3p and their common target CCND2, the nodal points of regulatory network, may play impor-tant roles in OS. Bioinformatics analysis of
bio-logical functions and pathways demonstrated that target genes of miRNAs are highly
corre-lated with carcinogenesis. Our findings may
help to understand the molecular mechanisms of OS and identify targets of effective targeted therapies for OS. Further functional experi-ments may provide additional insights into the role of the differentially regulated miRNAs in the development of OS.
Acknowledgements
The study was supported by the Natural Science Foundation of Jiangxi Province (no. 2012- 2BAB205050) and a project from the Health and Family Planing Commission of Jiangxi Province (no. 20121091) and a project from the Department of Science & Technology of Jiangxi Province (no. 20133BBG70079).
Disclosure of conflict of interest
None.
Address correspondence to: Dr. Hui Gao, Depart- ment of Orthopedics, The First Affiliated Hospital of Gannan Medical University, 23 Qingnian Road, Ganzhou 341000, Jiangxi Province, China. E-mail: [email protected]
References
[1] PosthumaDeBoer J, Witlox MA, Kaspers GJ and van Royen BJ. Molecular alterations as tar-get for therapy in metastatic osteosarcoma: a review of literature. Clin Exp Metastasis 2011; 28: 493-503.
[2] O’Day K and Gorlick R. Novel therapeutic agents for osteosarcoma. Expert Rev Antic- ancer Ther 2009; 9: 511-523.
[3] Winter J and Diederichs S. MicroRNA biogene-sis and cancer. Methods Mol Biol 2011; 676: 3-22.
[4] Volinia S, Calin GA, Liu CG, Ambs S, Cimmino A, Petrocca F, Visone R, Iorio M, Roldo C, Ferracin M, Prueitt RL, Yanaihara N, Lanza G, Scarpa A, Vecchione A, Negrini M, Harris CC and Croce CM. A microRNA expression signature of hu-man solid tumors defines cancer gene targets. Proc Natl Acad Sci U S A 2006; 103: 2257-2261.
[6] Doench JG and Sharp PA. Specificity of microR-NA target selection in translational repression. Genes Dev 2004; 18: 504-511.
[7] Boehm A, Neff J, Squire J, Bayani J, Nelson M and Bridge J. Cytogenetic findings in 36 osteo-sarcoma specimens and a review of the litera-ture. Fetal Pediatr Pathol 2000; 19: 359-376. [8] Maire G, Martin JW, Yoshimoto M,
Chilton-MacNeill S, Zielenska M and Squire JA. Ana- lysis of miRNA-gene expression-genomic pro-files reveals complex mechanisms of microR-NA deregulation in osteosarcoma. Cancer Genet 2011; 204: 138-146.
[9] Baumhoer D, Zillmer S, Unger K, Rosemann M, Atkinson MJ, Irmler M, Beckers J, Siggelkow H, von Luettichau I, Jundt G, Smida J and Nathrath M. MicroRNA profiling with correlation to gene expression revealed the oncogenic miR-17-92 cluster to be up-regulated in osteosarcoma. Cancer Genet 2012; 205: 212-219.
[10] Jones KB, Salah Z, Del Mare S, Galasso M, Gaudio E, Nuovo GJ, Lovat F, LeBlanc K, Pa- latini J, Randall RL, Volinia S, Stein GS, Croce CM, Lian JB and Aqeilan RI. miRNA signatures associate with pathogenesis and progression of osteosarcoma. Cancer Res 2012; 72: 1865-1877.
[11] Lulla RR, Costa FF, Bischof JM, Chou PM, de FBM, Vanin EF and Soares MB. Identification of Differentially Expressed MicroRNAs in Os- teosarcoma. Sarcoma 2011; 2011: 732690. [12] Huang G, Nishimoto K, Zhou Z, Hughes D and
Kleinerman ES. 20a encoded by the miR-17-92 cluster increases the metastatic poten-tial of osteosarcoma cells by regulating Fas expression. Cancer Res 2012; 72: 908-916. [13] Lv H, Guo J, Li S and Jiang D. inhibitor reduces
the proliferation and migration in osteosarco-ma MG-63 cells. Exp Ther Med 2014; 8: 1575-1580.
[14] Dweep H, Sticht C, Pandey P and Gretz N. miR-Walk--database: prediction of possible miRNA binding sites by “walking” the genes of three genomes. J Biomed Inform 2011; 44: 839-847.
[15] Yang Z, Chen Y, Fu Y, Yang Y, Zhang Y and Li D. Meta-analysis of differentially expressed genes in osteosarcoma based on gene expression data. BMC Med Genet 2014; 15: 80.
[16] Luo Z, Zhang L, Li Z, Li X, Li G, Yu H, Jiang C, Dai Y, Guo X, Xiang J and Li G. An in silico analysis of dynamic changes in microRNA expression profiles in stepwise development of nasopha-ryngeal carcinoma. BMC Med Genomics 2012; 5: 3.
[17] Lionetti M, Biasiolo M, Agnelli L, Todoerti K, Mosca L, Fabris S, Sales G, Deliliers GL, Bic- ciato S, Lombardi L, Bortoluzzi S and Neri A. Identification of microRNA expression patterns
and definition of a microRNA/mRNA regulatory network in distinct molecular groups of multi-ple myeloma. Blood 2009; 114: e20-26. [18] Enerly E, Steinfeld I, Kleivi K, Leivonen SK,
Aure MR, Russnes HG, Ronneberg JA, Johnsen H, Navon R, Rodland E, Makela R, Naume B, Perala M, Kallioniemi O, Kristensen VN, Yakhini Z and Borresen-Dale AL. miRNA-mRNA inte-grated analysis reveals roles for miRNAs in pri-mary breast tumors. PLoS One 2011; 6: e16915.
[19] Shannon P, Markiel A, Ozier O, Baliga NS, Wang JT, Ramage D, Amin N, Schwikowski B and Ideker T. Cytoscape: a software environ-ment for integrated models of biomolecular interaction networks. Genome Res 2003; 13: 2498-2504.
[20] Altermann E and Klaenhammer TR. Path- wayVoyager: pathway mapping using the Kyoto Encyclopedia of Genes and Genomes (KEGG) database. BMC Genomics 2005; 6: 60. [21] Tabas-Madrid D, Nogales-Cadenas R and Pa-
scual-Montano A. GeneCodis3: a non-redun-dant and modular enrichment analysis tool for functional genomics. Nucleic Acids Res 2012; 40: W478-483.
[22] Okamoto H, Matsumi Y, Hoshikawa Y, Takubo K, Ryoke K and Shiota G. Involvement of mi-croRNAs in regulation of osteoblastic differen-tiation in mouse induced pluripotent stem cells. PLoS One 2012; 7: e43800.
[23] Murray MJ, Raby KL, Saini HK, Bailey S, Wool SV, Tunnacliffe JM, Enright AJ, Nicholson JC and Coleman N. Solid tumors of childhood dis-play specific serum microRNA profiles. Cancer Epidemiol Biomarkers Prev 2015;24: 350-60. [24] Slattery ML, Herrick JS, Mullany LE, Valeri N,
Stevens J, Caan BJ, Samowitz W and Wolff RK. An evaluation and replication of miRNAs with disease stage and colorectal cancer-specific mortality. Int J Cancer 2014; [Epub ahead of print].
[25] Zawistowski JS, Nakamura K, Parker JS, Gra- nger DA, Golitz BT and Johnson GL. MicroRNA 9-3p targets beta1 integrin to sensitize clau-din-low breast cancer cells to MEK inhibition. Mol Cell Biol 2013; 33: 2260-2274.
[26] Sanfiorenzo C, Ilie MI, Belaid A, Barlesi F, Mo- uroux J, Marquette CH, Brest P and Hofman P. Two panels of plasma microRNAs as non-inva-sive biomarkers for prediction of recurrence in resectable NSCLC. PLoS One 2013; 8: e54596. [27] Sun XH, Geng XL, Zhang J and Zhang C. miR-NA-646 suppresses osteosarcoma cell metas-tasis by downregulating fibroblast growth fac-tor 2 (FGF2). Tumour Biol 2015; 36: 2127-34. [28] Lauvrak SU, Munthe E, Kresse SH, Stratford
and miRNAs associated with aggressive can-cer phenotypes. Br J Cancan-cer 2013; 109: 2228-2236.
[29] Namlos HM, Meza-Zepeda LA, Baroy T, Osten- sen IH, Kresse SH, Kuijjer ML, Serra M, Burger H, Cleton-Jansen AM and Myklebost O. Modu- lation of the osteosarcoma expression pheno-type by microRNAs. PLoS One 2012; 7: e48086.
[30] Shen L, Wang P, Yang J and Li X. MicroRNA-217 regulates WASF3 expression and suppresses tumor growth and metastasis in osteosarco-ma. PLoS One 2014; 9: e109138.
[31] Leung CM, Chen TW, Li SC, Ho MR, Hu LY, Liu WS, Wu TT, Hsu PC, Chang HT and Tsai KW. MicroRNA expression profiles in human breast cancer cells after multifraction and single-dose radiation treatment. Oncol Rep 2014; 31: 2147-2156.
[32] Xia H, Cheung WK, Ng SS, Jiang X, Jiang S, Sze J, Leung GK, Lu G, Chan DT, Bian XW, Kung HF, Poon WS and Lin MC. Loss of brain-enriched miR-124 microRNA enhances stem-like traits and invasiveness of glioma cells. J Biol Chem 2012; 287: 9962-9971.
[33] Hunt S, Jones AV, Hinsley EE, Whawell SA and Lambert DW. MicroRNA-124 suppresses oral squamous cell carcinoma motility by targeting ITGB1. FEBS Lett 2011; 585: 187-192. [34] Furuta M, Kozaki KI, Tanaka S, Arii S, Imoto I
and Inazawa J. miR-124 and miR-203 are epi-genetically silenced tumor-suppressive mi-croRNAs in hepatocellular carcinoma. Carci- nogenesis 2010; 31: 766-776.
[35] Liang YJ, Wang QY, Zhou CX, Yin QQ, He M, Yu XT, Cao DX, Chen GQ, He JR and Zhao Q. MiR-124 targets Slug to regulate epithelial-mesen-chymal transition and metastasis of breast cancer. Carcinogenesis 2013; 34: 713-722. [36] Weinberg RA. The retinoblastoma protein and
cell cycle control. Cell 1995; 81: 323-330. [37] Kanamori M, Sano A, Yasuda T, Hori T and
Suzuki K. Array-based comparative genomic hybridization for genomic-wide screening of DNA copy number alterations in aggressive bone tumors. J Exp Clin Cancer Res 2012; 31: 100.
[38] Di Fiore R, Fanale D, Drago-Ferrante R, Chi- aradonna F, Giuliano M, De Blasio A, Amodeo V, Corsini LR, Bazan V, Tesoriere G, Vento R and Russo A. Genetic and molecular charac-terization of the human osteosarcoma 3AB-OS cancer stem cell line: a possible model for studying osteosarcoma origin and stemness. J Cell Physiol 2013; 228: 1189-1201.