Open Access
Research article
Gene expression profiles during early differentiation of mouse
embryonic stem cells
Fiona C Mansergh*
1,2, Carl S Daly
†1, Anna L Hurley
†1, Michael A Wride
3,
Susan M Hunter
1and Martin J Evans
1Address: 1School of Biosciences, Cardiff University, Museum Avenue, Cardiff, CF10 3US, Wales, UK, 2Ocular Genetics Unit, Smurfit Institute of Genetics, Trinity College Dublin, Dublin 2, Ireland and 3Zoology Department, Trinity College Dublin, Dublin 2, Ireland
Email: Fiona C Mansergh* - mansergf@tcd.ie; Carl S Daly - dalycs@cf.ac.uk; Anna L Hurley - hurleyal@cf.ac.uk; Michael A Wride - wridem@tcd.ie; Susan M Hunter - huntersm@cf.ac.uk; Martin J Evans - evansmj@cf.ac.uk * Corresponding author †Equal contributors
Abstract
Background: Understanding the mechanisms controlling stem cell differentiation is the key to
future advances in tissue and organ regeneration. Embryonic stem (ES) cell differentiation can be triggered by embryoid body (EB) formation, which involves ES cell aggregation in suspension. EB growth in the absence of leukaemia inhibitory factor (LIF) leads EBs to mimic early embryonic development, giving rise to markers representative of endoderm, mesoderm and ectoderm. Here, we have used microarrays to investigate differences in gene expression between 3 undifferentiated ES cell lines, and also between undifferentiated ES cells and Day 1–4 EBs
Results: An initial array study identified 4 gene expression changes between 3 undifferentiated ES
cell lines. Tissue culture conditions for ES differentiation were then optimized to give the maximum range of gene expression and growth. -Undifferentiated ES cells and EBs cultured with and without LIF at each day for 4 days were subjected to microarray analysis. -Differential expression of 23 genes was identified. 13 of these were also differentially regulated in a separate array comparison between undifferentiated ES cells and compartments of very early embryos. A high degree of inter-replicate variability was noted when confirming array results. Using a panel of marker genes, RNA amplification and RT-PCR, we examined expression pattern variation between individual -D4-Lif EBs. We found that individual EBs selected from the same dish were highly variable in gene expression profile.
Conclusion: ES cell lines derived from different mouse strains and carrying different genetic
modifications are almost invariant in gene expression profile under conditions used to maintain pluripotency. Tissue culture conditions that give the widest range of gene expression and maximise EB growth involve the use of 20% serum and starting cell numbers of 1000 per EB. 23 genes of importance to early development have been identified; more than half of these are also identified using similar studies, thus validating our results. EBs cultured in the same dish vary widely in terms of their gene expression (and hence, undoubtedly, in their future differentiation potential). This may explain some of the inherent variability in differentiation protocols that use EBs.
Published: 9 January 2009
BMC Developmental Biology 2009, 9:5 doi:10.1186/1471-213X-9-5
Received: 18 July 2008 Accepted: 9 January 2009
This article is available from: http://www.biomedcentral.com/1471-213X/9/5 © 2009 Mansergh et al; licensee BioMed Central Ltd.
Background
ES cells are derived from the inner cell masses of blasto-cysts and can contribute to all cell types of the embryo proper [1,2]. The combination of pluripotency and ease of genetic modification has given rise to the revolution in genetic analysis via the use of knockout mice. ES cell pluripotency has also been exploited in vitro; many differ-ent cell types can now be generated in culture. Human ES cell lines have been isolated; moreover, ES like cells (iPS cells) can be derived from human skin [3-6]. Therefore, in
vitro differentiation protocols for human ES or iPS cells
have huge therapeutic potential.
Many in vitro ES differentiation protocols rely on embry-oid bodies (EBs); floating aggregates of ES cells which, when grown without LIF, mimic to some extent the early stage embryo, giving rise to precursors of a large number of tissues[7,8]. Early growth of EBs with LIF favours stem cell renewal and the differentiation of embryonic endo-derm [9], while removal of LIF allows the generation of precursors representative of all three germ layers [10]. To date, protocols for deriving neural, haematopoietic, mus-cle, bone, pancreatic, hepatic and many other precursor and mature cell types from ES cells in culture [11-13] have been developed, many of which still use EBs as a starting point. EBs can be allowed to differentiate spontaneously from cell suspension or can be formed from a defined cell number using 'hanging drops'. Following aggregation, culture is often allowed to proceed spontaneously for 3–4 days, followed by the addition of factors that promote dif-ferentiation of specific precursor types; for example, retin-oic acid may be added to promote neuronal specification [14,15], although, today, more efficient neural differenti-ation can be achieved in chemically defined medium or via adherent monoculture in the presence of FGF [16-18]. Subsequent growth, followed by disassociation and plat-ing on adherent surfaces, permits the derivation of termi-nally differentiated cell types.
ES differentiation can provide abundant, partially syn-chronised sources of transient embryonic precursor types that are present only in very limiting quantities in vivo. Moreover, EBs represent a good model for examining the events of early embryogenesis, as the formation of a pro-amniotic cavity and the expression of markers of early dif-ferentiation, for example, are often mimicked by EBs [19]. However, final cell populations are usually heterogene-ous, percentages of desired cell types arising often vary from one experimental replicate to another [14,15,10]. Reasons for this variation are not hard to identify; differ-entiation is sensitive to glucose concentration, serum quality, amino acids, growth factors, extracellular matrix proteins, pH, osmolarity, passage number and the iden-tity of the ES cell line used [13]. The existence of ES cell derived chimeras and ensuing mouse lines demonstrates the ability of ES cells to differentiate into all adult cell
types. However, we are at present unable to generate the full complement of adult cell types from ES cells in vitro. Greater understanding of gene expression during early dif-ferentiation may allow more precise direction of ES cell differentiation and will also widen understanding of early embryonic development.
Dissecting the events of early differentiation has been aided by the development of microarray technology, which allows the examination of global gene expression changes. We have used microarray technology to examine variation between 3 undifferentiated ES cell lines. We then optimised aggregation methods, EB size, and serum concentrations and carried out array analysis using day 1– 4 EBs in the presence and absence of LIF. We identified 23 differentially regulated genes, some of which have known roles in early development. However, given lower than expected confirmation rates, and lack of reproducibility in stem cell derived arrays [20-22], we tested the replicability of gene expression patterns arising from individual EBs growing in the same culture, using RNA amplification. We found a high level of variation in gene expression pat-terns, even between EBs from the same culture dish. This variability may provide explanations for the difficulties involved in obtaining pure cultures of differentiated prog-eny from EB based protocols.
Methods
Tissue Culture and cell lines
This study utilised 3 ES cell lines, IMT11 (derived from 129 mice), HM1 (which is Hprt negative) and SMHBl6 (derived from C57Bl6/J mice). The IMT11 line was selected for all investigations involving differentiation, as it is not genetically modified and is better characterised than SMHBl6. IMT11 cells showed the highest percentage of diploid cells after karyotyping and have been tested for germline transmission.
1) Undifferentiated ES cells were maintained at 37°C in a humidified atmosphere with 5% CO2 on 0.1% gelatin in DMEM, with 2 mM L-glutamine, 50 U/ml penicillin, 50 μg/ml streptomycin (all from Gibco™, Invitrogen Ltd, Paisley, Renfrewshire, UK), 10-4 M β-Mercaptoethanol
(Merck KGaA, 64293 Darmstadt, Germany), 10-3 U/ml
murine LIF (ESGRO™, Invitrogen, Ltd, Paisley, Renfrews-hire, UK), 10% FBS (foetal bovine serum) and 10% NBS (newborn bovine serum) (selected batches, PAA Labora-tories GmbH, Linz, A-4020 Austria). All undifferentiated ES cell lines were karyotyped using standard protocols in order to test that the majority of cells showed a normal diploid chromosome number (40XY) prior to differentia-tion.
achieve a single cell suspension. ES medium was prepared as above for + LIF EBs, and without LIF for -LIF differenti-ations. Cells were counted using a haemocytometer and cell density was adjusted appropriately to the required number of cells per 10 μl. A multichannel pipette (Finnpi-pette 5–50 μl) was used to deposit approximately 200 10 μl drops on the floor of a 140 mm bacteriological dish (Sterilin). A smaller plate was filled with 1–2 mls PBS and placed in the lid of the bacteriological dish. The plate was inverted and incubated overnight to allow the EBs to aggregate. The following day dishes were righted and flooded with 20 mls of the appropriate differentiation medium, then grown in suspension culture until harvest-ing. EBs were formed by aggregation of 125, 250, 500, 750 and 1000 cells per 10 μl to determine optimal size. A 50% FCS, 50% NCS mix was prepared from ES batch tested serum samples (PAA), then added to serum free ES medium, at 0%, 5%, 10%, 15% and 20% final volumes. Hanging drops containing either 750 or 1000 cells were generated in order to test serum concentrations.
We also tested EBs that were allowed to aggregate ran-domly following dissociation. For brevity, we refer to these as "random EBs later in the text". Random aggrega-tion gives rise to greater numbers of EBs per dish, that are of much more variable sizes and shapes than those gener-ated using the "hanging drop" method. For random aggre-gation of EBs, 1 × 10⁶ cells were suspended in 10 mls
media in a 100 mm bacteriological dish and allowed to aggregate spontaneously. Serum quantities were varied as above. Photographs were taken of EBs at day 4 of differen-tiation without LIF, at varying sizes and serum concentra-tions and saved in .tif format. Photographs were analysed and EB diameters measured using Scion Image (Scion Corporation). Diameter measurements were used to cal-culate radius and volume.
RNA extraction and amplification
1) For array analysis, undifferentiated ES cells were washed twice with DPBS-A, treated with trypsin-EDTA (Invitrogen Ltd., Paisley, UK) and counted. Appropriate cell numbers were pelleted by centrifugation at 1000 g. The QIAgen RNeasy™ Midi Kit (Qiagen Ltd., Crawley, Sus-sex, UK) was used according to the manufacturer's proto-col for RNA extraction, followed by OD 260/280 spectrophotometry (Camspec, Cambridge, UK) and gel electrophoresis using dissociating conditions (Northern-Max™ buffers; Ambion, Huntingdon, UK), used according to the manufacturer's protocol, to check RNA concentra-tion and integrity.
2) For RNA extraction from individual embryoid bodies, the mini RNA isolation kit (Zymo) was used, followed by amplification using the RNA amplification kit (Arcturus), both according to the manufacturer's protocol. Following quantification by UV spectrophotometer (Camspec),
amplified RNA samples were DNase treated using the Turbo DNAfree kit (Ambion) and reverse transcribed using the random hexamer protocol of the Superscript First Strand Synthesis System for RT-PCR (Invitrogen). (Note, a nuclease step is included in the Arcturus kit to remove residual DNA, but is not entirely sufficient to ensure blank negative control lanes, hence the extra DNase step).
3) For RNA extraction followed by RT-PCR, embryoid bodies were spun down, washed with PBS, then spun down again. EBs were treated with 0.25% trypsin/EDTA and washed with PBS a second time when extracting RNA from larger Day 3–4 EBs 100 ul of EBs+ residual PBS was resuspended in 1 ml TRIzol (Invitrogen); samples were homogenized by pipetting up and down using a 1 ml micropipette. RNA was extracted according to the manu-facturer's protocol, quantified, DNase treated and reverse transcribed as above, except that the oligo-dT supplied with the kit was spiked with a 1/10000 dilution of an 18S rRNA gene specific primer, in order to allow 18S rRNA (which doesn't have a poly A tail) to be used as a house-keeping control. Where starting RNA quantity was low, we tripled the amount of RNA used and therefore the reaction volumes per sample. RT reactions were diluted with nucle-ase free water (Ambion) to 50 ul before PCR analysis. A "no RT" control corresponding to each sample was also produced for all RT-PCR experiments described in this paper; these were treated in exactly the same way as the samples except that reverse transcriptase was not added.
4) For RNA extraction prior to array analysis, EBs were spun down, washed, and trypsinized as above. The QIA-gen RNeasy™ Midi Kit (QiaQIA-gen Ltd., Crawley, Sussex, UK) was used according to the manufacturer's protocol for RNA extraction. RNA samples were quantified and checked for quality as described in 1) above.
Cy labelling for array analysis
10 μg of total RNA was labelled with either Cy3 or Cy5 dyes using the CyScribe labelling system (GE Healthcare, Chalfont St. Giles, Bucks, UK), according to the manufac-turer's protocol. 1 μl of labelled cDNA was combined with 2 ul 50% glycerol/50% TE mixture, run on a microscope slide sized, 1.5% agarose gel (mould manufactured in-house) and scanned using a GeneTac LS IV scanner (Genomic Solutions, Huntingdon, Cambs. UK). Control and experimental samples were then combined and pre-pared for hybridization.
Hybridization
1 μl Cot1 DNA and 1 μl poly A oligo as blocking agents, heated to 95°C for 5 minutes and then added to the face of one slide. The printed face of the second slide of the pair was then placed face to face with the first, using the same probe. Slide pairs were then placed in a humidified container and incubated for 24–48 hours at 42°C. Fol-lowing hybridization, slides were washed once in Wash solution 1 (1× SSC, 2% SDS, filtered autoclaved ddH2O) for 20 minutes, then twice in Wash solution 2 (0.1× SSC, 0.2% SDS, filtered autoclaved distilled deionised H2O (ddH2O) for 20 minutes each. Slides were dipped in nuclease free filtered water, then spray dried, finally, the backs of the slides were cleaned with filtered autoclaved ddH2O, then wiped with 100% EtOH, then wiped dry and scanned.
Scanning
Scans were carried out at 12.5 μm, using the averaging set-ting (GeneTac LSIV scanner, (Genomic Solutions, Cam-bridgeshire, UK)). It is possible to carry out quick draft scans using this scanner. Gain and black settings, which affect image intensity and background, were varied slightly in order to optimize the signal/noise ratio for each channel and each slide before proper scans were initiated.
MIAME standards
In adherence with MIAME standards [23], all data sets have been submitted to the GEO database http:// www.ncbi.nlm.nih.gov/geo/ and are fully MIAME compli-ant. Undifferentiated ES cell comparison data are described in GSE8625, while EB differentiation compari-sons are described in GSE8766. The results from these experiments were compared with an array comparison (described elsewhere) between undifferentiated ES colo-nies and microdissected inner cell masses from embryonic day 3.5, 4.5, and delayed blastocysts and microdissected day 5.5 and day 6.5 embryonic ectoderm (GSE8881, [24]).
Array Platforms
Undifferentiated ES cell array experiments (GSE8625) were carried out using NIA 15K slides printed in the Car-diff Microarray Facility. These consisted of 17136 spots, printed in 12 × 4 mini grids, each with 17 rows and 21 col-umns and are described more fully in GEO, platform accession number GPL5530. EB differentiation compari-sons (GSE8766) were carried out using NIA 15K slides printed by the HGMP. These consist of 2 slides, 17280 spots per slide, including control spots, empties and land-marks. 2 duplicate spots are printed per slide for each clone. These slides are described more fully in GEO, plat-form accession number GPL5735. The array slides used for GSE8881 were also printed in Cardiff and contain 16128 spots, printed in 12 × 4 mini grids, each with 16 rows and 21 columns. The GEO platform accession number for these is GPL5771. Differences in spot number
relate to differences in the number of landmarks and other controls printed; the core NIA 15K set is present on each of these platforms
Experimental design, Image analysis
Undifferentiated ES cell arrays were carried out using sam-ples from undifferentiated IMT11, SMHBL6.3 and HM1 ES cells. EB arrays were carried out using samples from Day0 (undifferentiated), Day1, Day2, Day3 and Day 4 differentiated EBs, generated in the presence and absence of LIF (9 samples in total). Each experimental sample was hybridized on a slide with a pooled control derived from an equal amount of all experimental samples. ES arrays were repeated 12 times (this print run contained no dupli-cate spots). EB arrays were repeated twice. Duplidupli-cate spots were present on each array, giving four repeats total for each gene. Scanned images were stored and filtered, then analysed using ImaGene™ 5.5 (BioDiscovery). This series of array experiments was carried out using the NIA15K set [25]. ESTs comprising this set were isolated from a variety of embryonic stages and tissues. Arrays were hybridised with fluor switching, in order to counteract any issues of dye bias that may have arisen from direct labelling.
Microarray Analysis
Array analyses for GEO entries GSE8625 and GSE8766 were carried out similarly to work described previously [26,27]. Output files from ImaGene were saved and ana-lysed in MS Excel spreadsheet format. Each channel from each repetition was normalised via division by the mean intensity value. These data were collated and formatted for Significance Analysis of Microarrays (SAM; http:// www-stat.stanford.edu/~tibs/SAM). Genes that showed a fold change of 2 or above and were statistically significant above a delta value of 0.5 (which denotes an error rate of 5%) were selected for further appraisal. SAM, however, has a disadvantage; all replicates have to be in the same order, precluding any data filtration. Hence, we supple-mented SAM analysis with a second analysis method as follows:
Following normalisation, we used approximately 700 blank spots per slide to calculate a mean background value + 2 standard deviations of that background value, for each channel. Genes that fell below this cut-off in BOTH control and experimental channels were removed, along with genes with a fold change of < 2. This filtered gene list was compared with that from SAM; genes appear-ing as differentially regulated usappear-ing both methods were deemed significant (fold change > 2, above background + 2 SD in at least one channel, delta value of 0.5).
generated (see Figures 1 and 2 (all confirmed genes) and Additional File 1 (all unconfirmed genes)).
Primer design
Significant ESTs were subjected to bioinformatic analysis via BLAST against the mouse genome, and, where availa-ble, against the reference sequence from the UniGene cluster to which they belonged. ESTs with sequences too short or too poor for primer design were rejected at this stage. Adequate EST sequences were used for primer design with Primer3 [28]http://frodo.wi.mit.edu/), using sequence that matched the genome and/or RefSeq sequence. This analysis was carried out in order to rule out
primer mismatches due to areas of erroneous first pass sequence. Primer sequences are given in Table 1.
Bioinformatic analysis
Bioinformatic analysis of confirmed genes was also car-ried out in order to identify putative function in differen-tiation. Accession numbers were used to comprehensively search the NCBI databases http://www.ncbi.nlm.nih.gov. Data compiled from various NCBI databases (UniGene, Homologene, OMIM, LocusLink, PubMed etc.) are shown in Figures 1 and 2. Selected marker genes were chosen on the basis of a known role in maintenance of pluripotency, or early development, or because they are well known
Bioinformatic analysis of confirmed genes (part 1) Figure 1
Bioinformatic analysis of confirmed genes (part 1). From top left, columns are as follows: Experiment: this column
indicates whether the gene confirmed is from the GSE8625 (undifferentiated ES cell lines) or GSE8766 (EB differentiation) gene
lists. Acc no: GenBank accession number. Gene ID: the NIA clone ID, which is referred to in the NCBI nucleotide database
as Gene ID. Identity refers to the official NCBI gene name to which the gene relates (where this is known). UniGene: refers
to the UniGene cluster to which the EST has been assigned (where known). Chromosome indicates the mouse chromosome
to which the EST maps. Differential regulation gives the nature of the expression change and the fold change derived from
array analysis. Bioinformatics indicates possible functions related to differentiation obtained from searches of the NCBI
data-base and the literature. Differentially regulated:other experiments describes if the EST/gene in question has been
identi-fied as differentially regulated in our own study of ES cells versus compartments of early embryos (GSE8881), and/or similar published work. Abbreviations associated with GSE8881: IMT11: undifferentiated IMT11 ES cells. ICM88 and ICM105 = blasto-cyst inner cell mass, 88 hours post coitum, 105 hours post coitum. DICM136, DICM180 = delayed blastoblasto-cyst inner cell mass, 136 hours post coitum, 180 hours post coitum. EE5.5, EE6.5 = embryonic ectoderm, 5.5 and 6.5 days post coitum. For meth-ods and more detailed descriptions of this experiment, see GEO, GSE8881, [24].
Experiment acc no. gene id identity UniGene chromos ome
Differential regulation Bioinformatics; possible functions Differentially regulated; other experiments
GSE8625 BG077623 H3017F07 Hprt1: Hypoxanthine guanine phosphoribosyl transferase 1
Mm.299381 X Expression absent in HM1 line, as expected. -3.59, IMT11 vs HM1 -4.66, SHBl6.3 vs HM1
Housekeeping gene, role in the generation of purine nucleotides, knocked out in HM1 ES line, can be used as a selection tool. Mutations can cause gout and Lesch-Nyhan syndrome (OMIM 308000)
GSE8881: IMT11 vs DICM180, up. Downregulated after 7day RA differentiation [31]
GSE8625 CK334674 H3084B07-3 Pter: Phosphotriesterase related Mm.288713 2 Lower expression in SHBl6.3 ES cells as compared with HM1 and IMT11. 6.726087 IMT11 vs SHBL6. 3, 3.217134, HM1 vs SHBL6.3
Homologue of bacterial zinc metalloenzyme, may catalyze the hydrolysis of a range of phosphotriester compounds, differentially regulated in cystic kidneys (OMIM 604446)
Differentially regulated after treatment with Oct4/Nanog RNAi [34]. Highly represented in diaphragm-neck E11 mouse Unigene library
GSE8766 BG063299 H3005E04 Atp5b: ATP synthase, H+ transporting mitochondrial F1 complex, beta subunit
Mm.238973 10 PCR: D3-L, D4-L down vs other samples. Array: -4.46, D3-L vs D0
GeneID: 11947. Located to mitochondrial inner membrane, involved in ATP biosynthesis and therefore energy metabolism.
GSE8881: IMT11 vs ICM88, ICM105, DICM180, all up. Other subunits of Atp5 were differentially regulated after treatment with Oct4/Nanog RNAi [34] and after 4-3+ RA treatment of EBs [15].
GSE8766 BG062968 H3002E12 Aurkb: Aurora kinase B Mm.3488 11 PCR: D4 + Lif up vs other samples. Array: 2.86, D4+Lif vs pooled control,
GeneID: 20877. Role in mitosis, meiosis, ploidy and histone modification. May be involved in epigentic marking of silent chromatin during cell differentiation. [49]
Differentially regulated after treatment with Oct4/Nanog RNAi [33]. Upregulated at D10 of differentiation vs. Day3 [32].
GSE8766 BG065603 H3033B08 Cox4i1: Cytochrome c oxidase subunit IV isoform 1
Mm.386758 8 PCR: D3,4+L, up vs D0. Array: D0 down vs D3 +L , -3.31.
Gene ID: 12857. Catalyses mitochondrial respiration, expression levels regulated by oxygen bioavailability [50].
GSE8881: IMT11 vs ICM88, ICM105, DICM180, EE6.5, all up. Other subunits of Cox4 were differentially regulated after treatment with Oct4/Nanog RNAi [34]
GSE8766 BG071498 H3099F09 Dppa5: Developmental pluripotency associated 5, and similar to Dppa5 (a.k.a ESG1)
Mm.139314, Mm.359437
5, but also other high matches
PCR: d3-,4-L down vs d2-L. Peak at Day2-L vs other samples. Array: -3.04, d3-L vs pooled control
Gene ID: 434423. Marker of pluripotent stem cells, downregulated during germ cell development [51]. Dispensible for ES cell renewal and ES cell propagation however [52].
Differentially regulated after treatment with Oct4/Nanog RNAi [34]. Highly represented in C57Bl6/J ES cell and blastocyst mouse Unigene libraries
GSE8766 BG063704 H3010E10 EST none 11 PCR: D3+L, up vs D0. Array: 3.54, D3+L vs D0
uncharacterised.
GSE8766 BG063737 H3012B10 EST none 17 PCR: D0 down versus day 3,4+L. D0, day1-L down vs d3-L, d4-L, Array: 5.83, Day 4+L vs day0 4.052, Day 3-L vs Day 0
uncharacterised. GSE8881: MT11 vs EE5.5, EE6.5, both down
GSE8766 BG067484 H3054H09 EST none no matches
PCR: L, up vs D1-L. Array: 5.021 d4-L, upregulated vs D1-L
uncharacterised.
GSE8766 BG067621 H3056D06 EST none no matches
PCR: d0 up vs d3+L. Array: 10.84 d0 vs d3+L, upregulated.
uncharacterised. GSE8881: IMT11 vs ICM105, up
GSE8766 n/a H3133B01 EST none 15 PCR: D4-L down vs D0, Array: 0.377, day 4-L downregulated vs day0
uncharacterised.
GSE8766 n/a H3134D10 EST none equal matches to cs X and 2
PCR: D1-4 down vs D0, decline from D0. Array: -2.90, D3-Lif vs pooled control
uncharacterised.
GSE8766 BG069915 H3081E05 EST none 7 PCR: d3-L down vs D4-L, array: -2.833, d3-L vs pooled control
uncharacterised.
GSE8766 BG063430, CK334149
H3007B09 Eukaryotic translation initiation factor 4A1 (Eif4a1)
Mm.371557 11 PCR: Array results NOT confirmed, BUT downregulated in D1-4-Lif vs day 0 in all 6 PCR samples tested. Array: n/a
Gene ID: 13681. Helicase, unwinds 5' mRNA during translation initiation. Associated with metastasis, [45] can stimulate cell growth in hepatoma cells [46] and enriched in human ES cells [47]
GSE8881: IMT11 vs ICM88, ICM105, both up. Preferential expression in ES, EG, MS and NS stem cells [29]
GSE8625 Higher expression in IMT11 ES cells compared with HM1 and SHBL6.3. 3.08, IMT11 vs SHBL6.3 2.67, IMT11 vs HM1
Higher expression in IMT11 ES cells compared with HM1 and SHBL6.3. 1.6791, IMT11 vs HM1 1.99465, IMT11 vs SHBL6.3
GSE8625
Expressed in proliferating but not quiescent cells (OMIM 176741) , can be used to identify rapidly proliferating tumour cells. Expression may be related to different proliferation rates between the ES lines
constituent of the mammalian Polycomb repressive complexes 1 (Prc1). May be involved during meiotic prophase of male germ cells. [48]
7
H3113B01-3
BG072628, Scmh1: Sex comb on midleg homolog 1
Mm.208924 4 H3025D07-3
BG064926 Mki67: Antigen identified by monoclonal antibody Ki 67
housekeeping genes. Primers were designed for these from the appropriate reference sequence, using Primer3 as above. Datasets derived from ES cell differentiation sub-tractive EST library studies [15,29] or microarrays [30-38] were also searched for the presence of the genes we con-firmed in this study (Figures 1 and 2).
RT PCR array confirmations
We used semi-quantitative RT-PCR to confirm differen-tially regulated genes. As most significant genes appeared to be differentially regulated at various different stages of differentiation, we tested all genes against Day 0, and Day1–4 EBs, + and - LIF. Three biological replicates of
1000 cell Day 1–4 EBs and 3 replicates of 750 cell EBs (+ and - LIF) were used for confirmations, including No RT controls. In order to be deemed confirmed, we asked that a gene demonstrate a consistent expression pattern in at least 4 out of 6 PCR tests. The number of cycles required for minimum visibility was identified and PCRs were opti-mised at the Tm indicated for each primer pair, such that only single bands appeared. PCR bands obtained for housekeeping controls were of even intensity at minimum visibility cycles before testing other genes. PCRs were car-ried out in 20 μl volumes using 0.025 μmol of each dNTP (Invitrogen) and 1 unit Taq DNA polymerase (Sigma) per reaction. PCRs were usually carried out using PCR buffer Bioinformatic analysis of confirmed genes (part 2)
Figure 2
Bioinformatic analysis of confirmed genes (part 2). From top left, columns are as follows: Experiment: this column
indicates whether the gene confirmed is from the GSE8625 (undifferentiated ES cell lines) or GSE8766 (EB differentiation) gene
lists. Acc no: GenBank accession number. Gene ID: the NIA clone ID, which is referred to in the NCBI nucleotide database
as Gene ID. Identity refers to the official NCBI gene name to which the gene relates (where this is known). UniGene: refers
to the UniGene cluster to which the EST has been assigned (where known). Chromosome indicates the mouse chromosome
to which the EST maps. Differential regulation gives the nature of the expression change and the fold change derived from
array analysis. Bioinformatics indicates possible functions related to differentiation obtained from searches of the NCBI
data-base and the literature. Differentially regulated:other experiments describes if the EST/gene in question has been
identi-fied as differentially regulated in our own study of ES cells versus compartments of early embryos (GSE8881), and/or similar published work. Abbreviations associated with GSE8881: IMT11: undifferentiated IMT11 ES cells. ICM88 and ICM105 = blasto-cyst inner cell mass, 88 hours post coitum, 105 hours post coitum. DICM136, DICM180 = delayed blastoblasto-cyst inner cell mass, 136 hours post coitum, 180 hours post coitum. EE5.5, EE6.5 = embryonic ectoderm, 5.5 and 6.5 days post coitum. For meth-ods and more detailed descriptions of this experiment, see GEO, GSE8881, [24].
GSE8766 BG064474, BG064794, BG064795, BG064796 CK334837
H3020B08, H3023H09, H3023H10, H3023H11 H3115H06
Ftl1: Ferritin light chain 1 Mm.316179 Mn30357 Mm.348374 Mm.431913 Mm.472710
13 (Unigene) 7 (Gene)
PCR: D1-L down vs d0 and D2-4 -LIF Array: -3.85, day 0 vs day4-L, -3.19, day0 vs d3-L, -3.26, day1-L vs Day0
GeneID: 14325. Involved in iron homeostasis GSE8881: IMT11 vs DICM180, down. Ferritin heavy chain differentially regulated after treatment with Oct4/Nanog RNAi [34]
GSE8766 BG070801, BG083716
H3091C10 Hnrpk: Heterogeneous nuclear ribonucleoprotein K
Mm.142872 7,13 PCR: Array results NOT confirmed, PCR: d1-L down vs d0, d0 also up vs d4-L.
GeneID: 15387. May be involved in mitochondrial response to insulin, the regulation of neuronal differentiation and improving the efficiency of VEGF mRNA translation [53,54, 55]
GSE8881: IMT11 vs ICM105, up. Other Hnrp proteins differentially regulated after Oct4/Nanog RNAi [34]. Upregulated, 4-3+RA treatment of EBs [15]. Common ESC gene [22]
GSE8766 BG074333 H3133H01 Hspa8: Heat shock protein 8 Mm.336743, Mm.290774
9 PCR: D1-4-L, down vs day 0, decline from day0 Array: 0.395, day4-L downregulated vs day 0
GeneID: 15481. transiently associates with nascent peptides to assist correct folding. May regulate AUF1, which is involved in the rapid decay of certain mRNAs. OMIM 600816
GSE8881: IMT11 vs ICM88, EE6.5, both down. Preferential expression in unfertilised egg-E3.5 blastocyst developmental stages [29]. Differentially regulated after treatment with Oct4/Nanog RNAi [34].
GSE8766 BG063605 H3009C07 Hspca: Heat shock protein 1, alpha (a.k.a. Hsp86)
Mm.1843 multiple matches
PCR: Array results NOT confirmed, Decline in -LIF expression after D0 in all 6 PCR samples tested. Array: n/a
Implicated in epigenetic modification of chromatin and in increased carcinogenic invasiveness [43]. Like Hspa8, constitutively expressed heat shock protein.
GSE8881: IMT11 vs ICM105, DICM180, up. Downregulated after 4 days exposure to RA [30]. Differentially regulated after treatment with Oct4/Nanog RNAi [34]. Upregulated after 4-3+RA treatment of EBs [15].
GSE8766 BG063569, BG076934.
H3008H05 Ribosomal protein S2 (Rps2) Mm.389704 17 PCR: d3,4-L down vs d0. Decline after day 0. Array: -3.40, Day3-Lif vs. pooled control
GeneID: 16898. Ribosomal protein, involved in translation, methylated by Prmt3.
Preferential expression in ES (+&-Lif) and TS cells [29]. Many ribosomal proteins upregulated after 4-3+RA treatment of EBs [15]
GSE8766 CK335084. H3139H08 Ribosomal protein S28 (Rps28) Mm.352374 equal matches, cs 13 & 2
PCR: D3L, D4L down vs D0. Array: -2.41, day3-Lif vs pooled control
GeneID: 54127. Ribosomal protein involved in translation.
Many ribosomal proteins upregulated after 4-3+RA treatment of EBs [15]
GSE8766 BG069482 H3076A06 RIKEN cDNA 6330409N04 gene (6330409N04Rik)
Mm.282706 PCR: d3,4 +L, up vs day0. d3-L, d4-L, up vs D0, d1-L. Array: 5.92, d0 vs d3+L, 5.29, day 3-L up vs. pooled control
GeneID: 66674. Hypothetical protein, uncharacterised GSE8881: IMT11 vs ICM88, DICM180, EE6.5, all up
GSE8766 BG074976 H3141F09 Rpl8: Ribosomal protein L8 Mm.30066 15 PCR: d3-L down vs d0. Array: -2.045 day 3 -L vs day 0
GeneID: 26961 Ribosomal protein involved in translation.
GSE:8881:IMT11 vs EE6.5, down. Highly represented in male E12.5 mesonephros/gonad and E17 mouse Unigene libraries. Many ribosomal proteins upregulated after 4-3+RA treatment of EBs [15].
GSE8766 BG073685 H3124F08 Rplp1: Ribosomal protein, large, P1
Mm.3158 multiple matches
PCR: d4-L, d3-L down vs. other samples. Array: -3.77, day3-Lif vs pooled control
GeneID:56040. Ribosomal protein involved in translation
GSE8881: IMT11 vs ICM105, EE6.5, both down. Up, 4-3+RA EBs [15]. Diff. reg. Oct4/Nanog RNAi [34]. Highly expressed E15 brain Unigene library. Downregulated at D10 diff vs. D3 [32].
GSE8766 CK334832 H3115E12 Sgce: Sarcoglycan, epsilon Mm.8739 6 PCR: DL up vs D3-L. Array: 2.41, day 4-L up vs day 3-4-L
GeneID: 20392. Mutations cause myoclonus dystonia, 2 isoforms, nervous system function [56]
Differentially regulated after Oct4/Nanog RNAi [34]. Thought to bind and be regulated by Oct4/Nanog [34].
GSE8766 BG074114 H3131A08 Ssr2: Signal sequence receptor, beta
Mm.7091 3 PCR: D1-4-L samples down vs d0, decline from day0. Array: 0.276, day4-L down vs day 0
GeneID:66256. Component of the signal recognition particle that recognizes signal peptides, then transports relevant proteins across the endoplasmic reticulum
GSE8881: IMT11 vs ICM88, ICM105, DICM136 DICM180, EE5.5, EE6.5, all up
GSE8766 BG065267 H3029B05 T: Brachyury Mm.913 17 PCR: Day4-L up vs Day0. Array: 2.31, day 4-Lif vs pooled control
GeneID; 20997. T protein is vital for the formation and differentiation of posterior mesoderm and for axial development in all vertebrates OMIM 601397.
GSE8766 CK334246 H3011G11 Tkt: Transketolase Mm.290692 PCR: d3 + L, up vs D2+L Array: 3.19, day3+Lif vs day2+Lif
GeneID: 21881. Ubiquitous metabolic enzyme, haploinsufficiency causes growth retardation, adipose abnormalities and reduced fertility in female mice [57]. Altered expression in neural differentiation [58]
Differentially regulated after treatment with Oct4/Nanog RNAi [34].
GSE8766 CK334347 H3018E11 Tubb5: Tubulin, beta 5 Mm.472691 17 PCR: D1 down vs D3+L, D2+L , D0 down vs D1-L. Array: -6.10, day 1-Lif vs day0, 3.058, day3+Lif up vs day 1 + Lif
GeneID: 22154 Structural constituent of cytoskeleton OMIM 602662: expressed specifically in fetal and adult brain
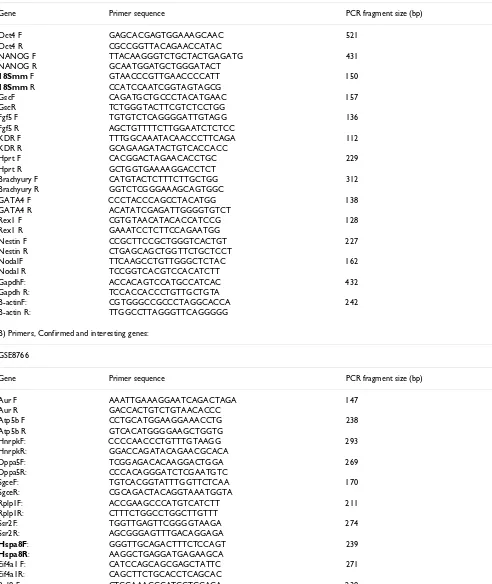
Table 1: Primer sequences.
A) Marker/Housekeeping genes (note: Brachyury, Beta-actin, Hprt and Gapdh also came up in the arrays)
Gene Primer sequence PCR fragment size (bp)
Oct4 F GAGCACGAGTGGAAAGCAAC 521 Oct4 R CGCCGGTTACAGAACCATAC
NANOG F TTACAAGGGTCTGCTACTGAGATG 431 NANOG R GCAATGGATGCTGGGATACT
18Smm F GTAACCCGTTGAACCCCATT 150
18Smm R CCATCCAATCGGTAGTAGCG
GscF CAGATGCTGCCCTACATGAAC 157
GscR TCTGGGTACTTCGTCTCCTGG
Fgf5 F TGTGTCTCAGGGGATTGTAGG 136 Fgf5 R AGCTGTTTTCTTGGAATCTCTCC
KDR F TTTGGCAAATACAACCCTTCAGA 112 KDR R GCAGAAGATACTGTCACCACC
Hprt F CACGGACTAGAACACCTGC 229
Hprt R GCTGGTGAAAAGGACCTCT
Brachyury F CATGTACTCTTTCTTGCTGG 312 Brachyury R GGTCTCGGGAAAGCAGTGGC
GATA4 F CCCTACCCAGCCTACATGG 138 GATA4 R ACATATCGAGATTGGGGTGTCT
Rex1 F CGTGTAACATACACCATCCG 128 Rex1 R GAAATCCTCTTCCAGAATGG
Nestin F CCGCTTCCGCTGGGTCACTGT 227 Nestin R CTGAGCAGCTGGTTCTGCTCCT
NodalF TTCAAGCCTGTTGGGCTCTAC 162 Nodal R TCCGGTCACGTCCACATCTT
GapdhF: ACCACAGTCCATGCCATCAC 432 Gapdh R: TCCACCACCCTGTTGCTGTA
B-actinF: CGTGGGCCGCCCTAGGCACCA 242 B-actin R: TTGGCCTTAGGGTTCAGGGGG
B) Primers, Confirmed and interesting genes:
GSE8766
Gene Primer sequence PCR fragment size (bp)
Aur F AAATTGAAAGGAATCAGACTAGA 147 Aur R GACCACTGTCTGTAACACCC
Atp5b F CCTGCATGGAAGGAAACCTG 238 Atp5b R GTCACATGGGGAAGCTGGTG
HnrpkF: CCCCAACCCTGTTTGTAAGG 293 HnrpkR: GGACCAGATACAGAACGCACA
Dppa5F: TCGGAGACACAAGGACTGGA 269 Dppa5R: CCCACAGGGATCTCGAATGTC
SgceF: TGTCACGGTATTTGGTTCTCAA 170 SgceR: CGCAGACTACAGGTAAATGGTA
Rplp1F: ACCGAAGCCCATGTCATCTT 211 Rplp1R: CTTTCTGGCCTGGCTTGTTT
Ssr2F: TGGTTGAGTTCGGGGTAAGA 274 Ssr2R: AGCGGGAGTTTGACAGGAGA
Hspa8F: GGGTTGCAGACTTTCTCCAGT 239
Hspa8R: AAGGCTGAGGATGAGAAGCA
Eif4a1 F: CATCCAGCAGCGAGCTATTC 271 Eif4a1R: CAGCTTCTGCACCTCAGCAC
Rpl8 F: CTCCAAAGGGATGCTCCACA 238 Rpl8R: GCCACAGTCATCTCCCACAA
(Sigma) containing 15 mM MgCl2 although magnesium concentrations, along with annealing temperature and cycle number, were varied where necessary in order to optimise results. Final PCR conditions are indicated for each gene in the appropriate figures (see Results). Primer sequences are given for all genes tested in Table 1 and Additional File 1. In order to confirm that semi-quantita-tive PCR was indeed representasemi-quantita-tive of expression pattern changes, we studied the expression patterns of two con-firmed genes, Hspa8 and BG063737, by quantitative PCR. Expression pattern changes achieved by q-PCR were very similar to the methods described above. Methods and results are given in Additional File 2[39].
Results
Undifferentiated ES cell arrays
We studied expression differences between 3 ES cell lines, IMT11 (derived from 129 mice), HM1 (which is Hprt neg-ative) and SMHBl6 (derived from C57Bl6/J mice) (GEO,
GSE8625). 21 genes, including Hprt, were identified from the arrays as possibly differentially regulated, four were confirmed by RT-PCR; Hprt, Mki67, Pter and Scmh1 (see Figure 3). Hprt was not expressed in HM1 cells, as expected. Mki67 and Scmh1 were upregulated in IMT11 cells, while Pter was downregulated in SHBl6.3 cells.
Optimisation of embryoid body differentiation
IMT11 ES cells were used to generate EBs of 125, 250, 500, 750 and 1000 cells via hanging drops, using ES medium -LIF and 20% serum (FBS + NBS). An upper limit of 1000 cells was chosen as we often observed substantial interior necrosis and RNA degradation in larger EBs by Day 4 of differentiation. Analysis of EB size measured at day 4 shows little variation in diameter between EBs initiated with a cell number of 500 or greater; size constraints may begin to apply once a certain diameter is reached (Figures 4a + b). RT-PCR showed that 125–500 cell EBs failed to show expression of genes such as brachyury by Day 4.
Fur-BG063704 F: GAACTCCAGACCTCCAGACCA 184 BG063704 R: TTGCTTTGGGCAACAACTGA
Rps2F: TACCTGTTCTCCCTGCCCATT 180 Rps2R: AACACCAAGACCAACGTGACC
BG069915F: GGAGTATGGAACGACCCTCTCA 201 BG069915R: GAGCAGTGATTCTCAACCTTGC
BG067484F: GCCTCGATCAGAAGGACTTG 193 BG067484R: GACCCGCTGAATTTAAGCAT
BG067621F: GCTCCCAAGATCCAACTACGA 257 BG067621R: AGCCTGAGAAACGGCTACCA
Cox4i1F: CGCAGTGAAGCCAATGAAGA 246 Cox4i1R: GCTTTCCCCACTTACGCTGA
Ftl1F: GCTGCCTAGTGGCTTGAGAGG 216 Ftl1R: ATGGGCAACCATCTGACCAA
TktF: TATGGACTGGCCCTCGCTAA 286
TktR: GGGAGCCACAGAGGTTGATG
BG063737F: GACGAGCACACAGGGAAACC 300
BG063737R; GGAGAGAAGGAGGGGCAAGA
BG069482F: CCCTCGGATACCTGATGCTG 167 BG069482R: TGAGAAATGACGGAGCCTTG
Tubb5F: TGGGAGGTGATAAGCGATGAA 257 Tubb5R: GGCCTTTAGCCCAGTTGTTG
Rps28 F: CAGGTGCGAGTGGAATTCATG 198 Rps28 R: TGCTTTATTTAACAGTTGCAGATCA
H3133B01F: CAGCCATTCAGCAAAGGAGA 283 H3133B01R: TCTTGGGCAGGGTCTGTAGG
H3134D10 F: GCTCGGCTGTGTCAAGATGAAG 227 H3134D10 R: CATGGGTCAGAACACCTTGCTT
GSE8625:
Mki67F: CCTTGGCTTAGGTTCACTGTCC 250 Mki67R: TGCAGAATCCAGATGATGGAGC
PterF; CATGTCCCACCTTGACAGGAC 245 PterR; CCGTACTTCATCAACCGATGC
Scmh1F: GGACCCAGTGTAGGAAGAGAGACC 206 Scmh1R: ATTGCTTCTGGCGTTTGGAC
[image:8.612.58.555.89.489.2]Primers in bold were also used for Q-PCR.
thermore, the amounts of RNA retrieved were insufficient for array analysis at Days 1 and 2 (results not shown). 750 and 1000 cell EBs showed expression of markers of all 3 germ layers (see below), and gave a better RNA yield at days 1 and 2.
Higher serum concentrations are known to promote maintenance of pluripotency in cultures of undifferenti-ated ES cells, and also provide more nutrients and pH sta-bility to the medium. We generated random, 750 cell and 1000 cell EBs in ES media without LIF, containing 0, 5, 10, 15 and 20% serum (1:1 mix of FBS + NBS). EBs cultured with no serum were dead after 24 hours and are therefore not shown in data analysis. Measurements of EB diameter showed that 20% serum promoted the largest EBs at Day 4 for 750 cell and randomly generated EBs, while 1000 cell EBs reached similar sizes with 15% and 20% serum concentrations (Figure 4b). RNA was extracted at days 1– 4 of differentiation and analysed by RT PCR. Results are shown in Figures 5, 6 and 7. The greatest range of gene expression was noted on days 3–4 in concentrations of 15–20% serum (Figures 5, 6 and 7). Moreover, Fgf5 was only expressed in EBs with a starting size of 1000C. One should note that the higher serum concentrations also promote the maintenance within the EB of undifferenti-ated cells; the expressions of markers of pluripotency such
as Oct4, Nanog and Rex1 diminish at Day 4 in 5% serum, but maintain and even increase expression levels at 15– 20% serum. Given more varied gene expression profiles (suggesting that a greater range of cell types could be obtained eventually from such a protocol over time), size and greater RNA yield, we decided to use 1000 cell EBs grown in 20% serum for our subsequent array experi-ments.
Array analysis
Array results from Day 1–4 EBs, grown in both the pres-ence and the abspres-ence of LIF, were compared at all stages with the pooled control (equal amounts of Day 0–4 ES cells + EBs, both with and without LIF), and also with each other, when analysing the arrays. 128 ESTs selected for fol-low-up were differentially regulated in all 4 repeats and were statistically significant according to SAM. Many ESTs were differentially regulated in more than one compari-son. Removal of redundancy (more than one EST map-ping to different parts of the same gene) and elimination of those ESTs where sequence quality was insufficient for primer design resulted in a master list of 104 genes. Nota-bly, beta-actin and Gapdh were differentially regulated, so 18S rRNA was used as a housekeeping gene instead.
Given problems with reproducibility that have been noted with stem cell arrays [20-22], RT-PCRs were carried out on 3 sets each of 1000 cell and 750 cell EB samples; differentially regulated genes showed a reproducible expression pattern change in at least 4/6 samples. 18 genes were differentially regulated in -LIF samples; a fur-ther 8 were differentially regulated in + LIF samples. 3 genes appeared in both datasets (Tubb5 and 2 uncharac-terised genes; BG063737 and BG069482, see Figures 8 and 9 and Figures 1 and 2). None of these 23 genes appeared in the list of 3 that were differentially regulated between different undifferentiated ES cell lines (GSE8625). A further 3 genes did not show the exact expression patterns predicted by the array, but were dra-matically downregulated on induction of differentiation and are therefore also presented in Figure 8. This gave a total of 26 genes we deemed differentially regulated dur-ing ES cell differentiation. Q-PCR analysis of two con-firmed genes, Hspa8 and BG063737, gave very similar results to semi-quantitative PCR (Additional File 2).
We then compared this dataset with that from another of our array experiments, which compared undifferentiated IMT11 ES cells with embryonic inner cell masses (the tis-sue from which ES cells are derived) and day 5.5 and day 6.5 embryonic ectoderm (see Figures 1 and 2, GSE8881, methods described [24]), Thirteen of the above 26 genes were also up- or down-regulated in this study, indicating their importance in early development and differentia-tion. Fourteen of the known genes were also noted in Genes confirmed as differentially regulated between the 3
different undifferentiated ES cell lines, HM1, SHBl6.3 and IMT11
Figure 3
Genes confirmed as differentially regulated between the 3 different undifferentiated ES cell lines, HM1,
SHBl6.3 and IMT11. Ann = PCR annealing temperature,
Cyc = number of PCR cycles used. Beta-actin was not used as a housekeeping control as the arrays noted it as variable. It was variable, but the variation in expression patterns between repeats was very high, such that array results for this gene could not be confirmed. 4 genes were confirmed; Mki67 and Scmh1 showed highest expression in IMT11 cells, Pter showed lower expression in SHBl6.3 cells than in the other two lines, while Hprt expression was absent from HM1 cells as expected.
Gene AnnoC Cyc
18S rRNA 62 23
Gapdh 62 21
Hprt 62 23
Mki67 62 28
Pter 62 30
Scmh1 62 30
HM
1
S
H
B
l6.3
IM
T
11
HM
1,
No
R
T
SH
B
l6
.3
, N
o
R
T
IMT1
1
, N
o
R
(a) Diameter of EBs at Day 4-LIF plotted against the initial number of cells aggregated via hanging drop on Day 0 b) Diameter of EBs at Day 4-LIF plotted against the serum concentration in the differentiation medium and initial number of cells aggregated via hanging drop on Day 0
Figure 4
(a) Diameter of EBs at Day 4-LIF plotted against the initial number of cells aggregated via hanging drop on Day 0 b) Diameter of EBs at Day 4-LIF plotted against the serum concentration in the differentiation medium
and initial number of cells aggregated via hanging drop on Day 0.
A
other array or subtractive EST library studies using mate-rial from different ES cell differentiation experiments (see Figures 1 and 2). Interestingly, two of the four genes that varied between undifferentiated cell lines were also iden-tified by this study.
Amplification from single EBs
Our arrays have successfully identified 23 genes that show expression changes during EB differentiation (plus an additional 3 that did not show the exact expression changes indicated by the array). However, 23 genes repre-sents a low confirmation rate (22%) given the initial 104 genes tested. The consistency of gene expression in indi-vidual embryoid bodies was therefore tested in order to assess how this variation might influence the reproduci-bility of ES differentiation protocols that are based on EBs. We studied 10 individual 1000 cell Day 4 EBs from the same tissue culture dish and 2 small, 2 medium and 2 large EBs from a similar plate of Day 4-L randomly aggre-gated EBs (medium represented the same size as those derived from the hanging drop method, large EBs were roughly double this size, while small ones were half this
size). 18S rRNA was used as a housekeeping gene control. Expression of Gapdh and Hprt was noted in most EBs, albeit at varying levels. Expression of Nodal and Rex1 was also noted in a majority of samples. Nanog, Oct4, Goose-coid and beta-actin were expressed in 50% or less of EBs, while Afp, Kdr, Brachyury and Fgf5 were expressed in 1–3 EBs out of 16 only (Figure 10).
Discussion
We have shown that undifferentiated mouse ES cells, regardless of strain of origin, or absence of Hprt, maintain a very invariant expression pattern under identical culture conditions. Given genetic variation between mouse strains of origin (129Sv/Ev and C57Bl6/J) and absence of the Hprt gene in one line, this result is perhaps surprising, but would imply that the culture conditions that maintain pluripotency may be quite restrictive in terms of gene expression pattern. Hprt was not expressed in HM1 cells as expected. The relevance of Pter differential regulation is unclear, unless this gene is functionally associated with the Hprt pathway. Mki67 is a marker of proliferating cells; its upregulation in IMT11 cells might suggest a higher
RT-PCR of key marker genes (involved in maintenance of pluripotency or early development) and housekeeping controls at varying medium serum concentrations
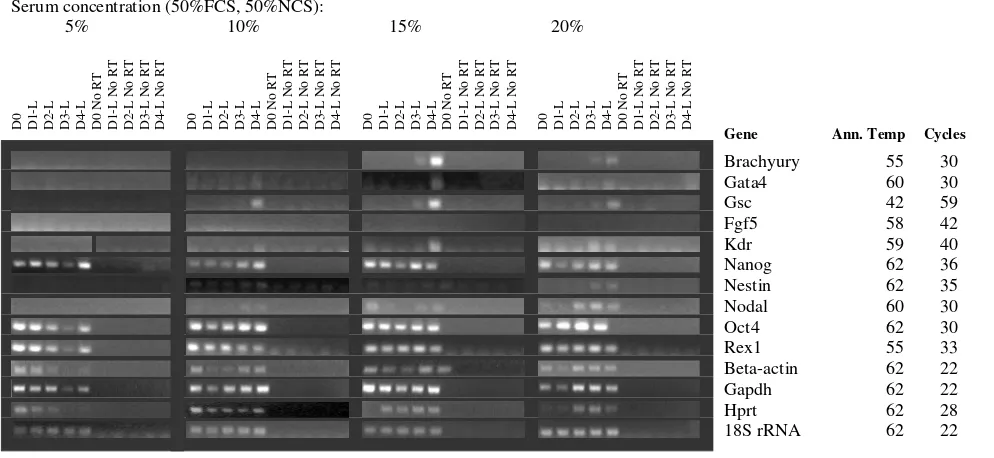
Figure 5
RT-PCR of key marker genes (involved in maintenance of pluripotency or early development) and
housekeep-ing controls at varyhousekeep-ing medium serum concentrations. Starting size 750 cells. Marker Genes: Oct4, Rex1 and Nanog
are markers of ES cell pluripotency, Beta-actin, Gapdh, Hprt and 18S rRNA are commonly used housekeeping genes; however, we have found that the first 3 vary unpredictably in expression during differentiation. Brachyury and nestin are markers of early mesodermal and neurectodermal differentiation respectively; Nestin is considered a CNS stem cell marker. Goosecoid is a marker of the Spemann organizer and gastrulation. Gata 4 is expressed in yolk sac endoderm and during heart formation. Nodal is expressed during gastrulation and is involved in anterior-posterior and visceral endodermal patterning. Kdr (a.k.a. Flk1, VegfR) is exclusively expressed in endothelial cells and defines multipotent haematopoietic stem cells. Fgf 5 is a marker of primitive ectoderm.
Serum concentration (50%FCS, 50%NCS):
5% 10% 15% 20%
Gene Ann. Temp Cycles
Brachyury 55 30
Gata4 60 30
Gsc 42 59
Fgf5 58 42
Kdr 59 40
Nanog 62 36
Nestin 62 35
Nodal 60 30
Oct4 62 30
Rex1 55 33
Beta-actin 62 22
Gapdh 62 22
Hprt 62 28
18S rRNA 62 22
growth rate, although this has not been tested. Scmh1 may be involved in the meiotic prophase of male germ cells; ES cells are similar to germ cells, but the significance of the differential expression is unclear. We should note that, apart from HM1, expression differences noted were minor. We selected IMT11 cells for further study.
EB growth optimisation shows that EBs of 500–1000 cells reach a size plateau at 20% serum, suggesting that size constraints apply to growth once a certain size is reached. This may be related to the decreased rate of gas and nutri-ent diffusion to cells in the cnutri-entres, but EBs are thought to be loosely packed and should therefore not suffer from a buildup of toxic waste products [40,41] EBs created using cell numbers of 1–1000 were previously found to attain a maximum of approximately 30,000 cells on Day 12 of dif-ferentiation, regardless of culture methods used or initial cell number [41]. Alternatively, growth constraints may arise from the absence of some necessary developmental cue, signalling during cavitation or from decreased cell
division rates upon initiation of differentiation, which may happen sooner with a larger initial size [41,42].
Variation of initial size and serum concentration also influences gene expression patterns after 4 days of differ-entiation. We selected an initial size of 1000 cells and a serum concentration of 20% for our array experiments, on the grounds that these conditions were optimal for growth (and therefore RNA yield), gave the widest range of marker gene expression (implying a greater range of dif-ferentiated progeny) and were likely to bear more similar-ity to early embryonic differentiation.
Microarrays have identified 23 genes, which are differen-tially regulated during ES cell differentiation; a further 3, while not demonstrating the expression patterns pre-dicted by the array, showed dramatic down-regulation upon induction of differentiation without LIF and are therefore discussed here. Detailed synopses of functional information available is given in Figure 1; a number of functional studies are also of interest [43-59].
RT-PCR of key marker genes (involved in maintenance of pluripotency or early development) and housekeeping controls at varying medium serum concentrations
Figure 6
RT-PCR of key marker genes (involved in maintenance of pluripotency or early development) and
housekeep-ing controls at varyhousekeep-ing medium serum concentrations. Starting size 1000 cells. Marker Genes: Oct4, Rex1 and
Nanog are markers of ES cell pluripotency, Beta-actin, Gapdh, Hprt and 18S rRNA are commonly used housekeeping genes; however, we have found that the first 3 vary unpredictably in expression during differentiation. Brachyury and nestin are mark-ers of early mesodermal and neurectodermal differentiation respectively; Nestin is considered a CNS stem cell marker. Goo-secoid is a marker of the Spemann organizer and gastrulation. Gata 4 is expressed in yolk sac endoderm and during heart formation. Nodal is expressed during gastrulation and is involved in anterior-posterior and visceral endodermal patterning. Kdr (a.k.a. Flk1, VegfR) is exclusively expressed in endothelial cells and defines multipotent haematopoietic stem cells. Fgf 5 is a marker of primitive ectoderm.
Serum concentration (50%FCS, 50%NCS):
5% 10% 15% 20%
D0 D1 -L D2 -L D3 -L D4 -L D0 No R T D1 -L No R T D2 -L No R T D3 -L No R T D4 -L No R T D0 D1 -L D2 -L D3 -L D4 -L D0 No R T D1 -L No R T D2 -L No R T D3 -L No R T D4 -L No R T D0 D1 -L D2 -L D3 -L D4 -L D0 No R T D1 -L No R T D2 -L No R T D3 -L No R T D4 -L No R T D0 D1 -L D2 -L D3 -L D4 -L D0 No R T D1 -L No R T D2 -L No R T D3 -L No R T D4 -L No R T
Gene Ann. Temp Cycles
Brachyury 55 30
Gata4 60 30
Gsc 42 59
Fgf5 58 42
Kdr 59 40
Nanog 62 36
Nestin 62 35
Nodal 60 30
Oct4 62 30
Rex1 55 33
Beta-actin 62 22
Gapdh 62 22
Hprt 62 28
13 of these genes are implicated in the early development of pre- and post- implantation embryos, while 14 are highlighted by other studies and/or preferentially expressed in embryonic EST libraries. Given the variation in ES cell lines, differentiation protocols and timepoints studied by others, this overlap is reasonably significant [15,29-38]. The functions of 7 ESTs and 1 hypothetical protein are presently uncharacterised.
The remaining genes fall into a number of different classes. Hspca (a.k.a Hspc1, Hsp89a, Hsp90a) and Hspa8 are immediately downregulated on induction of differen-tiation. Both are constitutively expressed heatshock pro-teins, a class of proteins commonly upregulated in response to cellular stress (OMIM 140571) and also implicated in ES differentiation [43]. Heatshock proteins can function as chaperones; ie, they assist in the correct folding of nascent proteins. Ssr2, another protein down-regulated upon onset of differentiation, is also associated with nascent polypeptides, although it forms part of a complex that recognises signal peptides, resulting in
trans-port of the relevant protein across the endoplasmic reticu-lum. Hspca has been implicated in epigenetic modifications of chromatin (disruption during Drosophila development results in heritable morphogenic altera-tions) and in increased carcinogenic invasiveness [44]. Pluripotent cells, such as ES cells, demonstrate uniquely dynamic chromatin, "breathing chromatin", which allows availability of a large proportion of the genome for imme-diate transcriptional activity [45]. Perhaps reductions in Hspca expression during differentiation may result in changes to chromatin structure that result in the tighter histone binding characteristic of differentiated cells and their committed precursors.
Notably, a related class of 5 genes also shows downregu-lation upon initiation of differentiation; Eif4a1, Rplp1, Rpl8, Rps2 and Rps28. Eif4a1 encodes a translation initi-ation factor that could be involved in selective reguliniti-ation of protein expression, while the remaining four genes are structural constituent of the ribosome. Expression of Eif4a1 is associated with increased metastasis in certain RT-PCR of key marker genes (involved in maintenance of pluripotency or early development) and housekeeping controls at varying medium serum concentrations
Figure 7
RT-PCR of key marker genes (involved in maintenance of pluripotency or early development) and
housekeep-ing controls at varyhousekeep-ing medium serum concentrations. EBs formed via random aggregation. Marker Genes: Oct4,
Rex1 and Nanog are markers of ES cell pluripotency, Beta-actin, Gapdh, Hprt and 18S rRNA are commonly used housekeeping genes; however, we have found that the first 3 vary unpredictably in expression during differentiation. Brachyury and nestin are markers of early mesodermal and neurectodermal differentiation respectively; Nestin is considered a CNS stem cell marker. Goosecoid is a marker of the Spemann organizer and gastrulation. Gata 4 is expressed in yolk sac endoderm and during heart formation. Nodal is expressed during gastrulation and is involved in anterior-posterior and visceral endodermal patterning. Kdr (a.k.a. Flk1, VegfR) is exclusively expressed in endothelial cells and defines multipotent haematopoietic stem cells. Fgf 5 is a marker of primitive ectoderm.
Serum concentration, percentage media volume (mix of 50%FCS, 50%NCS):
5% 10% 15% 20%
Gene Ann. Temp Cycles
Brachyury 55 30
Gata4 60 30
Gsc 42 59
Fgf5 58 42
Kdr 59 40
Nanog 62 36
Nestin 62 35
Nodal 60 30
Oct4 62 30
Rex1 55 33
Beta-actin 62 22
Gapdh 62 22
Hprt 62 28
18S rRNA 62 22
cancers [46], can stimulate cell growth in hepatoma cells [47] and is enriched in populations of human ES cells [48]. We have previously noted the upregulation of simi-lar genes involved in translation in response to neural dif-ferentiation of ES cells [15]; however, this upregulation was noted after 7 days of EB differentiation, following the addition of retinoic acid on Day 4. It is possible that ribos-omal constituents may play a role in complex changes that occur in gene expression in response to changing sig-nals at different stages of differentiation.
A third class of genes comprises those that are involved in energy metabolism and other ubiquitous metabolic proc-esses (Atp5b, Cox4i1, Ftl1, transketolase, Hnrpk). Energy and metabolic requirements may change during differen-tiation; alternatively, these genes may have alternative functions in these processes. Perhaps surprisingly, only 3 genes, Brachyury, Aurkb and Dppa5 have identified roles in the maintenance of pluripotency, epigenetic remodel-ling and early development (see Figure 1); we would have expected this class of gene to be better represented.
How-ever, larger EBs maintain a core of pluripotent cells that maintain LIF expression and also, therefore, continue to express genes such as Oct4, Nanog and Rex1 for some time. This is obvious from our PCRs of these marker genes; expression can dip a little on Day 1 but normally resumes by Day3–4 of differentiation. Other genes, such as Laminin, are known to display differential expression during early development; laminin was among the 104 genes selected for PCR confirmation. However, expression varied so much between PCR replicates that there was no consistent pattern of variation. This finding was common to a majority of the genes tested; this would not rule out their importance to early developmental processes, how-ever, it would suggest that those genes that did show con-sistent expression changes may indeed be very important to early development; we were stringent in our selection of differentially regulated genes.
[image:14.612.61.556.90.399.2]The identification of 26 genes which alter in expression pattern in ES cell differentiation will aid the understand-ing of early development and in vitro differentiation. Confirmed genes, up- or down-regulated during differentiation without LIF
Figure 8
Confirmed genes, up- or down-regulated during differentiation without LIF. Ann temp = PCR annealing
tempera-ture, Cycles = number of PCR cycles used. Expression change marks the direction of expression changes as shown by RT-PCR. Consistency 1000C, 750C refers to the number of replicates out of three that show the same change (always at least 2), this information is given as space constraints prevent showing all.
1000C 1000C 750C
D0 D1
-L
D2
-L
D3
-L
D4
-L
D0
No
RT
D1
-L
N
o
RT
D2
-L
N
o
RT
D3
-L
N
o
RT
D4
-L
N
o
RT
D0 D1
-L
D2
-L
D3
-L
D4
-L
D0
No
RT
D1
-L
N
o
RT
D2
-L
N
o
RT
D3
-L
N
o
RT
D4
-L
N
o
RT
D0 D1
-L
D2
-L
D3
-L
D4
-L
D0
No
RT
D1
-L
N
o
RT
D2
-L
N
o
RT
D3
-L
N
o
RT
D4
-L
N
o
RT
Gene Ann. Cycles Expression Consistency
Temp change 1000C, 750C
Confirmed genes, up- or down-regulated during differentiation in the presence of LIF. Figure 9
Confirmed genes, up- or down-regulated during differentiation in the presence of LIF. Ann temp = PCR annealing
temperature, Cycles = number of PCR cycles used. Expression change marks the direction of expression changes as shown by RT-PCR. Consistency 1000C, 750C refers to the number of replicates out of three that show the same change (always at least 2), this information is given as space constraints prevent showing all.
1000C 1000C 750C
D0 D1
+L
D2
+L
D3
+L
D4
+L
D0
No
RT
D1
+L
No
RT
D2
+L
No
RT
D3
+L
No
RT
D4
+L
No
RT
D0 D1
+L
D2
+L
D3
+L
D4
+L
D0
No
RT
D1
+L
No
RT
D2
+L
No
RT
D3
+L
No
RT
D4
+L
No
RT
D0 D1
+L
D2
+L
D3
+L
D4
+L
D0
No
RT
D1
+L
No
RT
D2
+L
No
RT
D3
+L
No
RT
D4
+L
No
RT
Gene Ann. Cycles Expression Consistency Temp change 1000C, 750C
Aurkb 56 31 D0-3<D4 2/3 3/3 BG063704 62 35 D0<D3 3/3 3/3 BG063737 62 22 D0<D3,4 3/3 3/3 BG067621 62 22 D0<D3 3/3 3/3 BG069482 62 29 D0<D3,4 3/3 2/3 Cox4i1 62 22 D0<D3,4 3/3 3/3 Tkt1 62 19 D2<D3 2/3 2/3 Tubb5 62 24 D0>D1 2/3 2/3 18S rRNA 62 22 control
Expression of differentiation markers in EB differentiation Figure 10
Expression of differentiation markers in EB differentiation. EBs were allowed to differentiate in standard ES medium
-LIF for 4 days. To determine whether each EB was consistently expressing marker genes or if these genes were only expressed in a minority of EBs, we used an RNA amplification kit to carry out one round of amplification on RNA from 16 individual EBs harvested on day 4 of differentiation, -LIF. Ten (1–10) were derived from 1000 cell hanging drops and were of similar sizes. We also harvested 6 EBs which had been allowed to aggregate randomly in solution, these were varied in size: 2 large (L1+L2), 2 medium (M1+M2) and 2 small (S1+S2). Medium EBs were the same size as those obtained from the hanging drops.
1 2 3 4 5 6 7 8 9 10 L1 L2 M1 M2 S1 S2 1 noR
T
2 noR
T
3 noR
T
4 noR
T
5 noR
T
6 noR
T
7 noR
T
8 noR
T
9 noR
T
10 noR
T
L1
n
o
R
T
L2
n
o
R
T
M
1
noR
T
M
2
noR
T
S
1
noR
T
S
2
noR
T
Gene cycles annealing
temp oC
Beta-actin 62 29
Afp 55 40
Brachyury 55 40 Fgf5 62 45 Gapdh 62 26
Gsc 62 45
Hprt 58 32
Kdr 59 45
However, there are important implications of the low confirmation rates noted in this paper, and of the variabil-ity in marker gene expression profiles between individual EBs of homogeneous cell number and size, which origi-nated from two tissue culture dishes. Firstly, ES differenti-ation protocols using EBs as a starting point may always generate very variable results, despite attempts to stand-ardize them such as using a uniform EB starting size. This would necessarily limit their therapeutic use; develop-ment of differentiation protocols that yield more uniform populations of progenitors without the use of EBs may be preferable (such as the majority of current neural differen-tiation methods)[17,18]. On the other hand, the ability of EBs to generate a wide variety of precursors that could later be selected for subtypes of choice may be an advan-tage in certain circumstances. Secondly, this finding would imply that the lack of directional orientation in EBs as compared to early embryos is a source of chaotic varia-bility.
Conclusion
Stem cells provide, potentially, an unparalleled opportu-nity for treatment of any number of degenerative condi-tions. A deeper knowledge of stem cell differentiation and of signalling pathways activated therein, will increase our ability to direct the differentiation of stem cells in vitro. This study has advanced our knowledge of early ES cell differentiation in several key respects. Firstly, we have demonstrated that regardless of underlying genetic varia-tion, the constraints of ES cell pluripotency seem to main-tain a relatively invariant gene expression profile. Secondly, we have developed optimised tissue culture conditions that allow the widest range of differentiation potential. Thirdly, we have identified genes that are impli-cated by this study and others in the complex processes of early development; furthermore, given the number of bio-logical repetitions and the EB size variation used when confirming these genes, we would regard our results as robust. Perhaps most importantly, when investigating low confirmation rates, we have shown that gene expression patterns of individual EBs vary markedly from each other, even when grown from the same number of starting cells, in the same culture. This implies that differentiation pro-tocols involving EBs may always yield varying proportions of different cell types, no matter how rigorously condi-tions are controlled between different experimental repli-cates, and may suggest that a move away from EB based differentiations may be warranted, where possible.
Authors' contributions
FCM carried out array analysis (GSE8625, GSE8766), bio-informatics, primer design, marker gene PCRs, most pro-tocol optimisations, PCR confirmations (GSE8625), GEO submissions, individual embryoid body amplifications
and PCR, manuscript preparation, submission and revi-sions. CSD provided EB RNA samples for PCR, most PCR confirmations (GSE8766) and q-PCR. ALH completed all array hybridizations, array experimental design and image analysis leading to provision of raw array data. MAW car-ried out image and statistical analysis of EB diameters, preparation of Figure 3, manuscript editing, figure compi-lation and assistance with bioinformatics. SMH carried out all experimental + some analytical work connected to GSE8881, as well as study conception and design, provi-sion of logistical support and funding, superviprovi-sion of par-ticipants, assistance with analysis and interpretation, tissue culture protocol optimization and manuscript edit-ing. MJE was responsible for study conception and design, GSE8881 array analysis, logistical support and funding, supervision of participants, assistance with interpretation, manuscript editing. All authors have read the manuscript
Additional material
Acknowledgements
This work was funded by BBSRC, the Wales Gene Park, the Royal Society and HEFCW. We would like to thank Steve Turner, Steffan Adams and Vicky Workman (Cardiff University Array facility) for their help with micro-arraying. FCM is currently supported by RP Ireland, Fighting Blindness.
Additional file 1
This table lists names and primer sequences of genes that were identi-fied by both array experiments, but not confirmed.
Click here for file
[http://www.biomedcentral.com/content/supplementary/1471-213X-9-5-S1.doc]
Additional file 2
Q-PCR confirmation of expression patterns of Hspa8 and BG063737 and comparison with semi-quantitative PCR results. Q-PCR confirma-tion of expression patterns of Hspa8 and BG063737 and comparison with semi-quantitative PCR results. Q-PCR was carried out using an MJ-Research Peltier Thermal Cycler PTC-200 PCR machine and results were analysed using MJ Opticon Monitor 3.1.32 software using previously described methods [39]. Reaction volumes were 25 l, comprised of 5 l cDNA, 12.5 PCR mix from the DyNAmo HS SYBR Green qPCR kit (Finnzymes) and 7.5 l primer mix (25 picomolar). Cycles were as fol-lows: 95°C for 15 mins followed by 34 cycles of 95°C for 30 s, 62°C for 30 s and 72°C for 30 s. Primer sequences are given in Table 1. In order to compare results with those obtained from semi-quantitative PCR, we used Scion Image (Scion Corporation) to measure relative band intensi-ties for 3 repetitions, and processed the figures with reference to the Day 0 sample and the 18S housekeeping gene, such that they were in a similar format to the figures obtained by Q-PCR. While the figures obtained are not identical, the expression patterns seen in terms of trends of differential regulation are very similar; Hspa8 declines in expression from Day 0 while BG063737 dips at day 1-L and peaks at Day 3-L.
Click here for file