A Neurotrophic Model of the Development of the
Retinogeniculocortical Pathway Induced by Spontaneous
Retinal Waves
Terry Elliott and Nigel R. Shadbolt
Department of Psychology, University of Nottingham, Nottingham, NG7 2RD, United Kingdom
The development of the retinogeniculate pathway or the geniculocortical pathway, or both, occurs either before birth or before eye opening in many species. It is widely believed that spontaneous retinal activity could drive the segregation of af-ferents into eye-specific laminae or columns and the refinement of initially diffuse receptive fields and the emergence of orderly, retinotopic organization. We show that a recent computational model that generates a phenomenologically accurate represen-tation of spontaneous retinal activity can indeed drive afferent segregation and, more particularly, topographic and receptive field refinement in the retinogeniculocortical system. We use a model of anatomical synaptic plasticity based on recent data suggesting that afferents might compete for limited amounts of retrograde neurotrophic factors (NTFs). We find that afferent segregation and receptive field formation are disrupted in the presence of exogenous NTFs. We thus predict that infusion of NTFs into the lateral geniculate nucleus should disrupt normal
development and that the infusion of such factors into the striate cortex should disrupt receptive field refinement in addi-tion to the well known disrupaddi-tion of ocular dominance column (ODC) formation. To demonstrate that the capacity of our model of plasticity to drive normal development is not restricted just to spontaneous retinal activity, we also use a coarse representa-tion of visually evoked activity in some simularepresenta-tions. We find that such simulations can exhibit the formation of ODCs followed by their disappearance, reminiscent of the New World marmoset. A decrease in interocular correlations stabilizes these ODCs. Thus we predict that divergent strabismus should render mar-moset ODCs stable into adulthood.
Key words: spontaneous retinal activity; neurotrophic inter-actions; ocular dominance columns; receptive field refinement; neuronal development; lateral geniculate nucleus; striate cor-tex; mathematical models
The development of the retinogeniculocortical pathway in Old World primates occurs largely prenatally (Rakic, 1976, 1977, 1981; LeVay et al., 1980; Rakic and Riley, 1983; Horton and Hocking, 1996a), whereas the development of the retinogenicu-late but not the geniculocortical pathway in carnivores such as the cat (Shatz, 1983) and the ferret (Linden et al., 1981) occurs largely prenatally or before eye opening. In the retinogeniculate system, such development consists in, for example, the segrega-tion of initially overlapping afferents into eye-specific laminae in the lateral geniculate nucleus (LGN) (Rakic, 1977; Shatz, 1983) and the establishment of an orderly, topographic representation of the retinas in the LGN (Sanderson, 1971; Malpeli and Baker, 1975). The segregation of retinogeniculate afferents into eye-specific laminae appears to be a competitive, activity-dependent process (Rakic, 1981; Sretavan and Shatz, 1986; Penn et al., 1998), and comparison of the retinogeniculate system with the develop-ing or regeneratdevelop-ing retinotectal system in lower vertebrates such as amphibia and fish suggests that the establishment of refined receptive fields and topography is an activity-dependent process (Meyer, 1983; Schmidt and Edwards, 1983; Schmidt and Eisele, 1985). In the geniculocortical system, the prenatal development in Old World primates results in, for example, the segregation of initially overlapping geniculocortical afferents into a mosaic of
eye-specific regions called ocular dominance columns (ODCs) (Hubel and Wiesel, 1962; Rakic, 1976, 1977; LeVay et al., 1980; Horton and Hocking, 1996a) and, again, an orderly, topographic representation of the retinas on the striate cortex (Van Essen et al., 1984; Tootell et al., 1988). The segregation of geniculocortical afferents into ODCs, like the segregation of retinogeniculate afferents into eye-specific laminae in the LGN, is believed to be an activity-dependent, competitive process (Guillery and Stel-zner, 1970; Hubel and Wiesel, 1970; Guillery, 1972; LeVay et al., 1978, 1980; Shatz and Stryker, 1978; Reiter et al., 1986; Stryker and Harris, 1986).
Because these developmental processes occur in the absence of vision, with some early processes occurring even before the development of photoreceptors in the retina, it is thought that spontaneous neuronal activity could drive the early development of the visual system. One possible candidate for such activity is the spontaneous waves of activity that sweep across the retinal ganglion cell layer of the developing retina (Galli and Maffei, 1988; Maffei and Galli-Resta, 1990; Meister et al., 1991; Wong et al., 1993, 1995; Feller et al., 1996, 1997; Penn et al., 1998). Spontaneous retinal waves are known to be transmitted to the LGN (Mooney et al., 1996), and they could also be relayed to the striate cortex. Very recently, the blockade of such waves in one eye before eye opening in the ferret has been shown to lead to an increased representation of the active eye and a decreased rep-resentation of the inactive eye in the LGN (Penn et al., 1998). The spatiotemporal correlations that exist in retinal waves are thought to be suitable for driving not only afferent segregation but also receptive field and topographic refinement (Katz and Shatz, Received Jan. 21, 1999; revised June 29, 1999; accepted June 30, 1999.
This work was supported by a Royal Society University Research Fellowship (T.E.).
Correspondence should be addressed to T. Elliott, Department of Psychology, University of Nottingham, Nottingham, NG7 2RD, UK.
1996). However, to date, no experimental or theoretical approach has demonstrated this, although some computational models us-ing phenomenologically inaccurate representations of spontane-ous retinal activity have been shown to lead to topographic refinement or ODC formation, or both, as have coarse represen-tations of visually evoked activity (von der Malsburg and Willshaw, 1976; Fraser and Perkel, 1989; Montague et al., 1991; Goodhill, 1993; Sirosh and Miikkulainen, 1997).
If spontaneous retinal activity might underlie the activity de-pendence of these developmental processes, then what underlies their competitive nature? At least in the ocular dominance sys-tem, much evidence strongly implicates retrograde neurotrophic factors (NTFs), particularly the neurotrophins. For example, in-traventricular infusion of nerve growth factor prevents or tem-pers a response to monocular deprivation in the rat (Maffei et al., 1992; Berardi et al., 1993; Domenici et al., 1993; Yan et al., 1996) and the cat (Carmignoto et al., 1993). In ferret kits, neurotrophin-4, but no other neurotrophin, prevents the atrophy of LGN cell bodies controlled by the deprived eye during mon-ocular deprivation (Riddle et al., 1995). Finally, cortical infusion of brain-derived neurotrophic factor or neurotrophin-4 (Cabelli et al., 1995) or substances that scavenge these factors (Cabelli et al., 1997) prevents the formation of ODCs. The production of some NTFs in the striate cortex is activity dependent (Castren et al., 1992; Bozzi et al., 1995; Schoups et al., 1995), and in the hippocampus the production and release of NTFs depend on neuronal activity (Zafra et al., 1991; Gwag and Springer, 1993; Lindholm et al., 1994; Blo¨chl and Thoenen, 1995, 1996; Griesbeck et al., 1995; Goodman et al., 1996). Taken together, these results suggest that a limited supply of NTFs might be the source of competitive dynamics (Purves, 1988).
In this paper, we apply a mathematically well characterized neurotrophic model of anatomical synaptic plasticity (Elliott and Shadbolt, 1998a,b) to the development of the retinogeniculocor-tical pathway. For most of our simulations, we use a recently developed model that generates a phenomenologically accurate representation of spontaneous retinal waves (Feller et al., 1997) to provide retinal stimulation to the simulated visual pathway. Our aim is to demonstrate that, at least in the context of small simulations, realistic spontaneous retinal activity can indeed drive normal development, specifically the refinement of recep-tive fields and initially coarse topography. We also seek to dem-onstrate that a neurotrophic model can account for a wide range of developmental processes at different stages in the visual sys-tem. To demonstrate that the utility of our neurotrophic model is not restricted to simulations using just spontaneous retinal activ-ity, we also use a coarse representation of visually evoked retinal activity.
MATERIALS AND METHODS
In this section we first discuss the construction of patterns of retinal activity, using either realistic spontaneous retinal activity or coarse, visually evoked retinal activity. We also discuss the anatomical architec-ture of both a simple model of one retinal sheet innervating one LGN sheet and a full model of the retinogeniculocortical pathway in which two retinal sheets, two LGN sheets, and one cortical sheet are simulated. We describe how retinal activity propagates through these networks to the LGN and the cortex. We next discuss our model of anatomical synaptic plasticity, based on our neurotrophic theory. Finally we discuss the visualization of target-sheet topography.
Anatomical architecture and activity patterns.We typically simulate two patches of visuotopically equivalent retina, one for the left eye and one for the right eye. For most simulations we construct spontaneous patterns of activity in these retinas following closely the model of Feller et al.
(1997). We will also present some simulations in which we use, instead, patterns of retinal activity that are a coarse representation of visually evoked activity, following closely the approach of Goodhill (1993). For our current purposes, we do not distinguish between different cell types, for example between X and Y cells or between ON- and OFF-type cells, because we are interested in more general issues of topographic refine-ment and afferent segregation.
In brief, the model of spontaneous retinal activity presented by Feller et al. (1997) has the following components. The retinal ganglion cell layer is modeled as a 96370 triangular, close-packed lattice of cells, and the amacrine cell layer as a triangular 48335 lattice of cells. Only cholin-ergic amacrine cells are considered in the amacrine cell layer because spontaneous wave propagation depends on cholinergic transmission (Feller et al., 1996). This represents a patch of retina of dimensions 1.4 mm31.2 mm (Feller et al., 1997). Both classes of neuron are modeled as leaky, integrate-and-fire spiking neurons with an integration timetint
of 100 msec, and they receive input of fixed, unit efficacy from only amacrine cells within a distance of 120mm (which corresponds to a distance of approximately 3.5 amacrine cell spacings). The change in activation levelX of each type of cell over the basic time step of the modelDt5100 msec is given by:
XnewC 5XoldC e2Dt/tint1NA, (1)
whereC[{A,G} for amacrine (A) or ganglion (G) cells, andNAis the
number of active amacrine cells within the cell’s input radius. If a ganglion cell’s activation level reaches the thresholduG510 units, it fires
for one time step and then its activation level is set to zero. The threshold for amacrine cell firing isuA56 units. After firing for 10 time steps (1
sec), its activation level is also set to zero. However, the amacrine cell is then refractory and unable to fire for a period of time. This amacrine cell refractory period is introduced to account for the facts that retinal waves have boundaries, finite regions of propagation, and to some degree are determined by refractory regions of tissue. The refractory period of each amacrine cell is drawn from a normal distribution with mean 120 sec, SD 38 sec. In addition to being capable of being driven to threshold by excitatory input from neighboring amacrine cells, each amacrine cell can spontaneously fire, with a probabilitypspont50.035 sec21. Cell firing is
considered, for simplicity, as a state in which the cell’s output is unity; when not firing, its output is zero. Such a model can be shown to generate patterns of activity on the retinal ganglion cell layer that are phenome-nologically accurate in several respects, including accounting for the distribution of sizes of active domains and the distribution of interwave intervals (Feller et al., 1997). The model is, however, very sensitive to the values of some of its parameters, particularlypspontanduA. The values of
these parameters, given above, are selected so that the model’s output reproduces the experimental data. Whether or not the model’s postu-lated mechanisms of wave generation are correct, its phenomenologically realistic output on the simulated retinal ganglion cell layer is all that concerns us here.
Were we to permit all 9637056720 ganglion cells to arborize over all cells in a simulated LGN sheet of the same size, our simulation would contain ;45 million variables representing the number of synapses between each ganglion cell and each LGN cell. Each variable would need updating at each simulated time stepDt5100 msec for millions of time steps. Such numbers are intractably large given current computational resources. Restricting the extent of arborization would defeat the pur-pose of determining whether realistic waves can drive topographic re-finement. Thus, because 96370'80380, we change dimensions to an 80380 array and simply discard every other ganglion cell in all rows and columns to leave a triangular 40340 array of cells, each cell being in register with an amacrine cell. This does not affect, for example, the distribution of domain sizes (except to scale the waves by a factor of 2) or the distribution of interwaves intervals. For a one-retina, one-LGN sheet system, this still leaves us with 40452.56 3106variables. We
their simulated patch of retina by reducing, for example, the amacrine cell input radius would then require us to demonstrate that the resulting parameter region still faithfully reproduces the experimental data. Be-cause our focus here is not on constructing models of realistic sponta-neous waves but rather on determining whether such waves can drive normal development, we opt for the simpler, averaging strategy.
A significant problem that we find with the model of Feller et al. (1997) is that there tend to exist “hot spots” on the simulated retina that initiate spontaneous wave propagation more frequently than average, and corre-sponding “cold spots” that initiate wave propagation less frequently than average. Such regions become topographically overrepresented or under-represented in our simulations. The experimental data, however, indicate that wave initiation sites are consistent with a random, uniform distribu-tion (Feller et al., 1997). Thus, some way must be found of overcoming this lack of uniformity in the model. To this end, after a fixed number of simulated time steps, we re-randomize the refractory periods of ama-crine cells. This is repeated each time the fixed number of time steps elapses. We find that this measure ensures an approximately uniform distribution of wave initiation sites without, again, altering in any other way the dynamics of the waves.
Because full simulations of retinal waves would often contain “dead time” during which no waves propagate, and thus the simulations would not progress, we instead construct waves “off line” and store them in data files, discarding any periods of inactivity. These data files are then used to reconstruct retinal wave activity patterns, which are “played back” to full simulations. Although this eliminates periods of inactivity within each simulated retina and thus speeds up simulation, it increases intero-cular correlations in simulations with two retinas. The effect of this in our model of plasticity is possibly to increase the degree of binocularity at the boundaries of ODCs and to decrease the spacing of ODCs (Elliott and Shadbolt, 1998b). However, despite its challenge to our simulations with a harder problem than natural development normally poses, we find that segregation of afferents and topographic refinement still occur. This demonstrates that, with reduced interocular correlations, normal devel-opment would proceed properly.
In generating the spontaneous retinal waves for two-eye simulations, we assume that the wave-generating mechanisms in each retina are independent of those in the other retina. Wave data files consist of 50,000 periods of activity played and replayed to simulations, with amacrine refractory period reinitialization occurring every 250 periods of activity. To avoid edge effects, periodic boundary conditions are imposed on the sim-ulated retinas, so that opposite edges of the retinal sheets are identified.
To simulate visually evoked activity patterns, we follow the method used by Goodhill (1993). First, each ganglion cell in the left retina is randomly assigned to be active (unit activity) or inactive (zero activity). Then, for each ganglion cell in the left retina with activity a, the visuotopically equivalent cell in the right retina is assigned the same activityawith probabilityp; otherwise it is assigned the opposite activity 12a. This permits the introduction of well defined interocular correla-tions. These binary activity patterns are then separately convolved with a suitably normalized Gaussian, with parametersr. This smears out the
binary activity patterns and introduces well defined intraocular correla-tions (Goodhill, 1993). Such a model attempts to capture the intraocular and interocular correlations that are likely to exist in visually evoked activity. We will always takesr50.75. The dependence of, for example,
ODC width on this parameter is discussed in Elliott and Shadbolt (1998b). We simulate the LGN as two sheets of cells that initially receive innervation from both eyes. For computational tractability, each sheet is taken as a triangular, close-packed array of cells of the same dimensions as each retina, and periodic boundary conditions are imposed. Because the number of cells in the LGN is of the same order as the number of ganglion cells in the retina, this is not a bad approximation (cf. Sander-son, 1971). To set up the initial pattern of connectivity between each retina and each LGN sheet, we again follow the method used by Goodhill (1993). Let the maximum distance (in units of cell spacings) between any two cells in an LGN sheet be denoted bydmax. Given a perfect one-to-one mapping, each retinal ganglion cell would project to a unique LGN cell in each sheet, the LGN cell that would be in register with the ganglion cell were the appropriate LGN sheet superimposed on the ganglion sheet. Letddenote the distance between this LGN cell and some other LGN cell in the same sheet. Then, initially, the number of synapses projected from the retinal ganglion cell to an LGN cell is taken to be proportional tob(12d/dmax)1(12b)n, wheren[[0, 1] is a randomly selected number for each LGN cell. The parameterb[[0, 1] determines the initial topographic bias in the projections (Goodhill,
1993). Forb50 there is no bias at all, whereas forb51 the bias is greatest. Following Goodhill (1993), we takeb50.5, which provides a small, initial bias for the topographic mapping. This can be imagined to be established, for example, by activity-independent mechanisms during target innervation. Small decreases in the value ofbdo not affect our results.
Cells in each simulated LGN sheet are initially binocularly innervated. However, experimentally, although the segregation of retinogeniculate afferents appears to be an activity-dependent, competitive process (Ra-kic, 1981; Sretavan and Shatz, 1986; Penn et al., 1998), the outcome of this process is always predictable: each LGN lamina will end up being innervated only by a particular, predictable eye. Several mechanisms can be imagined to account for this behavior. Perhaps the simplest, and the one that we shall use in simulation, is that an initial contralateral-eye bias in some laminae and an ipsilateral-eye bias in the others would tilt the competition in favor of the dominating set of inputs. Such biases again could be imagined to be initially established by activity-independent mechanisms during target innervation. Thus, to achieve such a bias in simulation, in the presumptive left eye-controlled LGN sheet, we multi-ply the initial number of synapses from the left eye, set up as described above, by a factor 11g, and the initial number of synapses from the right eye by a factor 12g. This is reversed for the presumptive right eye-controlled LGN sheet. In simulations presented below, we always takeg5
0.5, although, in fact,gcan be taken surprisingly close to zero (g;0.1) without the predictable nature of the segregation breaking down.
Because we are interested in more general developmental issues, we use a very simple model of LGN neurons. If the input ganglion cells of a particular LGN cell are indexed by the labeliand have activityai[[0, 1], and if the number of synapses the LGN cell receives from those cells is
si, then, in each time step,Dt, we take the instantaneous firing rate of the LGN cell to be ((isiai)/((isi). The numerator is standard in simple models of neural networks. This is then divided by the total number of synapses for two reasons. First, we want to keep the instantaneous firing rate bounded in the interval [0, 1], the same interval used for ganglion cells. Second, because we simulate a developing system, the number of syn-apses can change. It would be expected, for example, that a neuron would adjust its firing threshold in a manner that depends on the number of its inputs (cf. Bienenstock et al., 1982). The form that we use is the simplest, parameter-free form that satisfies these requirements. Other forms are possible, such as a logistic function of the numerator, but this would introduce additional parameters. Furthermore, the form that we use permits a thorough mathematical analysis of our neurotrophic model of plasticity (see below). Here, for simplicity, we do not model any explicit lateral interactions between LGN cells, although we will discuss this possibility in Results.
Our model of the geniculocortical pathway is similar to that of the retinogeniculate pathway. The striate cortex contains one or two orders of magnitude more cells than the LGN (cf. Beaulieu and Colonnier, 1983). It would be computationally intractable to model such large numbers. We therefore simulate a patch of layer IV of the cortex that is the same size as the retinal and LGN sheets, that is, a 20320 triangular, periodic, close-packed array of cells. The projections from each LGN sheet to the cortical sheet are established in an identical manner to the projections from each retina to the LGN sheets. We use the same bias indexb50.5. However, in contrast to the retinogeniculate projection, we do not permit an ipsilateral or contralateral bias in the geniculocortical projection, so that each cortical cell is initially almost exactly binocularly driven. This is likely to be a reasonable model for monkeys, although the possible importance of a contralateral bias in cats has recently been discussed (Crair et al., 1998). The mechanisms that allow the ipsilateral projection to the striate cortex in cats to develop and gain ground in territory initially heavily dominated by the contralateral eye are likely to be non-Hebbian and perhaps not activity dependent (Crair et al., 1998). In the absence of further experimental characterization of these mech-anisms, and because we are concerned here with the activity-dependent component of development, we use a generic, bias-free geniculocortical projection in our simulations. This means that we restrict our study to the development of the primate geniculocortical pathway. The model of cortical activity that we use is identical to the model of LGN activity; again, no explicit lateral interactions on the cortex are modeled, although we discuss this possibility in Results.
excites the cells in the LGN sheets. The two LGN sheets innervate a patch of striate cortex, which is similarly excited by LGN activity. All of these sheets are 20320, so our full simulations consist of 632045
960,000 variables representing the numbers of synapses from afferent cells to target cells. All synapses are purely feed forward, and cortical activity has no impact on LGN activity via feedback synapses to the thalamus in our simulations. To produce decent receptive field refine-ment, good topographic refinerefine-ment, and the complete segregation of retinogeniculate and geniculocortical afferents, our simulations run for of order 106time steps ofDt5100 msec. This represents a little more than
1 d of simulated development, but each simulation runs on our computers (DEC Alphas) for;1 month. Thus, reducing the rate at which the system develops, so that simulated development takes of order a simulated month, would be intractable. We also run simpler simulations of a projection from one retinal sheet to one LGN sheet. Most of these are on 20320 sheets and run comparatively quickly (a few days), but we discuss one simulation on 40340 sheets that is much slower.
In modeling the continuous development of the full retinogeniculo-cortical pathway as a one-stage process, we could be accused of disre-garding the basic developmental data. For example, in the cat, retino-geniculate segregation is well underway even before geniculocortical afferents invade the cortical plate (Shatz, 1983; Shatz and Sretavan, 1986; Allendoerffer and Shatz, 1994). In fact, we find in our simulations that the geniculocortical pathway does not begin changing significantly until the retinogeniculate pathway has nearly completed its development, that is, until retinogeniculate afferents are well segregated and topographic refinement is largely over. Thus, although our model is simplified for reasons of computational convenience in some respects, its behavior is faithful to the developmental data in that the model breaks up develop-ment into an essentially two-stage process.
The neurotrophic model of plasticity.To permit anatomical remodeling, we use our previously used model of synaptic plasticity based on com-petition for neurotrophic support. This model is well characterized mathematically (Elliott and Shadbolt, 1998a) and has been successfully applied to the development of ODCs, in which system a number of predictions were made (Elliott and Shadbolt, 1998b). We use the same neurotrophic model for both retinogeniculate and geniculocortical syn-apses. This thus commits us to the view that neurotrophic interactions play an important role in the activity-dependent development of the retinogeniculate as well as the geniculocortical pathway, but not, of course, to the view that precisely the same class of neurotrophic mole-cules is important in both systems. Nevertheless, for notational and computational convenience, we shall discuss the model as if only one neurotrophic molecule is involved.
We consider a generic sheet or set of sheets of afferent cells (either the retinas or the LGN sheets) and a generic sheet of target cells (either an LGN sheet or the cortical sheet). Let afferent cells be indexed by letters such asiandjand target cells be labeled by letters such asxandy. The number of synapses between afferentiand targetxis denoted bysxi(t); for notational convenience, we will not indicate the time dependence explicitly. Let the activity of afferent cellibe denoted byai[[0, 1]. The basic equation for our model of neurotrophic interactions is then given by:
dsxi
dt 5esxi
F
O
y DxyS
T01T1O
jsy jajO
jsy jD
~a1ai!ri
O
jsxj~a1aj!rj21
G
, (2)where the number of NTF receptors ri expressed on each afferent
terminal is given by:
ri5a#i/
O
xsxi, (3)
witha#iin the expression forridenoting the recent time average of the
activity of afferenti, assumed to be given by:
a#i~t!5
1
t
E
2`t
dt9ai~t9!e2~t2t9!/t. (4)
The parametere determines the overall rate at which the number of synapses changes and is related totthroughe51/t. For full retino-geniculocortical simulations using spontaneous retinal activity, we use the valuee55.031024, although for simulations using visually evoked
activity we use, for computational convenience, the valuee50.02, for
reasons explained in Results. For simulations of a one-retina, one-LGN sheet system, we can takeeto be a little smaller than the smallest value in full simulations; we take it to bee51024. These smaller values ofe
correspond to values oftrepresenting time scales of a few minutes of simulated time. The parameters T0 and T1 represent activity-independent and the maximum activity-dependent levels, respectively, of release of NTFs from target cells (Blo¨chl and Thoenen, 1995, 1996; Griesbeck et al., 1995; Goodman et al., 1996). Uptake by afferents of NTFs depends on a resting, constitutive uptake parameter,a, and also on the level of activity of the afferent. This latter assumption, that the uptake of NTFs by afferents contains an activity-dependent component, is a specific postulate of our model, and it is a critical feature in allowing for competitive interactions between afferents. The functionDxypermits
NTF diffusion through the target field and depends only on the separa-tion between target cellsxandy. We assume it to be a simple, suitably normalized Gaussian function with parameterst. We takest50.75; the
dependence of, for example, ODC width on this parameter is discussed in Elliott and Shadbolt (1998b).
We have discussed extensively the derivation, justification, analysis, and predictions of this model in previous publications (Elliott and Shad-bolt, 1998a,b). We therefore only briefly describe the critical assumptions underlying the model here.
The first assumption is that the production and release of NTFs from target cells depends on neuronal activity. If the activity-dependent com-ponent is removed from the model, then the model ceases to be capable of inducing competition between afferents and thus cannot induce their segregation. The production and release of many NTFs in the cortex and hippocampus is regulated by activity (Zafra et al., 1991; Castren et al., 1992; Gwag and Springer, 1993; Lindholm et al., 1994; Blo¨chl and Thoenen, 1995, 1996; Bozzi et al., 1995; Griesbeck et al., 1995; Schoups et al., 1995; Goodman et al., 1996), so this assumption seems quite reasonable. The released NTFs are assumed to diffuse rapidly through the target field, with diffusion characterized by the functionDxy. For the
parameters given above, the assumed diffusion is not extensive, amount-ing only to significant diffusion to nearest-neighbor target cells (i.e., only six cells in our simulations). Although not critical for inducing competi-tion, the diffusion of NTFs in our model is critical for inducing ODCs of finite, non-zero width. Without diffusion, each target cell would become dominated by one eye or the other, but there would be no ordering into columns or patches of nearby cortical cells dominated by the same eye. A second critical assumption is that the uptake of NTFs by afferents depends on their activities. Without this assumption, our model does not lead to competition. Presently no data bear directly on this assumption. It is therefore a central prediction of our model that NTF uptake depends on afferent activity, with more active afferents being able to take up greater levels of NTFs than less active afferents. If this prediction is wrong, then our model is wrong. Our model also requires that there is an activity-independent component to afferent NTF uptake, governed by the parametera.
and that the larger the total number of synapses supported by an afferent, the fewer the number of receptors per synapse.
Together, these various assumptions lead to the mathematical form of the model exhibited in Equation 2, as described in detail elsewhere (Elliott and Shadbolt, 1998a,b). This neurotrophic model is very different in character from the previous, much simpler neurotrophic models that we have built (Elliott et al., 1996). For example, although an earlier model (Elliott et al., 1996) was formulated in energy-minimization terms (inter-preted as NTF maximization), it can be shown that the differential equa-tions in Equation 2 cannot be derived by assuming (gradient descent) minimization of some energy function (our unpublished observations). Thus, mathematically, the present model is very different from energy-minimization models, either our own earlier model of anatomical plasticity based on competition for neurotrophic support (Elliott et al., 1996) or other forms of models, such as models of physiological plasticity in which com-petition is imposed using synaptic normalization (Miller et al., 1989).
In addition to these mathematical differences, our present model is also different, in terms of biology, from other types of models (Miller et al., 1989). For example, our model seeks to shed light on the mechanisms of synaptic competition, a ubiquitous phenomenon in the developing vertebrate nervous system (Purves, 1988). This is reflected, for example, in our postulate concerning the possible activity dependence of NTF update by afferents. In contrast, many other models (Miller et al., 1989; Goodhill, 1993) enforce competition by imposing synaptic normalization. They can therefore shed no light on the mechanisms of competition because they merely assume it rather than show how it can emerge from underlying processes. Although some evidence hints at the possibility that certain types of synaptic normalization, in fact, do operate in the normal, developing cortex (Turrigiano et al., 1998), the form is not that required by models of the development of the visual system (Elliott and Shadbolt, 1998b). Finally, our model makes biological predictions or replicates experimental results that some other models do not. For example, simple correlation-based models of physiological synaptic plas-ticity (Miller et al., 1989) do not exhibit any change in ODC width in response to changes in either intraocular or interocular image correla-tions, unlike the present model or, for example, Goodhill’s model [(Goodhill, 1993) whether Goodhill’s model exhibits shifts in ODC width in response to changes in intraocular image correlations is unclear, because Goodhill did not consider this possibility]. Thus, both mathe-matically and biologically, our present model is different from previous models (Miller et al., 1989; Goodhill, 1993; Elliott et al., 1996).
It can be shown that a critical quantity in our model of anatomical plasticity is the ratioT0/(aT1) (Elliott and Shadbolt, 1998a,b). When this is less than 1, afferent segregation (which could be topographic and receptive field refinement or eye-specific afferent segregation) always occurs, even for very highly (although not perfectly) correlated afferent activity. However, when this quantity exceeds unity, afferent segregation never occurs.T0represents the amount of NTF released from target cells in an activity-independent manner, or, alternatively, the amount of exogenous NTF infused into the target system. Thus, whenT0exceeds a critical threshold, afferent competition breaks down, consistent with the experimental result that the infusion of excess quantities of NTFs eliminates or tempers competitive interactions (Carmignoto et al., 1993; Cabelli et al., 1995; Riddle et al., 1995).
The quantityT1, representing the maximum activity-dependent re-lease of NTFs from target cells, essentially sets the scale for the number of synapses from afferent cells to target cells. We shall always take it to be T15 20 without loss of generality. The value of the quantity a, representing the capacity for resting uptake of NTFs by afferents, is required to be neither too large (a..1) nor too small (a,,1) (Elliott and Shadbolt, 1998a). We therefore always take it to bea51. The value ofT0will always beT050, unless indicated otherwise. That is, we shall assume for most simulations that there is no exogenous infusion of NTFs into target sheets. These values apply to both retinogeniculate and geniculocortical synapses.
The representation of topography.To display the representation of a sheet of afferent cells on a sheet of target cells, we use two similar measures. In the first measure, which we denote byMCoM, we determine
the “center of mass” in space of the input to a target cell from all its afferent cells, where this is always calculated relative to perfect projec-tions. Thus, for target cellx, this measure is defined as:
MWxCoM5
O
ipWxisxiO
isxi, (5)
wherepWxiis the spatial position of afferentirelative to the spatial position
of the afferent that would uniquely project to target cellxwere topog-raphy perfect. When two afferent sheets are considered, the sums can be extended over both so that an “average” afferent point is obtained. When a sheet projects no synapses to a target cell, then the measure is left undefined at that cell. To visualize this center of mass measure, the positions defined by these vectors are plotted in space and connected according to the neighborhood relations on the target sheet. This mea-sure is used, for example, by Goodhill (1993). Intuitively, this center of mass projection simply determines which afferent cell a target cell best represents by determining where, on the afferent sheet, the average synaptic input (in terms of numbers of synapses, not neuronal activity) comes from.
However, this first measure can be quite misleading. When periodic boundary conditions are used, for example, every target cell that is initially innervated according to the method described above at first has a roughly symmetrical input in afferent space, and the randomness implicit in the initial projections is averaged out by Equation 5. Thus, initially, this measure gives the impression that topography is nearly perfect, despite highly unrefined receptive fields and large scatter. If periodic boundary conditions are not used, so that edge effects are significant and initial projections are for the most part highly unsymmet-rical, then the measure gives the impression of a badly disrupted topog-raphy that slowly “unfolds” as development proceeds (Goodhill, 1993). However, this unfolding is equally misleading, because it is principally an artifact. To overcome these difficulties, we use a second measure.
Instead of considering only the average, center of mass projection, we also consider the maximum projection. That is, a cell on the target sheet is defined as best representing the cell on the afferent sheet that sends the maximum number of synapses to it, rather than the cell that is closest to where the center of mass of projected synapses lies (when multiple such cells exist, we average over the locations, although this situation does not arise in our simulations). The visualization of this measure is performed in the same manner as the for center of mass measure.
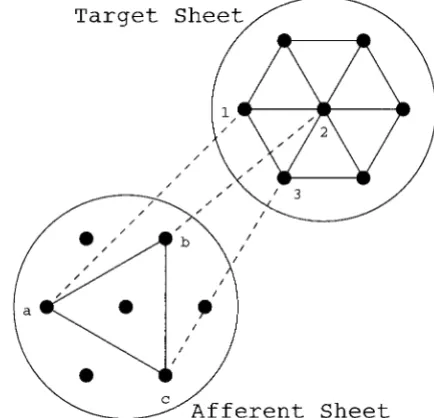
[image:5.605.326.543.62.271.2]Figure 1 illustrates schematically the visualization of topography for a small system of seven afferent cells innervating seven target cells. For each cell on the target sheet, we determine which afferent cell it best represents, using either measure described above. Thus, although target cell 1 might receive input from all afferent cells, it might best represent
Figure 1. A schematic illustration of the visualization of topography in a small system containing seven afferent and seven target cells. The con-nections between cells in the target sheet denote nearest neighbor rela-tions. For each target cell, the afferent cell that it best represents is
determined. Thus target cells1, 2, and3best represent afferent cellsa,b,
andc, respectively. Because target cells1and2are neighbors, the afferent
cellsaandbthat they best represent are connected with aline, similarly
afferent cell a, and similarly for target cells 2 and 3. Because target cells 1 and 2 are neighbors, a line is drawn to connect the two afferent cells, a and b, that these target cells best represent, and similarly for every pair of nearest target neighbors and the afferents that they best represent. When topography is perfect, the neighborhood relations on the target sheet will map without distortion onto the connections constructed as described on the afferent sheet. Hence, in this case, the hexagonal nearest neighbor pattern illustrated on the target sheet will be perfectly reproduced on the afferent sheet. When topography is not perfect, the connections constructed on the afferent sheet will be distorted. The extent of distortion will indicate how badly afferent topography is rep-resented on the target sheet.
After sufficient topographic refinement, both measures of topography should converge to approximately the same result, although they differ significantly at the outset. Neither measure, however, gives much in-formation about the extent of receptive field refinement, so, in addition to showing representations of topography, we will also show typical examples of the development of some target cells’ receptive fields.
RESULTS
We now present results of simulations of our model. First we present results for the simple, one-eye, one-LGN sheet simula-tions. Then we present results for the full retinogeniculocortical simulations.
One-eye, one-LGN sheet simulations
We first present simulations run on one-eye, one-LGN sheet systems. The primary purpose of this is to establish whether the model of spontaneous retinal waves presented by Feller et al. (1997) is capable of inducing topographic and receptive field refinement.
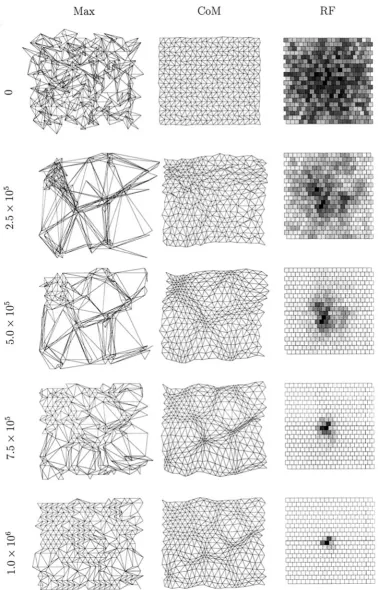
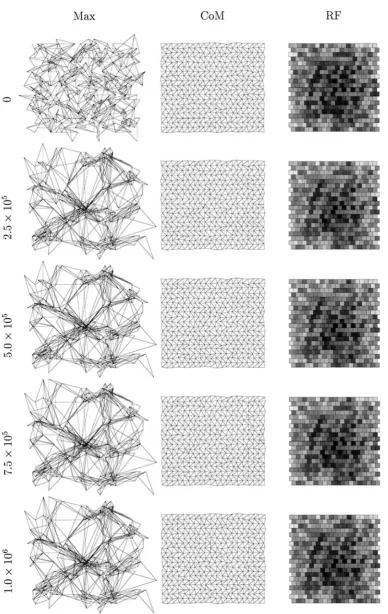
In Figure 2, we show the state of one simulation at various time steps with the retinal wave model in which regular re-randomization of amacrine cell refractory periods is not per-formed. Except for averaging to reduce the size of the system and the use of periodic boundary conditions to avoid edge effects, this model is identical to that presented by Feller et al. (1997). Initially, the center of mass measure of topography is almost perfect, for reasons explained in Materials and Methods. How-ever, the maximum measure shows significantly disrupted topog-raphy, and the sample receptive field shows little bias. As devel-opment proceeds, the maximum topography measure becomes increasingly disrupted, whereas the center of mass measure changes slowly while retaining its orderliness.
The initial collapse of the maximum measure at a few retinal positions occurs for two reasons. First, a well known feature of neural network simulations is their undesirable capacity for over-generalization. During the very early stages of simulated devel-opment, the system experiences only a small subset of the ensem-ble of afferent activity patterns that it will eventually experience. The system therefore tends to collapse around this early subset. This behavior is a function of the parametere, with larger values making the behavior even more extreme. This is why we use a small value,e51024. Although an even smaller value would be desirable for a number of reasons, this would make the simula-tions intractably slow. Second, when amacrine cell refractory periods are not re-randomized regularly, hot and cold spots of activity exist on the simulated retina. These further accentuate the problem of overgeneralization, because the data are not uniformly distributed.
The existence of the retinal activity hot and cold spots is revealed as the simulation progresses. The maximum measure of topography slowly unfolds after its initial disruption as receptive field refinement occurs, and this measure gradually converges on the center of mass measure. However, both measures reveal
overrepresented regions of the retina (regions of dense packing of points) where LGN cell receptive fields change slowly, and un-derrepresented regions of retina (regions of loose packing of points) where LGN cell receptive fields change rapidly. Never-theless, despite these disruptions, topography and receptive fields are finally such that the retinal sheet is represented fairly contin-uously without large jumps on the LGN sheet.
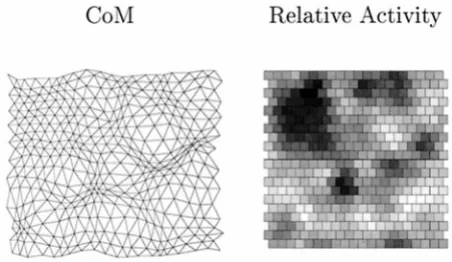
The connection between the distortions of the final topography measures in Figure 2 and retinal activity hot and cold spots is revealed in Figure 3. Regions of overrepresentation correspond exactly to the most active patches of retina, whereas regions of underrepresentation correspond exactly to the least active patches. For the retinal wave data used to generate Figure 2, there is no indication that the distribution of wave initiation sites becomes more uniform as time progresses up to the maximum number of time steps used: 50,000. Indeed, by dividing this interval into five consecutive intervals of 10,000 time steps and determining in each the mean and SD of the ganglion cell activity rate, in addition to the minimum and maximum values per inter-val, all of these quantities simply scale linearly with time. Thus, the failure of the neurotrophic model of plasticity to eliminate the remaining topographic distortions does not invalidate the model but rather shows that the model of spontaneous retinal activity does not generate retinal waves that are phenomenologically realistic in all respects (Feller et al., 1997). Thus, to make the distribution of retinal wave initiation points more uniform, we find that the simplest method is regularly to re-randomize the amacrine refractory periods. Whether or not this is biophysically realistic, we are only concerned here with using phenomenolog-ically realistic patterns of spontaneous retinal activity in our simulations.
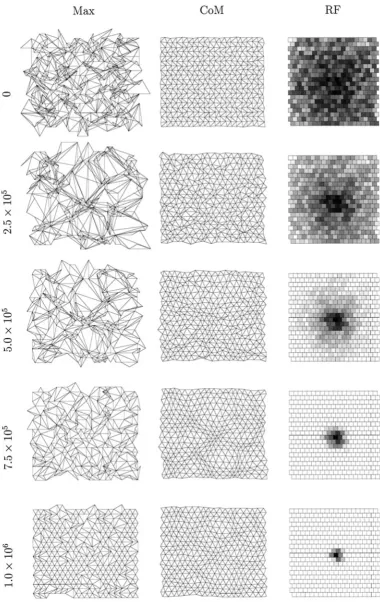
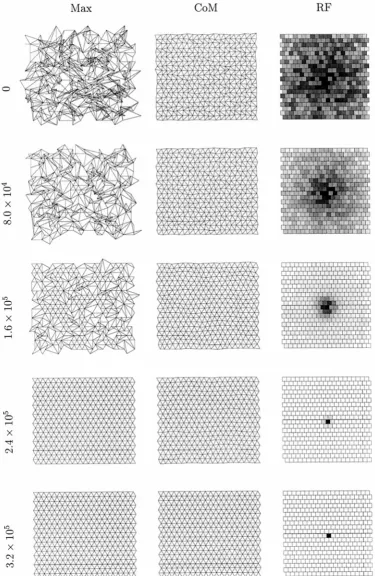
Figure 4 shows a simulation in which amacrine cell refractory period reinitialization does occur regularly. We see, again, a slight tendency for the maximum measure of topography to collapse, but the tendency is not nearly so dramatic as in Figure 2, in which refractory period reinitialization does not occur. Both measures of topography develop and converge quite closely. After 1.253106time steps, both measures of topography are nearly identical and almost perfect (data not shown). This result rules out the possibility that the behavior exhibited in Figure 2 is largely caused by playing and replaying only a finite set (50,000) of preconstructed episodes of retinal wave activity to the simula-tion, because, were this so, we would expect to observe similar behavior in the simulation presented in Figure 4. In this figure, we observe a near-uniform representation of the retinal sheet on the LGN sheet, with only faint hints of differences in the extent of representation of different regions of retina. Further simulations described below that use spontaneous retinal waves will always be with amacrine refractory reinitialization.
To determine whether the averaging procedure used to reduce 40340 arrays of cells to 20320 arrays has any impact either on the capacity of our neurotrophic model of plasticity to permit topographic refinement or on the capacity of the simulated retinal waves to drive such refinement, we examined one simulation in which such averaging was not performed. As expected, topo-graphic and receptive field refinement proceeded normally, as in the smaller simulations, but naturally this larger simulation took much longer to run to completion (data not shown).
Figure 2. An example of a one-eye, one-LGN sheet simulation using spontaneous retinal waves. In this simulation, regular re-randomization of amacrine cell refractory periods is not performed.Lefttoright, in the first column, the maximum projection measure (Max) for topography is shown; in thesecond column, the center of mass measure is shown; in thethird column, the receptive field (RF) of the LGN cell at position (11,11) (near the center of the sheet) is shown. Each row represents the state of the system after a given number of time steps, the first being 0 time steps, the second 2.53
105, the third 5.03105, the fourth 7.53105, and the last 1.03106. The visualization of topography is described in Materials and Methods and Figure
this simulation has eliminated the competitive mechanisms that result in the refinement of connections.
To establish whether the capacity of our neurotrophic model of synaptic plasticity to permit the development of refined topogra-phy and receptive fields depends on the use of a particular form of retinal activity, we now consider a simulation in which we use visually evoked activity. We may safely takee50.02 to speed up simulations. Such a simulation is shown in Figure 6. Despite the increase in the value ofe, we find that a comparable number of time steps is required for simulated development to occur as are needed when retinal waves are used. This demonstrates that the use of distributed retinal activity patterns makes the task of topographic and receptive field refinement much harder. One noticeable difference between this simulation and the simulation using retinal waves shown in Figure 4 is that there is no further disruption of the initially bad topography attributable to overgen-eralization. This is because the model uses distributed and not local patterns of retinal activity, so that all retinal points are approximately equally active from the outset.
The above simulations did not use any lateral interactions on the LGN sheet, except for those that relate to the diffusion of NTFs on the target sheet. The major difference between simula-tions using explicit lateral connecsimula-tions and those that do not is the rate at which the systems develop. Lateral interactions tend to increase the rate at which receptive field and topographic refine-ment occur (data not shown). This increase in not so marked in the case of spontaneous retinal activity, because the activity patterns are already narrowly focused and do not give rise to significantly distributed patterns of activity on the LGN sheet. However, in the case of visually evoked activity, the presence of explicit lateral interactions dramatically increases the rate of development (cf. Goodhill, 1993).
Full retinogeniculocortical simulations
We now turn to full retinogeniculocortical simulations. In addi-tion to attempting to establish whether spontaneous retinal waves can drive topographic and receptive field refinement, we are now
interested in whether such waves, in simulation, can drive the segregation of retinogeniculate and geniculocortical afferents.
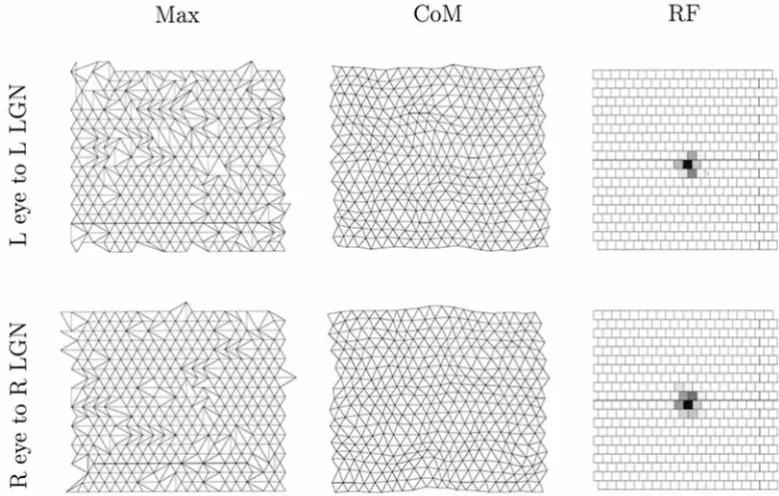
In Figure 7, we show the state of the retinogeniculate pathway after 2.53105time steps. At this stage, the afferents have already segregated cleanly into eye-specific layers in the LGN (data not shown), so that the presumptive left eye-controlled LGN sheet is entirely controlled by the left eye and the presumptive right eye-controlled LGN sheet is entirely controlled by the right eye. Both measures of topography reveal an ordered, smooth mapping of each retina onto its appropriate LGN sheet, and receptive fields are well refined. As the simulation progresses further, both measures of topography continue to converge to an almost per-fect state.
To obtain predictable but competitive segregation of retinal afferents into eye-specific layers in the LGN, we have, as de-scribed in Materials and Methods, used an ipsilateral projection bias in one lamina and a contralateral projection bias in the other. The extent of the bias is determined by the value of the parameter g. In the simulation in Figure 7 we have used a large value,g5
0.5, so that, for example, left eye inputs project ;75% of all synapses to the presumptive left eye-controlled LGN. We have used such a large value for reasons of computational convenience only, so that the rate of segregation of afferents in the LGN is speeded up. In fact, even a bias value as low asg50.1 (giving
;55% control to the dominant input) still leads to predictable segregation (data not shown). Nevertheless, for g5 0, so that there is no bias, segregation ceases to be predictable, and each eye can end up controlling distinct regions of the same LGN lamina, producing LGN equivalents of ocular dominance “patches” (data not shown). Thus, a prediction of this approach is that for the segregation of afferents in the LGN to be predictable, a (perhaps small) bias in the initial projections must exist. Other, alternative possibilities might exist, however. For example, cell surface cues might be such that the projections to a lamina from the eye that are destined to retract are less stable than those that are destined to remain, or the avidity of uptake of NTFs by the afferent terminals that will remain is greater than the avidity of uptake by those that will retract. Nevertheless, for the outcome of a com-petitive process to be completely predictable, as is the case in the LGN, it seems necessary that some intrinsic difference between the ipsilateral and contralateral projections must exist.
Recent experimental data indicate that the blockade of spon-taneous retinal activity in one eye leads to an expansion of the LGN territory controlled by the active eye and a reduction in the territory controlled by the inactive eye (Penn et al., 1998). By eliminating activity in one eye in our simulations, we find that the active eye develops more synapses and retains synapses in the lamina that would otherwise have been controlled by the other eye, whereas the inactive eye retracts synapses not only from the “inappropriate” LGN lamina but also from the lamina that it would otherwise have controlled (data not shown). Thus, despite tilting competition in favor of the initially dominating input attributable to differences in the ipsilateral and contralateral projections, the competition can still be significantly influenced by other factors, such as relative levels of electrical activity in the two projections.
[image:8.605.54.280.58.189.2]At the same point in simulated development as shown in Figure 7 for the retinogeniculate pathway, the geniculocortical pathway remains disordered and has progressed little (data not shown). Thus, although we do not explicitly model the two-stage process of retinogeniculate and geniculocortical development, our simu-lations essentially break development up into two phases. This Figure 3. The connection between disrupted topography and retinal
activity hot spots. Theleft mapis the bottom center of mass topography measure in Figure 2. Next to it is agray scalerepresentation of relative activities of retinal ganglion cells in the simulation. The least active cells are shown aswhite, whereas the most active cells are shown asblack;
occurs because geniculocortical development cannot progress sig-nificantly until LGN cell receptive fields have been refined. After 5.03 105time steps, the geniculocortical pathway in the same simulation has achieved quite sharply focused receptive fields and
[image:11.605.115.491.62.639.2]well ordered topographic refinement. However, although signifi-cant fluctuations in ocular dominance are beginning to emerge, no cortical cell is entirely dominated by input from only one eye (data not shown).
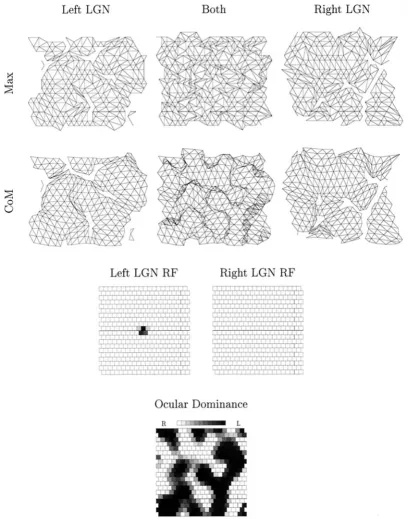
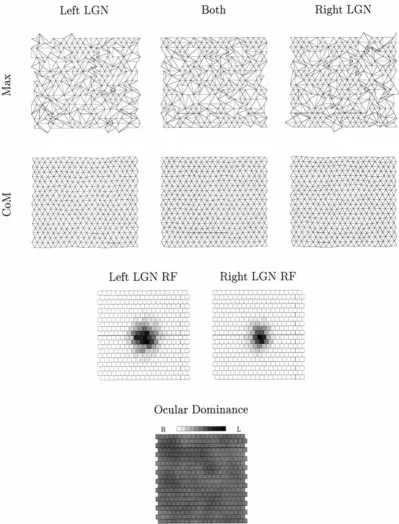
After further 2.5 3 105 time steps, shown in Figure 8, the segregation of geniculocortical afferents into ODCs is nearly complete. Both measures of topography have largely stabilized and converged, with holes representing regions of no control by a particular eye. Comparing the CoM measure of topography for both LGN sheets (middle map, second row) with the map of ocular dominance, we see very ordered topography within ODCs and a “doubling back” across boundaries, consistent with the experimental data (Hubel and Wiesel, 1977). This is also a feature of the Max measure (middle map, top row), although it is a little harder to observe in this case.
The single retinogeniculocortical simulation using spontaneous retinal waves presented here is representative. We always observe that retinogeniculate development precedes geniculocortical de-velopment, and that cortical ODCs largely emerge after cortical topography and cortical cell receptive fields become refined. Simulating the infusion of excess quantities of NTFs into the LGN by increasing the value of T0 prevents topographic and receptive field refinement, in a manner identical to that shown for one-eye, one-LGN simulations (Fig. 5). Furthermore, the segre-gation of retinogeniculate afferents into eye-specific laminae does not occur under this regime, and, in addition, the geniculocortical pathway fails to develop properly, despite a simulated infusion localized to the LGN (data not shown). Simulating the infusion of excess quantities of NTFs into the cortex at a sufficiently early, prenatal stage would prevent both the formation of ODCs (cf. Elliott and Shadbolt, 1998b) and topographic and receptive field refinement, although the development of the retinogeniculate pathway would not be disrupted in this case.
Many factors interact to determine the width of the ODCs shown in Figure 8, and these have been explored numerically and partially analyzed mathematically elsewhere (Elliott and Shad-bolt, 1998b). One factor is the spatial NTF diffusion functionD.
[image:12.605.106.496.60.308.2]For the values of the parameters determining this function used here (stated in Materials and Methods), the diffusion of NTF, in both the LGN and the cortex, is significant only to a cell’s six nearest neighbors. Increasing the extent of diffusion increases the width of the ODCs. Another factor is the extent of intraocular activity correlations. Our previous work predicted for the first time that alterations in intraocular correlations alters the width of ODCs; specifically, increasing the correlations increases ODC width (Elliott and Shadbolt, 1998b). Here, the spatial extent of spontaneous retinal activity is therefore a critical variable in determining the resulting periodicity of ODCs, with larger do-mains resulting in wider ODCs. Thus, should it be possible to manipulate the size of spontaneous retinal activity domains by pharmacological means in an animal such as an Old World monkey, in which the development of the geniculocortical path-way occurs largely prenatally (Horton and Hocking, 1996a), then we would predict that the width of the resulting ODCs would change. The final factor that affects ODC width is the extent of interocular activity correlations. As first predicted in the biolog-ically relevant model of Goodhill (1993) and subsequently verified experimentally (Lo¨wel, 1994; Goodhill and Lo¨wel, 1995; Tieman and Tumosa, 1997), in our neurotrophic model, decreasing in-terocular correlations increases ODC width (Elliott and Shadbolt, 1998b). Thus, the size of interocular correlations between the spontaneous activity in both retinas also determines, in part, the width of ODCs. In the present simulations, however, for reasons of computational tractability, we have discarded periods of inac-tivity in each retina (see Materials and Methods). The effect of this will be to increase the interocular correlations beyond the level that would be expected to exist in the natural system, although it is likely that the correlations never become much stronger than uncorrelated. Our neurotrophic model can segre-gate afferents in the presence of even very strong interocular Figure 7. The state of the retinogeniculate pathway after 2.53105time steps in a full, retinogeniculocortical simulation using spontaneous retinal
correlations (Elliott and Shadbolt, 1998a,b), so even mildly cor-related interocular activity patterns do not present any difficulty for our model. Nevertheless, all other things being equal, were we to reinstate the inactive periods in simulation, we would expect a mild increase in the ODC width in Figure 8, together with a decrease in the binocularity of cortical cells at ODC boundaries.
[image:13.605.99.512.60.579.2]We now consider a simulation in which we use visually evoked activity rather than spontaneous retinal waves. As before, we take e50.02. We setp, the probability that visuotopically equivalent retinal ganglion cells are assigned the same activity, top50.5, so that the two retinal images are uncorrelated. The development of the system using the model of visually evoked activity patterns is Figure 8. The state of the geniculocortical pathway after 7.53105time steps for the same simulation shown in Figure 7. Thetop rowshows theMax
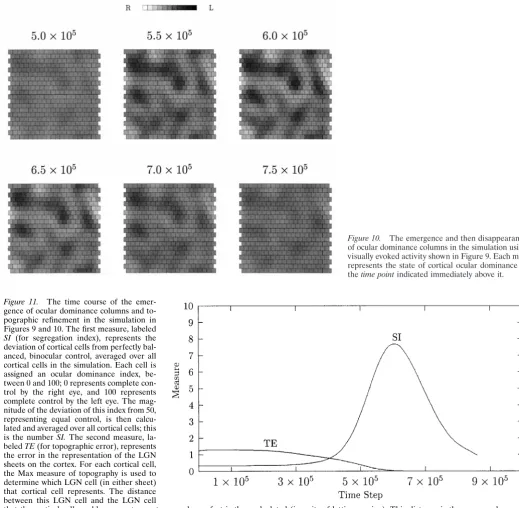
quite similar to that using spontaneous retinal waves. By 2.53105 iterations, perfect segregation of retinogeniculate afferents has occurred, and the topographic representation of an eye on its appropriate LGN sheet is almost perfect, as is receptive field refinement (data not shown). At 5.03105time steps, the genicu-locortical pathway is well on its way to successful topographic and receptive field refinement, although there is at this stage very little indication of the segregation of geniculocortical afferents into ODCs. This is shown in Figure 9. By 7.53105time steps, development is almost over. However, ODCs are largely not
present. In fact, following the time course of the segregation of ODCs more closely reveals that ODCs begin to form but then gradually disappear. This is illustrated in Figure 10.
[image:14.605.104.504.58.582.2]To establish why ODCs in this simulation are transient, we plot, in Figure 11, measures of the extent of geniculocortical afferent segregation and the extent of topographic refinement in the geniculocortical system against time. The average topographic error is non-zero when the segregation of afferents into ODCs begins. However, while this segregation is under way, the topo-graphic error reduces to very close to zero. This has the result Figure 9. The state of the geniculocortical pathway after 5.03105time steps in a simulation in which visually evoked activity rather than spontaneous
that topographically equivalent pairs of cells in the LGN sheets are competing only for one, topographically appropriate cortical cell. Because cell death does not occur at this stage of develop-ment, the competition cannot be resolved, so each pair of LGN cells can only end up balancing their control of the appropriate cortical cell. Hence, any disparity in innervation that accrued while the topographic error was non-zero is slowly removed as the LGN cells equalize their control.
This account of the washing away of ODCs in the simulation shown in Figures 9–11 suggests that reducing the interocular image correlations by reducing the value ofp, which increases the rate of segregation, should result in stable segregation. This is shown in Figure 12, in which we have taken p5 0.25. In this
simulation, ODCs emerge and stabilize before the topographic error has a chance to reduce to zero. Analysis of the widths of the ODCs in Figures 10 and 12 by two-dimensional Fourier methods reveals that the ODCs in Figure 12 are approximately 1.5 times wider than those in Figure 10 (data not shown). Thus, reduced interocular correlations increase ODC width, consistent with previous results (Goodhill, 1993; Elliott and Shadbolt, 1998b).
[image:15.605.38.557.57.565.2]The use of explicit lateral interactions in these full, retino-geniculocortical simulations differs in one major respect from simulations without them. In simulations using visually evoked activity, the presence of lateral interactions has the effect, as with the smaller, one-eye, one-LGN simulations, of increasing the overall rate of development. But in this case, the rate of the Figure 11. The time course of the
emer-gence of ocular dominance columns and to-pographic refinement in the simulation in Figures 9 and 10. The first measure, labeled
SI (for segregation index), represents the
deviation of cortical cells from perfectly bal-anced, binocular control, averaged over all cortical cells in the simulation. Each cell is assigned an ocular dominance index, be-tween 0 and 100; 0 represents complete con-trol by the right eye, and 100 represents complete control by the left eye. The mag-nitude of the deviation of this index from 50, representing equal control, is then calcu-lated and averaged over all cortical cells; this
is the numberSI.The second measure,
la-beledTE(for topographic error), represents
the error in the representation of the LGN sheets on the cortex. For each cortical cell, the Max measure of topography is used to determine which LGN cell (in either sheet) that cortical cell represents. The distance between this LGN cell and the LGN cell
that the cortical cell would represent were topography perfect is then calculated (in units of lattice spacing). This distance is then averaged over all
cortical cells to give a measure of the overall extent of topographic error; this is the numberTE.
[image:15.605.48.404.70.437.2]development of ODCs is also increased, with the result that they are always stable and never partially form and then disappear (cf. Goodhill, 1993). This is in contrast to simulations in which ex-plicit lateral interactions are not modeled.
DISCUSSION
We have shown that a neurotrophic model of synaptic plasticity using a model that generates a phenomenologically accurate representation of spontaneous retinal activity can robustly lead to the segregation of retinogeniculate afferents into eye-specific lam-inae in the LGN and geniculocortical afferents into ODCs in the striate cortex. Furthermore, such activity patterns can success-fully drive the refinement of an initially coarse topography and initially diffuse receptive fields into adult-like states. The use of visually evoked activity also led to the intriguing observation that ODCs can partially form but then slowly disappear.
What features of the simulated spontaneous retinal activity used here are critical in our model for driving normal develop-ment? We have already discarded interwave intervals for compu-tational reasons. For receptive field and topographic refinement, interwave intervals are not likely to be important, although they will be important, as argued in Results, in helping to determine, for example, the periodicity of ODCs in the striate cortex. The intrawave temporal information—correlations in firing times of cells as a wave sweeps over a patch of retina—could be very important in real, developing systems. For example, very recent data indicate, at least in the retinotectal system, that there is a critical window of;40 msec during which the temporal coinci-dence of spikes from different afferents arriving at the same tectal cell can lead to either cooperative or competitive interactions between those synapses (Zhang et al., 1998). Unfortunately, the model of spontaneous retinal activity presented by Feller et al. (1997) uses a basic time step size of 100 msec, which is much too large to resolve interactions between synapses that occur over a few milliseconds. In addition, our neurotrophic model of plasticity
is formulated in terms of instantaneous firing rates, not as a spiking model of neurons, and thus at present does not lend itself to addressing temporal issues over very short time scales. To attempt to take such temporal issues seriously, although highly desirable, would at present be computationally intractable, given that we are already very close to the limits of our computational resources (with each simulation taking 1 month to run). Thus, at least for our current simulations, intrawave temporal data play no role in simulated development. We are therefore left with the spatial distribution of activity on the retinas at each simulated time step. These spatial data, and the way that they change from one time step to the next, play the key role in driving normal development in our simulations. Other models have used approx-imations to these spatial correlations, but ours is the first, to our knowledge, that uses spontaneous retinal activity with phenom-enologically realistic spatial properties.
Our simulations of the full, retinogeniculocortical pathway using spontaneous retinal activity would seem to be particularly applicable to the development of Old Monkey monkeys, which, for example, exhibit an adult-like pattern of ODCs at birth (Horton and Hocking, 1996a). Presumably, the prenatal develop-ment of the visual system of Old World monkeys is driven by such spontaneous activity. Our simulations of at least the retinogenicu-late pathway using spontaneous retinal activity are also applicable to the development of animals such as cats and ferrets, for which the development of the retinogeniculate pathway is essentially complete by the time of eye opening.
[image:16.605.238.561.59.331.2]Although NTFs are strongly implicated in the development of ODCs in the striate cortex (Carmignoto et al., 1993; Cabelli et al., 1995; Riddle et al., 1995), so far as we are aware no work implicates NTFs in the post-target-innervation development of the retinogeniculate pathway or in the development and refine-ment of receptive fields and topography in the cortex. Just as NTFs are implicated in the segregation of geniculocortical affer-ents into ODCs in the striate cortex, our model predicts that they Figure 12. The maintenance of ocular dominance