Abstract—This paper aims to present the results of the European research project reCORE (research for efficient configurations of remanufacturing enterprises). The goal of the project is to enable remanufacturing companies to handle complexity induced effects on the remanufacturing process by providing adapted and newly developed optimization methods. The paper describes the empirical approach of identifying and quantifying both, the drivers and the effects of complexity and the development of key performance indicators (KPIs) and methods to measure and handle complexity in remanufacturing companies. The final result is a configurator which allows the user to establish a company-tailored complexity management system by the output of a tailored set of optimization methods, KPIs and the supply with basic information on complexity and its drivers and effects in remanufacturing.
Keywords: Complexity, manufacturing processes, optimization methods, remanufacturing
I. INTRODUCTION
ccording to the study “Mastering Complexity” [1] 133 of 150 German top managers believe that the economy became more and more complex in recent years. Complexity can be described as the opposite of simplicity, comprehensibility, and predictability. The named study also states, that despite most of the companies identifying the negative effects of increasing complexity, only 6% of all interviewed companies have applied appropriate instruments to handle it [1]. This shows that there is still a general lack of knowledge in companies when facing complexity and its effects.
At the same time it raises questions about the state of scientific activities in this field and existing methods and instruments for managing complexity in companies. Regarding the literature, it can be said that complexity in manufacturing companies is actively discussed (see III.B). However, compared to manufacturing companies, remanufacturing companies show different characteristics Manuscript received March 6, 2013; revised April 9, 2013. This work was supported by the Federal Ministry of Economics and Technology, Germany.
Sandra Seifert is with the Chair Manufacturing and Remanufacturing Technology, University of Bayreuth, 95440 Bayreuth, Germany (phone: +49 921 55 7334; fax: +49 921 55 7305; e-mail: [email protected]).
Steffen Butzer is with the Chair Manufacturing and Remanufacturing Technology, University of Bayreuth, 95440 Bayreuth, Germany (e-mail: [email protected]).
Hans-Henrik Westermann is with the Chair Manufacturing and Remanufacturing Technology, University of Bayreuth, 95440 Bayreuth, Germany (e-mail: [email protected]).
Prof. Dr.-Ing. Rolf Steinhilper is head of the Chair Manufacturing and Remanufacturing Technology, University of Bayreuth, 95440 Bayreuth, Germany ([email protected])
and challenges (see III.A). Research activities in the field of remanufacturing, are generally rare, and focused on studying challenges and problems often without providing solutions [2]. The same applies to research activities dealing with complexity in remanufacturing. Therefore, this paper shows the main aspects of an approach to reduce this gap by presenting a way to systematically manage complexity in the industrial sector of remanufacturing.
II. RESEARCH METHODOLOGY
All results shown have been gained within an empirical approach. The data collection was generated by questionnaires and analyses of company data. The evaluation and validation of the solutions developed was done by expert interviews or pilot trials. Furthermore, the configurator developed and its content were tested and validated in an expert workshop. The analysis and evaluation of complexity drivers and effects described in section IV has already been published on the Swedish Production Symposium 2012 [3] but is described again in this paper to show all results coherently and traceably.
III. THE STATE OF SCIENTIFIC KNOWLEDGE AND THE NEED FOR ACTION
A. Remanufacturing
Remanufacturing is the industrial process to restore used products at the end of their lifecycle, named ‘cores’, to products with a quality defined as ‘good-as-new’ [4], [5].
Fig. 1. The remanufacturing system (modified) [5], [6]
The remanufacturing industry represents a worldwide market with a turnover of approximately US$ 100 billion [7], [8]. Basically, the remanufacturing process of mechanical products can be divided into five main process steps (Fig. 2) [9].
Managing Complexity in Remanufacturing
Sandra Seifert,
Member, IAENG,
Steffen Butzer,
Member, IAENG,
Hans-Henrik Westermann, Rolf Steinhilper
Fig. 2. Main steps in the remanufacturing process [9].
The process steps of disassembly, cleaning, inspection and sorting are remanufacturing specific and do not exist in manufacturing companies [5], [9].
According to Lundmark and Sundin remanufacturing companies face the following challenges [5]:
Unpredictable fluctuation in customer demand Uncertain core availability
Volatile quality of cores Small batch sizes Low automation level
Another challenge is the high variety due to the wide range of original equipment manufacturers, different product groups, series, and generations as well as various modifications [2]. All these challenges lead to a high process variety and make production planning for remanufacturing difficult and complex.
B. Complexity
In manufacturing companies complexity occurs in various forms and areas. According to Ulrich and Probst complexity is understood as a system quality whose degree depends on the number of system elements, the plurality of connections between these elements and the number of possible system states [10]. According to Schuh complexity is also determined by the number and diversity of elements and relationships that occur in this system and depends also on their temporal variability. It causes industry and company specific effects which lead mainly to inefficiency and increased costs [11].
There are generally three main management strategies to tackle negative effects of complexity: avoid complexity, reduce complexity, and handle complexity [2], [12]. Progress in the context of complexity management can currently be identified to a greater extent in the field of variety management and logistics, especially in supply chain management and production techniques [11], [13], [14]. In order to set up an effective complexity management, companies should not focus on minimizing complexity but on gaining a level of complexity tailored to the company´s requirements [11].
Schuh recommends to aim at balancing internal and external complexity in companies. The individual needs of customers (external complexity) force many companies to present a diverse product portfolio in the market (internal
complexity) [11]. With each new variant the manufacturing effort of a product rises. The amount of additional work is directly related to the degree of process complexity, which in turn is determined by the number of different variants of a product [12]. In addition to the individualization of (technical) products, the increasing demand for operational excellence like short lead times, efficient use of resources, and minimal emissions contribute to an increase in complexity. The products are not the competitive factor now, but their efficient production is [13].
C. Need for action
Studies show, that in manufacturing companies, costs related to product and process complexity account for 25% of the total costs [12]. Uncontrolled complexity appears in, e.g. increased administrative expense for master and transaction data, reduced speed of production and business processes, as well as increased error costs. As a base for effective management of complexity, a precise knowledge of the occurring negative effects and the relevant areas is needed in order to be able to categorize these effects and areas. Therefore, Golovatchev and Budde propose the use of generic areas, like product complexity and process complexity. In a second step they assign subareas like time, cost, process quality, and product quality [15] in which the effects can be researched and allocated. This approach provides a comprehensive overview of existing complexity effects and related areas, allowing the creation of a target oriented complexity management system.
Within their study Lundmark and Sundin found uncertainty and complexity are the most challenging factors in remanufacturing which have to be tackled in future research [5]. But approaches for managing complexity specific to the needs of the remanufacturing industry do not exist so far which is shown by the lack of related literature. Companies in that industry have a lack of influence on the avoidance of variety and consequently on the increased product and process complexity.Therefore, the development of a new methodology for a successful complexity management, created upon a detailed knowledge of complexity drivers and effects [11], [14] is called for. The existing gap in complexity management in remanufacturing companies is underlined by the results of an interview with remanufacturing executives: in an average remanufacturing company 90% of the product complexity is caused by products that contribute to sales by only 10% [16]. By establishing a complexity management, it is necessary to consider different company characteristics like company size, product types, product size, output etc. because different characteristics ask for different solutions and limit the application of certain methods. For example, Kanban often cannot be used within small and medium sized remanufacturing companies because of their diversified and highly flexible production program [17].
Budde. Based on the identified drivers and effects, a configurator containing key performance indicators (KPIs) and optimization methods for measuring and managing complexity effects in remanufacturing companies is set up. It enables executives of remanufacturing companies to establish a complexity management tailored to the complexity occurring in their companies.
IV. ANALYSIS AND EVALUATION OF COMPLEXITY IN REMANUFACTURING COMPANIES
A. Identification of complexity drivers and effects
For a systematic analysis of the complexity drivers and effects, a subdivision in the dimensions size, uncertainty, diversity, and dynamics [2] is used. For a more detailed subdivision the target fields production planning and control, core management, production organization, as well as identification are defined. Thereby a "dimension" corresponds to the extent of a "generic area" by Golovatchev’s and Budde’s approach. The target fields correspond to their "subareas". In process analyses and expert interviews conducted in different remanufacturing companies, occurring complexity drivers and effects were subsequently identified in the context of and assigned to the dimensions and target fields. An Ishikawa or cause-effect diagram was used for allocating and documenting the results clearly and to display causes and effects of single and multiple events in a structured manner. This approach is also appropriate to analyze complex influences on functional relationships in production processes [18].
With the methodology described, 57 drivers and 50 effects of complexity across all dimensions and target fields were identified in remanufacturing.
B. Quantification of complexity drivers and effects
After identifying the complexity drivers and effects a suitable method for their quantification must be applied. For this purpose, the created complexity Ishikawa diagram is transferred into a calculable table in matrix form that is capable of computer-aided evaluation. This table contains the complexity drivers identified in their respective target fields and their respective dimension with the 50 different effects. Thereupon a discrete specific valuation for the combination is awarded, registering a "1" for "effect occurs," or "0" for "effect does not occur" in an integrated assessment column. This is done by taking the previously evaluated analysis results into consideration, both on a quantitative and, with the help of expert interviews, on a qualitative basis. For the quantification, more than 4,800 combinations of each complexity driver, each target field, and each dimension are examined and evaluated within the evaluation table. Afterwards, the effects caused by complexity, are quantified and thereby measurable.
C. Results of the quantification
The quantified drivers and effects allow the identification of main drivers and effects and offer the possibility to derive a suitable complexity management. Fig. 3 and Fig. 4 show the main drivers and effects.
The chart shown in Fig. 3 indicates that for a total
[image:3.595.312.544.149.342.2]consideration of the results of all dimensions and target fields, the effects "High effort for coordination (internally)" with 66-fold occurrence, "Experienced based knowledge is necessary" with 62-fold occurrence and "Broad qualifications/skills are necessary" with 60-fold occurrence represent a high proportion compared to the other effects turning up.
Fig. 3. The top ten complexity effects in the field of remanufacturing
Hence, complexity in remanufacturing companies leads primarily to a high internal effort on coordination. Furthermore, a high level of knowledge and experience of staff accompanied with a broad qualification is required in order to meet the increased complexity in remanufacturing companies. All effects have in common that they usually require individual experience-based reactions of the employees, which differ from existing standards and often require the presence of implicit knowledge. Such knowledge cannot or is barely possible to be shared verbally, but only through personal experience or by learning through the model [19].
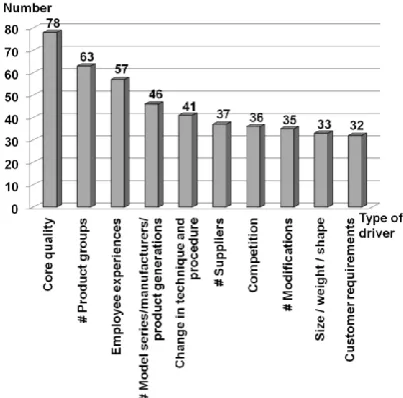
The top drivers are core quality, the number of different product groups, and the experience of the employee (Fig. 4). Together with the other complexity drivers illustrated they cause most of the effects.
[image:3.595.324.526.568.767.2]By accounting these complexity drivers in connection with the previously identified effects "High effort for coordination (internally)", "Experienced based knowledge is necessary", and "Broad qualifications/skills are necessary", it is immediately obvious that the so far only qualitative assumption of an active relationship can be confirmed by the shown approach. Associating all the identified complexity drivers with the assigned effects, a ranking of all involved complexity drivers and effects based on the evaluation can be established. In addition, the target fields and dimensions can be determined, in which the complexity drivers occur with their respective effects. A division of the identified complexity effects into the three major categories "avoid", "reduce", and "handle" [12] is suitable for a subsequent selection of optimization methods. This division makes it possible to preselect the identified complexity effects for an optimization and to choose appropriate optimization measures.
D. Derivation of a solution approach
After executing the described analysis and evaluation of complexity in remanufacturing companies, complexity drivers and effects are determined. In the next step optimization methods have to be allocated which are suitable for managing the determined complexity effects. These methods have to be accessible and selectable by remanufacturing companies for setting up a company tailored complexity management. Therefore a configuration tool, hereinafter referred to as configurator, is developed which supports the user interactively.
V. DEVELOPMENT OF A CONFIGURATOR FOR MANAGING COMPLEXITY IN REMANUFACTURING COMPANIES A. Goal and concept of the configurator
Goal of the development of the configurator is to enable executives of remanufacturing companies to find out about applicable complexity drivers and to select appropriate optimization strategies for managing complexity effects tailored to their needs.
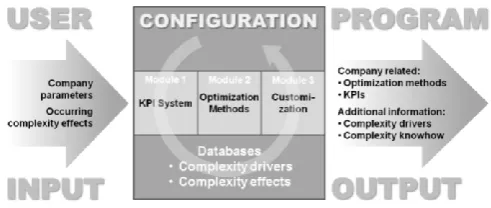
[image:4.595.44.290.667.771.2]The configurator is set up as a web based tool which outputs information based on the user´s input as well as stored databases and findings shown in section IV of this paper. Fig. 5 displays the general concept of the configurator. By putting in company specific parameters and choosing complexity effects which are occurring in the user´s company, related drivers which cause the effect, methods which are suitable to manage the effect and related KPIs which enable the user to measure the management success are presented.
Fig. 5. General concept of the configurator
The configurator is aligned to a predefined user profile: Male or female
Several years of professional experience in technical management (production manager, technical director) Management responsibility
Expert know-how in the fields of process optimization and remanufacturing
Experience in using an ERP system
The development of the configurator can be divided in three modules:
Module ‘KPI system’
Module ‘Optimization methods’ Module ‘Customization’
The content and development of the different modules as well as the output is described in the following sections.
B. Development of the module ‘KPI system’
This module contains a set of KPIs which are outputted to the user of the configurator discretely to the selected complexity effect.
Corresponding to the quote "If you can’t measure it you can’t manage it" [20] it is important to know how to measure complexity effects to make them visible to remanufacturers and also controllable. KPIs are a useful tool for that and also for reducing complexity. They provide information on a particular parameter and allow its analysis and quantification as well as the derivation of targets [13].
The KPIs supposed to be used for the configurator have to enable the remanufacturing company to measure and take influence on a complexity effect existing in their company. Therefore one suitable KPI is allocated for each of the 50 detected complexity effects. For this, existing KPIs are researched and examined regarding their suitability. If there is no match, existing KPIs are adapted and improved or new KPIs are defined. The final step is to test the KPIs in one remanufacturing company. Focus of the test is the applicability of the KPIs as well as the comprehensibility and acceptance of workers and executives. The KPIs and related effects are documented in a two-dimensional matrix which cannot be shown in this paper due to limited space but which is available on the homepage of the research project reCORE and, of course, visible by using the configurator (please also see section ‘Appendix’).
C. Development of the module ‘Optimization methods’
This module contains a set of optimization methods which are outputted to the user of the configurator depending on the selected complexity effect.
effect category – optimization method. Value “1” means “method is suitable”, value “0” means “method is not suitable”. This way each of the 50 effects is compared to the 45 methods and tools which results in an amount of 2,250 combinations documented in a two-dimensional matrix. The matrix is used to further analyse the efficiency of the method allocation. Central questions of the analysis are if there are a) effects which no or few optimization methods are regarded as suitable for and b) if there are optimization methods which are not suitable to manage any complexity effect or just effective for a few effects. The results of this analysis are used to remove superfluous methods as well as to detect gaps amongst the available methods and thus to identify the need for further development. The final two-dimensional matrix consists of a set of 47 existing and adapted or newly developed optimization methods which allow the management of all detected complexity effects in remanufacturing covered in this paper. The adapted and newly developed methods have been validated in a workshop together with the configurator (see section V.F).
[image:5.595.49.290.346.561.2]This matrix cannot be presented in this paper due to limited space but is available on the homepage of the research project reCORE (please also see section ‘Appendix’). Fig. 6 shows the top 50% (cumulated) of the methods evaluated.
Fig. 6. The top methods for managing complexity in remanufacturing
D. Development of the module ‘Customization’
The customization property of the configurator is twofold. Outputting suitable methods after putting in company specific complexity effects is the main customizing aspect. This selection of outputted methods is further tailored to the user´s needs by allocating parameters to the methods. These parameters are requirements which restrict the application of single methods and have to be fulfilled by the company. Therefore, the user of the configurator is asked initial questions about the parameters when starting a configuration session which can be responded to by selecting a predefined answer. The outputted optimization methods are filtered according to the answers given by the users.
To define the relevant parameters, company related properties are researched and allocated to the methods in
order to find out whether there are restrictions or not. As a result of the allocation, the following parameters are defined as relevant:
Number of employees Number of customers Number of products Number of variants Production quantity Product size
Product technology (mechanical, electronic, etc.) The initial questions and optional answers are defined accordingly.
E. Output ‘User specific complexity management’
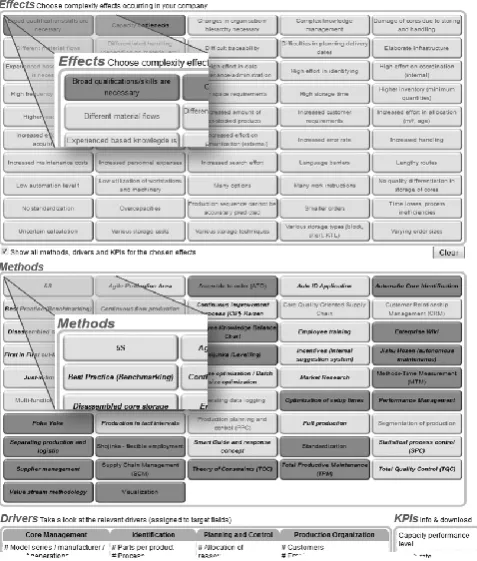
During the configuration session the user can choose as many of the 50 complexity effects considered applicable by him in his company. When putting in a complexity effect the configurator shows a set of optimization methods as well as related KPIs and drivers. The user has a choice here. He can choose a single effect and get a discrete proposal of methods, KPIs, and drivers. Or he can choose a set of effects and get a) the intersection or b) the union of related methods KPIs, and drivers. An additional way to use the configurator is to choose a method instead of an effect. The user is then shown which of the 50 complexity effects can be handled by the selected method. Text boxes with short information on effects and methods provide support for making the selection. Fig. 7 gives an impression of the user interface. The user can document the results of the configuration session by screenshots of the user interface and saving those as PDF files or in any preferred file format. Detailed method and KPI descriptions can directly be downloaded as PDF files.
[image:5.595.307.546.468.749.2]The documented results enable the user to establish a specific complexity management system for his remanufacturing company. In addition, the user is provided basic knowledge on complexity occurring in companies and is shown links to further references and related topics.
F. Validation of developed methods and the configurator
The configurator function and its content have been validated in an expert workshop by representatives of remanufacturing companies.
The developed methods were introduced to the participants of the workshop followed by a serious discussion on them. Finally the participants validated each method by a standardized questionnaire interrogating quality, comprehensibility, and applicability from a company´s perspective. The results of the validation are used to adapt and improve the methods.
The participants were also introduced to the operation of the configurator which they were asked to test and evaluate by putting in their company specific data and complexity effects recognized. Final steps were again a discussion and a standardized questionnaire on the performance of the configurator. The participants were also asked to bring in optimization ideas. Based on the validation results the configurator is complemented and improved by the following functions:
Categorization of effects to provide a clear overview. Highlighting of effects commonly associated with the
chosen one.
Provision of a final summary showing the chosen effects as well as the main complexity drivers and suitable methods ranked by effectiveness.
The participants validated the configurator and its content unanimously as very suitable for managing complexity in remanufacturing companies.
VI. CONCLUSION
This paper was aimed on presenting an approach enabling remanufacturing companies to handle complexity induced effects on the remanufacturing process by providing adapted and newly developed optimization methods. The final result is a configurator which provides its user with the opportunity to establish a complexity management system for his remanufacturing company consisting of methods and KPIs tailored to the complexity effects occurring in the company.
Nevertheless, the configurator is based on analyses that do not consider causal interactions and interdependencies between the complexity drivers, or the effects, detected. This is a topic for future research. Furthermore it would be interesting to analyse complexity costs in remanufacturing to make complexity drivers and effects monetarily assessable.
APPENDIX
All analyses and results described in this paper are shown in detail on the homepage of the research project reCORE (www.recore.org). The presented configurator is also linked to the homepage. The presentation given in this paper contains pictures and examples of analyses, matrixes and the configurator and is also available as a download on the
homepage. One can also contact the authors of this paper who have been the main contributors in the project reCORE.
REFERENCES
[1] Schey, V., Roesgen, R.: Mastering Complexity. Camelot Management Consultants AG, November 2012
[2] Haumann, M.: Variantenmanagement in der Refabrikation. Dissertation, In: Rieg, F.; Steinhilper, R. (Ed.): Fortschritte in Konstruktion und Produktion. Band 19. Shaker Verlag Aachen 2011 [3] Haumann, M.., Westermann, H. H., Seifert, S., Butzer, S.:
Managing complexity – A methodology, exemplified by the industrial sector of remanufacturing, Proceedings of the 5th International Swedish Production Symposium, Linköping, Sweden, 2012, pp. 107-113
[4] Steinhilper, R., Hudelmaier, U.: Erfolgreiches Produktrecycling zur erneuten Verwendung oder Verwertung; Ein Leitfaden für Unterneher. RKW Stuttgart, 1988
[5] Lundmark, P., Sundin, E., Björkman, M.: Industrial Challenges within the Remanufacturing System. Proceedings of Swedish Production Symposium, Stockholm, Sweden, 2009, pp. 132-138 [6] Östlin, J.: On Remanufacturing Systems: Analysing and Managing
Material Flows and Remanufacturing Processes. Doctoral Thesis, Linköping, Sweden, 2008
[7] Hauser, W., Lund, R. T.: The Remanufacturing Industry; Anatomy of a Giant. Department of Manufacturing Engineering, Boston University, Boston, 2003
[8] Koopman, R.B.; Laney, K.: Remanufactured Goods: An Overview of the U.S. and Global Industries, Markets, and Trade. United States International Trade Commission, Washington DC, 2012
[9] Steinhilper, R.: Remanufacturing; The Ultimate Form of Recycling. Fraunhofer Stuttgart, 1998
[10] Ulrich, H., Probst, G.: Anleitung zum ganzheitlichen Denken und Handeln: ein Brevier für Führungskräfte. Haupt Verlag AG, Bern, Stuttgart, 1988
[11] Schuh, G.: Produktkomplexität managen-Strategien-Methoden-Tools. Carl Hanser Verlag, München, Wien, 2005
[12] Bick, W., Drexl-Wittbecker, S.: Komplexität reduzieren - Konzept. Methoden. Praxis. LOG_X Verlag GmbH, Stuttgart, 2008
[13] Westphal, J.: Komplexitätsmanagement in der Produktionslogistik. Ein Ansatz zur flussorientierten Gestaltung und Lenkung heterogener Produktionssysteme. Dissertation. Dt. Univ.-Verl., Wiesbaden, 2001 [14] Brosch, M., Beckmann, G., Griesbach, M., Dalhöfer J., Krause, D.
l.: Design for Value Chain – Ausrichtung des Komplexitätsmanagements auf globale Wertschöpfungsketten. ZWF 11 (2011), p. 855 et sqq.
[15] Golovatchev, J. D., Budde, O.: Next Generation Telco Product Lifecycle Management – How to Overcome Complexity Management by Implementing Best-Practice PLM. Studie. Detecon International GmbH, Bonn, 2010
[16] Haumann, M., Köhler, D.: Coping with complexity in remanufacturing. ReMaTecNews 3 (2009), RAI Langfords B.V. Publishing House Amsterdam, p. 32-33
[17] Syska, A.: Produktionsmanagement. Das A-Z wichtiger Methoden und Konzepte für die Produktion von heute. Gabler Verlag, Wiesbaden, 2006
[18] Ophey, L.: Entwicklungsmanagement – Methoden in der Produktentwicklung. Springer Verlag, Berlin, Heidelberg, 2005 [19] Warnecke, G.: Komplexität-mit Kompetenz bewältigen, mit
Technik beherrschen. ZWF 7-8 (2010), p. 639 et sqq.
[20] Grote, S., Kauffeld, S., Frieling, E.: Kompetenzmanagement – Grundlagen und Praxisbeispiele. Schäffer-Poeschel Verlag, Stuttgart, 2006
AUTHORS
![Fig. 2. Main steps in the remanufacturing process [9].](https://thumb-us.123doks.com/thumbv2/123dok_us/475157.545832/2.595.86.253.49.213/fig-main-steps-remanufacturing-process.webp)