Abstract— Breast cancer is the malignant tumor occurred mostly in women. Even though breast cancer can be fatal, the patient’s survival rate could be as high as 90% if it is detected at the early stage of development. Mammography, ultrasound, and magnetic resonance imaging are examples of screening test for breast cancer. However, to precisely and correctly interpret these images, the medical expertise of radiologists is essential. At present with the matured machine learning techniques, computerized methods can be applied to assist tumor diagnosis, such as the classification between benign and malignant types of tumor. We present in this paper the image-preprocessing and the optimized parametric techniques to help improving accuracy of benign-malignant classification from mammogram images. For the image-preprocessing, we used median filter for noise reduction and gamma correction for image brightness adjustment. We also used region growing technique to find the region of interest, then we extracted three groups of potentially discriminative features: texture feature, shape feature, and intensity histogram feature. After the image-preprocessing, we performed parameter optimization using genetic algorithm prior to the classification done by support vector machine. The results showed that with the appropriate feature selection and the optimal parameter adjustment, the support vector machine can improve its accuracy from 89.47% into 92.98% for mammogram image classification.
Index Terms— Parameter Optimization, Genetic Algorithm, Mammogram Images Classification, Support Vector Machine.
Manuscript received September 26, 2016; revised January 16, 2017. This work was supported in part by grant from Suranaree University of Technology through the funding of Data Engineering Research Unit.
K. Suksut is a doctoral student with the School of Computer Engineering, Institute of Engineering, Suranaree University of Technology, NakhonRatchasima, Thailand (corresponding author: phone: +66879619062; e-mail: [email protected]).
R. Chanklan is a doctoral student with the School of Computer Engineering, Institute of Engineering, Suranaree University of Technology, NakhonRatchasima, Thailand (e-mail: [email protected]).
N. Kaoungku is with the School of Computer Engineering, Suranaree University of Technology, Muang, Nakhon Ratchasima, Thailand (e-mail: [email protected]).
K. Chaiyakhan is with the Computer Engineering Department, Rajamangala University of Technology Isan, Muang, Nakhon Ratchasima, Thailand (e-mail: [email protected]).
N. Kerdprasop is with the School of Computer Engineering, Suranaree University of Technology, Muang, Nakhon Ratchasima, Thailand (e-mail: [email protected]).
K. Kerdprasop is with the School of Computer Engineering, Suranaree Universiyof Technology, Muang, Nakhon Ratchasima, Thailand (e-mail: [email protected]).
I. INTRODUCTION
Among diagnosed cancers in women, breast cancer is the most prominent type and it can be deadly. Usually, early tumor diagnosis can improve survival rate and help the preparation for appropriate treatment. Breast cancer detection can be done through the ultrasound screening [1], magnetic resonance imaging [2], and mammography [3]. The background knowledge for screening cancerous cases is that for the benign (or non-harmful) cases, tumor shapes are regularly round and smooth. On the contrary, for the malignant (or harmful) breast cancer cases, tumors tend to demonstrate irregular and undulated shapes [4].
During the last years, many researchers used mammogram images for breast cancer diagnosis. However, the mammogram images always have noise. The effect of noise is that it can blur some important parts in the images (some points or pixels in images that are normal tissue might look like tumor).
Currently, there are many techniques for de-noise (remove noise) such as image enhancement [5], image segmentation [6], and image feature extraction [7]. It can improve the accuracy for classifying between benign and malignant tumors.
At present, there are many efficient automatic techniques for classification such as decision tree learning, artificial neural network, support vector machine, and many more. Among the existing techniques, support vector machine is generally the most accurate one. If we apply techniques for de-noising and then adopt support vector machine algorithm with the optimized parameters for classification, it can intuitively improve performance of mammogram image classification.
In this paper, we thus propose parameter optimization for support vector machine to classify mammogram image. The goal of this research is to improve the breast cancer classification performance. We apply genetic algorithm for parameter optimization (parameters C, epsilon, and gamma to be used in the support vector machine). We pre-process the images by de-noising with the median filter technique, adjusting image intensity with the gamma correction technique, then finding the region of interest to choose only the potential area for cancerous cell detection with region growing technique, and finally performing feature extraction to contain texture feature, shape feature, and intensity histogram.
Parameter Optimization for Mammogram Image
Classification with Support Vector Machine
II. MATERIALS AND METHODS
A. Median Filter
The intuitive idea of median filter is that some pixels in the image may contain noise and this noise can be detected through its extreme value that does not get along with the surrounding pixels. The median filter method [8] to handle noisy pixel is thus to create a small window frame for normalizing a specific pixel value within that frame (in this work, we set the size of a window to be 3x3 pixels). During the filtration process, a small window is moved along the pixel grid within the image. At each position of a window frame, all the pixel values (i.e., nine values for our 3x3 frame) within the frame are sorted. The median pixel value is then used to replace the existing pixel value. Example of a median filter process is illustrated in fig 1.
B. Gamma Correction
Gamma correction [9] can enhance the contrast of the image. It has value between 0to 1, where 0 means darkness (black color) and 1 means the brightness (white color). Given the parameter γ as the encoding or decoding value, we can compute the value of gamma correction with the formula given in equation (1).
𝐶𝑜𝑟𝑟𝑒𝑐𝑡𝑒𝑑 = 255 ∗ (
𝐼𝑚𝑎𝑔𝑒255
)
(1𝛾)
(1) Note that if γ > 1, it is called a decoding gamma in which the shadow in that image will be set darker. For γ < 1, it is called an encoding gamma and will be used to make the dark region to be lighter.
C. Region Growing
[image:2.595.49.282.567.747.2]Region growing [10] is applied to choose only specific are of interest by merging surrounding areas with similar intensity.The process starts by setting the seed point, which is normally the middle point (ormiddle pixel) in the image and then compare the intensity value of that point with the intensity values of the neighbor pixels. If the values are in the same class, we then increase the size of the region.
Fig 1. Demonstration of the median filter process
When the growth of one region stops, we then select another seed pixel outside the area previously processed.
D. Texture Feature
Texture feature [11] can help to identify the object in the image. Texture in the image can describe the physical properties (such as shape, curve) and can help to split different objects in an image. We can find texture feature with Grey Level Co-occurrence Matrix (GLCM).
E. Intensity Histogram Feature
Intensity histogram feature is used for describing the properties of the image. In this work, we consider four statistical features that can be obtained from the histogram. These statistics are mean, variance, skewness and kurtosis.
Mean is an average intensity level. Variance is the variation of intensities around the mean. Skewness is the indicator whether the histogram is symmetric, and kurtosis is a measure of whether the data are peak.
Given that G be the image gray scale level and P be the probability level of gray scale, the mean (µ), variance (𝜎2), skewness (𝑠), and kurtosis (𝑘) can be computed with formulas given in equations (2)to (5), respectively.
µ = ∑
𝐺−1𝑖=1𝑖𝑃(𝑖)
(2)𝜎
2= ∑
𝐺−1(𝑖 − µ)
2𝑃(𝑖)
𝑖=1 (3)
𝑠 = 𝜎
−3∑
𝐺−1(𝑖 − µ)
3𝑃(𝑖)
𝑖=1 (4)
𝑘 = 𝜎
4∑
𝐺−1(𝑖 − µ)
4𝑃(𝑖)
𝑖=1 (5)
F. Shape Feature
Shape feature [12] can help to identify the object in the image by using shape of object within the image. Shape can differentiate between benign and malignant cases because benign tumors have smooth shapes and regularly round but malignant breast tumors tend to demonstrate irregular and undulated shapes. So, we can classify the object in image by compute the distance between center point in tumor and its edge. For a number of computed distances, if the values do not change or there is only a few change, we can predict that that image is a benign tumor. But if the distance values show much fluctuation, we can predict that the image is malignant tumor.
G. Genetic Algorithm
Genetic algorithm [13-14] is an algorithm to find the solution with adaptive heuristic search based on the evolutionary characteristic of nature. Genetic algorithm combines the concept of random search space and compares the randomly selected solutions based on some fitness function, and then selects the better solution. The simple genetic algorithm is shown in fig 2.
15 68 79 11 12 43 45 46 38 43 65 47 93 89 87 56 15 68 79 11
12 13 45 46 38 43 65 47 93 89 87 56
12 13 15 38 43 45 65 68 79
15 68 79 11 12 43 45 46 38 43 65 47 93 89 87 56
Choose the middle value
Fig 2. Flowchart for simple genetic algorithm. From fig 2, we can describe genetic algorithm with 5 main steps. Step 1 is setting the initial population; it is normally a random selection. Step 2 is defining the fitness function; it is used for evaluating the fitness of each population or chromosome. Step 3 is applying the genetic operation; the operation can be either selecting the chromosome or population with random selection, crossing over two parent chromosomes to create better offspring, or mutating a chromosome with randomly selected point. Step 4 is replacing individual in the population; it is the replacement of the old chromosome (parent chromosome or parent population) with the new generation. Step 5 is checking for stop criterion; it is a check point for whether to end the process such as stop the process when it has created the new generation over 3 generations.
H. Support Vector Machine
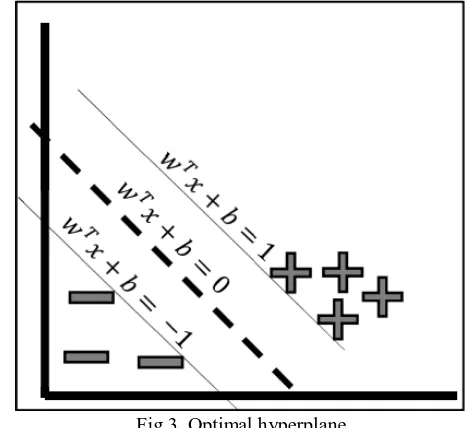
Support Vector Machine (SVM) [15] is a machine learning algorithm for classifying different classes of objects. SVM has been widely applied to many fields. SVM is a supervised learning machine in that it requires a class attribute for guiding the learning process to build a model that can classify objects with mixing classes correctly. The main concept of SVM is the generation of the optimal hyperplane that can separate the objects such that objects with the same class form themselves as a group, whereas objects in different classes should be in a different group. The hyperplane is called an optimal one if such plane can separate classes with the most distance between each class. Fig 3 shows an optimal hyperplane with a dashed line and the two classes in the figure are positive (represented as 1) and negative (-1). To use the hyperplane as a model to classify objects, the formula given in equation (6) can be applied.
𝑤
𝑇𝑥 + 𝑏 ≥ 1, 𝑤ℎ𝑒𝑛 𝑦
𝑖= +1 (6)
𝑤
𝑇𝑥 + 𝑏 ≤ 1,
𝑤ℎ𝑒𝑛 𝑦
𝑖= −1
wherex is data vector, w is weight vector,
Fig 3. Optimal hyperplane b is bias, and
y is a class.
To apply support vector machine for the classification task, users have to set three important parameters (C, epsilon, and gamma). Parameter C is to control the cost for miss-classification. This parameter is used to control the influence of each individual support vector (i.e., the data points on the borderlines which are up and below the optimal hyperplane in fig 3). Setting the C parameter involves trading error penalty for stability. Parameter epsilon is used to fit the training data. It controls the width of the epsilon-insensitive zone. The value of epsilon can affect the number of support vectors that are used to find the optimal hyperplane. Parameter gamma is the kernel parameter of the Gaussian radial basis function.
The small gamma implies that the learned model will have the large margin; the hyperplane has large distance between two class borderlines and more flexibility in data classification. The large gamma means that learned model will have small margin; the hyperplane has small distance between two class borderlines and thus no flexible in new data classification (may cause overfitting).
III. PROPOSED WORK
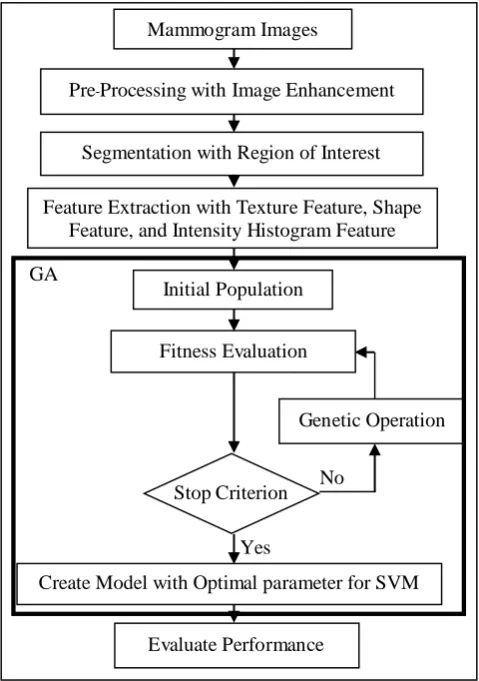
In the proposed work, we have designed the process of parameter optimization with genetic algorithm for mammogram image classification with the support vector machine as shown in fig 4.
From fig 4. We can describe our proposed framework as follows. For pre-processing images, we used median filter method for de-nosing, the output from this process is clearer image without noise. After that, we use gamma correction to enhance contrast of the image, the output from this step is
sharp image such that the tumor area has lighter intensity and density than the original image. For segmentation process, we use region of interest technique for choosing
only region of interest. The output of this process is the smaller image than the original one. A small size means the
reduction in dimension to contain only discriminative regions. For feature extraction process, we extract feature Initial Population
Fitness Evaluation
Genetic Operation Selection, Crossover, Mutation
Stop Criterion
End
No
[image:3.595.311.546.51.265.2]Fig 4. Flowchart of proposed framework for mammogram image classification.
with three techniques (texture feature, shape feature, and intensity histogram feature). The output of this process is the data that extract properties of images (shape, texture, mean, variance, etc.). Then we split the data from previous process into 2 parts. The first part (70% of all data) has been used to find parameter C, epsilon, and gamma with genetic algorithm. This first part of data is also used to create a classification model with support vector machine. The second part (30% of all data) has been used for performance evaluation of the learned model.
In genetic algorithm process, we define parameter control for genetic algorithm as follows:
Population size = 100
Iteration (number of generation) = 100 Probability of crossover = 0.8
Probability of mutation = 0.01 C in the range: 10-4 ≤ C ≤ 10
Epsilon in the range: 10-2 ≤ epsilon ≤ 2
Gamma in the range: 10-3 ≤ gamma ≤ 3
Fitness function = Accuracy = 𝑇𝑃+𝑇𝑁 𝑁 where
TP is number of true predicted benign cases, TN is number of true predicted malignant cases, and N is number of all data that are used to test model. The output of genetic algorithm is the three parameters that are optimal ones for SVM. After that, we use the
optimal parameter to create model with SVM. Finally, we evaluate performance model to assess its accuracy by using the test data. We finally compare the SVM performance with different set of input features.
IV. EXPERIMENTAL RESULTS
For experimentation, we use data set from the Digital Database for Screening Mammography (DDSM) with 190 images (benign 80 images, malignant 110 images) and split data into two parts with 133 images (70% of all data) used for creating a model and finding optimized parameters; we call this data set as “training set”. We use 57 images (30% of all data) for evaluating the performance of classification model; we call this data set as “testing set”. This work has been implemented with MATLAB and RStudio. We run our experiments on a core i3/3.50 GHZ computer with 12 GB of RAM. The details of data after extracting features by using texture feature, shape feature, and intensity histogram are shown in Table 1.
In the classification process, we also compare between different sets of input features that used as input to the support vector machine. We test different combinations of texture feature, shape feature, intensity histogram feature, and the optimized parameter with genetic algorithm for support vector machine. The accuracies of SVM after applying different combinations of input features are shown in Table 2.
[image:4.595.48.288.49.390.2]From table 2, it can be seen that the adjusted optimal parameters for support vector machine combined with techniques to extract only important features including texture feature, shape feature, and intensity histogram altogether can improve the performance for mammogram
Table 1. Detail of data set
Feature Extraction Techniques
#Training
set
# Testing set
# Features
Texture + Shape + Intensity Histogram
133 57 21
Shape + Intensity Histogram
133 57 6
Texture + Shape 133 57 17
Texture + Intensity Histogram
[image:4.595.303.550.487.677.2]133 57 20
Table 2. Classification results
Feature Extraction Techniques Accuracy
Texture + Intensity Histogram 81.58%
Texture + Shape 85.26%
Shape + Intensity Histogram 87.37% Texture + Shape + Intensity Histogram 89.47% Texture + Shape + Intensity Histogram +
Optimized Parameter for SVM with Genetic Algorithm
92.98% Mammogram Images
Pre-Processing with Image Enhancement
Segmentation with Region of Interest Feature Extraction with Texture Feature, Shape
Feature, and Intensity Histogram Feature Initial Population
Fitness Evaluation
Genetic Operation
Evaluate Performance Stop Criterion No
Yes
image classification from the 81.58% accuracy level at 81.58% up to the 92.98%. The classification by SVM using only the extracted features (i.e., the texture feature, shape feature, and intensity histogram) can obtain the highest accuracy at 89.47%. The experimental results show that with an extra steps of optimal parameter adjustment through genetic algorithm, the support vector machine shows an improve performance (from 89.47% to 92.98%) for classification mammogram images.
V. CONCLUSION
Breast cancer is the major type of dangerous tumors mostly occurred in women and causes numerous deaths in the developing countries. Early detection of malignant breast cancer cases is, more or less, expected to help the appropriate preparation for successful treatment. Breast cancer can be screened with ultrasound imaging, magnetic resonance, or mammogram imaging.
In this work, we propose a framework for automatic classification of malignant breast cancer, the harmful one, from the benign cases, the non-harmful. According to our framework of breast cancer classification with mammogram image, the first step is the noise removal from the mammogram image and the image intensity enhancement. Median filter and gamma correction are the two techniques to de-noise and to enhance contrast of the image, respectively. Region growing technique is then applied to select only area or region of interest.In our work, it is the image regions that are anticipated to contain tumor cells.
We then apply image feature extraction to obtain only important features suitable for the subsequent classification model learning step. The prominent features are texture feature, shape feature, and intensity histogram containing statistical information including mean, variance, skewness, and kurtosis. Another important step in our framework is the application of the genetic algorithm to find the optimal parameters (cost, epsilon, and gamma) for training the support vector machine. The experimental results show that the parameter optimization through genetic algorithm technique can obviously improve the SVM performance for mammogram image classification; it is better than using the default parameters.
REFERENCES
[1] X. Shi, H.D. Cheng, L. Hu, W. Ju, and J. Tian, “Detection and classification of masses in breast ultrasound images,” Digital Signal Processing, vol. 20, no. 1, pp.824-836, 2010.
[2] M.J. Collins, J. Hoffmeister, and S.W. Worrell, “Computer-aided detection and diagnosis of breast cancer,” Seminars in Ultrasound, CT and MRI, vol. 27, no. 4, pp.351-355, 2006.
[3] A. Oliver, X. Llado, E. Perez, J. Pont, E. Denton, J. Freixenet, and J. Marti, “A statistical approach for breast density segmentation,” Journal of Digital Imaging, vol. 23, no. 5, pp.527-537, 2010. [4] H. Lee, and Y. Chen, “Image based computer aided diagnosis system
for cancer detection,” Expert Systems with Applications, vol. 42, no. 1, pp.5356-5365, 2015.
[5] R. Berannek, W. Jakubowski, A. Mazurczak, M. Postolski, and W. Wiazel, “Contrast enhanced evaluation of the solid lesions in the breast-own experience,” European Journal of Ultrasound, vol. 7, no. 1, pp. S13, 1998.
[6] R. Szeliski, “Computer Vision Algorithms and Applications,” Springer, 2010.
[7] K. Chaiyakhan, N. Kerdprasop, K. Kerdprasop, “Feature selection techniques for breast cancer image classification with support
vector machine,” Proceedings of the 24th International Multi Conference of Engineers and Computer Scientists (IMECS2016), Hong Kong, pp.237-232, March 2016.
[8] T. Chen, K. K. Ma, and L. H. Chen. “Tri-state median filter for image denoising. Image Processing,” IEEE Transactions on, vol. 8, no. 12, pp.1834-1838. 1999.
[9] H. Farid, “Blind inverse gamma correction,” Image Processing, IEEE Transactions on, vol. 10, no. 10, pp.1428-1433, 2001.
[10] R. Rouhi, M. Jafari, S. Kasaei, and P. Keshavarzian, “Benign and malignant breast tumors classification based on region growing and CNN segmentation,” Expert Systems with Applications, vol. 42, no. 1, pp.990-1002, 2015.
[11] A. V. Alvarenga, W. C. A. Pereira, A. F. C. Infantosi, and C. M. Azevedo, “Complexity curve and grey level co- occurrence matrix in the texture evaluation of breast tumor on ultrasound images,” Medical Physics, vol. 34, no. 2, pp.379-387, 2007.
[12] W. C. Pereira, A.V. Alvarenga, A. F. Infantosi, L. Macrini, and C. E. Pedreira, “A non-linear morphometric feature selection approach for breast tumor contour from ultrasonic images,” Computer in Biology and Medicine, vol. 40, 2010.
[13] H. Holland, “Adaptation in Natural and Artificial Systems,” Ann Arbor: the University of Michigan Press, Michigan, 1975.
[14] R. A. C. Yang, Z. Zhou, L. Wang, and Y. Pan, “Comparison of Different Optimization Methods with Support Vector Machine for Blast Furnace Multi-Fault Classification,” IFAC-Papers Online, vol. 48, no. 21, pp.1204-1209, 2015.