Effect of flour and sugar particle size on the properties
of cookie dough and cookie
Hüseyin Boz*
Department of Gastronomy and Culinary Arts, Tourism Faculty, Atatürk University, Erzurum, Turkey
*Corresponding author: [email protected]
Citation: Boz H. (2019): Effect of flour and sugar particle size on the properties of cookie dough and cookie. Czech J. Food Sci., 37: 120–127.
Abstract: The effect of particle size of flour and sugar on the physical, sensorial and textural properties of cookie dough and cookie was investigated. According to the obtained data, both the sugar particle size and the flour particle size in cookie dough affected the hardness, adhesiveness, cohesiveness and springiness of the cookie doughs and this effect was statistically at a significant level (P < 0.01). The energy and force required for the dough extrusion dropped due to the reduction in the particle size of flour, while the reduction in the particle of sugar had the opposite effect. As the sugar and flour particle sizes decreased, the colour of the cookies became darker and the L colour values decreased. While the hardness values of the cookie samples increased with the decrease in the particle size of sugar, it decreased with the decrease in the particle size of flour. It was observed that sugar and flour particle size significantly affect cookie quality in cookie production. The formulation containing sugar and flour fractions below 150 µm has received the highest score in all sensory parameters.
Keywords: forward extrusion; fracturability; particle size; sensory properties; textural properties
Cookies are among the most popular bakery products consumed nearly by all levels of society. Some of the factors for such wide popularity are varied taste, easy availability, longer shelf life and low cost compared to other bakery products (Hrušková & Švec 2015; Jan et al. 2016). In addition, due to containing a high level of carbohydrates and fat, cookies are also a good source of energy (Pareyt et al. 2011; Yousaf et al. 2013; Švec et al. 2017).
Sucrose is the most important sugar used in the production of cookies. It is also one of the most commonly used sugars in cookie production because it does not only provide sweetness but also affects the structural and textural properties of the cookie. Moreover, it lowers the viscosity of dough as well. During baking, the undissolved sugar progressively dissolves and contributes to the spread of the cookie (Hoseney 1994; Maache-Rezzoug et al. 1998; Pareyt et al. 2009).
During wheat milling, wheat flour is obtained in dif-ferent fractions depending on wheat hardness and milling technique. It is stated that the particle size of flour is very important in terms of quality flour production. Particle size of flour obtained as a result of the grinding has great importance in terms of flour quality. It has been stated that flour particle size, damaged starch and protein quantity and qual-ity have effects on the bakery products. Because flour particle size is an important factor affecting protein quality, damaged starch content and quality of bakery products (Guttieri et al. 2001; Shekara et al. 2013; Barak et al. 2014).
tex-tural properties of the cookies. Most studies have investigated the effect of particle size of flour on the properties of bakery products. In a study conducted to find out the influence of flour particle size on the quality of cookie it was determined that the flour with particle size greater than 150 µm delivers better results in cookies (Barak et al. 2014). In another study, the effect of sugar particle size on cookie characteristics was investigated (Kissel et al. 1973). However, none of those studies analysed the effect of particle size of flour and sugar on the properties of cookie dough and cookie. Therefore, the purpose of this study is to research this issue.
MATERIAL AND METHODS
Flour, sugar (sucrose), shortening, sodium chloride and sodium bicarbonate used in cookie production were supplied from the local supermarkets in Er-zurum, Turkey. Moisture, crude protein and total ash contents of wheat flour were determined accord-ing to AACC (1984) approved methods. The wheat flour containing 13.5% moisture, 8% protein and 0.55% ashes was used in the study. Flour and sugar particles of different sizes (> 180 µm, 150–180 µm and < 150 µm) were separated with the help of me-chanical sifter using sieves of pore sizes 150 µm and 180 µm. Thus, three fractions of each of the flour and sugar were obtained.
Preparation of cookies. Cookies were prepared
ac-cording to AACC approved method 10–50D (2000). The ingredients used in cookie formulation were flour (225 g), sugar (130 g), shortening (64 g), dextrose solution (33 ml), sodium bicarbonate (2.5 g), sodium chloride (2.1 g) and distilled water (16 ml). The dough was sheeted to 9 mm thickness on a dough sheeter and cut into round shape with cutter of 50 mm di-ameter. Baking was done in an electric oven at 200°C for 10 minutes.
Forward extrusion test. Forward extrusion test of
formulated cookie doughs was performed in a TA-XT plus texture analyser (Stable Micro Systems, UK) equipped with a 30 kg load cell and operating at 5 mm/s head speed (Ronda et al. 2013). It mea-sured the compression force (hardness) required for a piston disc to extrude the dough through a specific size outlet (8 mm) in the base of the sample container. The extrusion cell and the compression plunger were 2.58 and 2.55 cm in diameter, respectively. Samples were carefully scooped into cylindrical plastic
con-tainers with a spoon. The force (hardness) necessary to continue the extrusion process and the area (energy) under the curve were determined with the extrusion test. All measurements were repeated five times.
Texture analysis. Texture characteristics of cookie
dough (hardness, cohesiveness, adhesiveness and spring-iness) were measured by TA-XT plus Texture Analyser using a 25 mm aluminium cylinder probe (Zoulias et al. 2000). The pieces of cookie dough formatted to 3.6 cm diameter and 9 mm thick disks was used in TPA tests and they were compressed twice down to 30% of their original thicknesses using an aluminium cylindrical probe (50 mm) at a constant speed of 1 mm/s.
Physical properties of cookies. After the cookies
were baked, they were cooled for 30 min and their thicknesses and diameters were measured using digi-tal calipers. The spread ratio which is an indicator of the quality that a cookie has obtained by the ratio of cookie diameter versus the thickness. The specific volume of the cookies was calculated by the ratio of volume to weight. After the cookies were wrapped with a plastic stretch film, the volume of the cookies was determined from the amount of water overflow when they were immersed in a cylinder filled with water. Colour was measured using a Minolta Color-imeter CR-200 (Minolta Camera Co., Japan) on the basis of L*, a* and b* values (Elgün et al. 2002). L* value indicates the lightness (changing from 0 dark to 100 light), a* value gives the degree of the red-green colour (changing from –60 red-green to 60 red). The b* value indicates the degree of the yellow-blue colour (changing from –60 blue to 60 yellow).
Determination of fracture properties of cookies.
Cookies were evaluated measuring the peak break-ing force usbreak-ing the 3-point break technique with the TA-XT Plus Texture Analyser (Hwang et al. 2016). The settings for the device were as s follows: pre-test speed 1 mm/s, test speed 3 mm/s, post-test speed 10 mm/s, distance 15 mm, trigger force 50 g. A force–time diagram was obtained for each test. The force-time plots were analysed for peak break-ing force (N). The deformation of a cookie sample until it breaks during compression was recorded as fracturabillity (mm) of cookie.
Sensory evaluation. For the sensory evaluation of the
and were evaluated in terms of colour, aroma, texture and overall acceptability by the 20-person panel using a 9-point hedonic scale. The samples were presented on white plastic plates coded with three digit numbers and served randomly (Jan et al. 2016).
Statistical analysis. All the experiments were
carried out in triplicate and in two different trials. Statistical evaluations were performed using the SPSS package software (version 20.0; SPSS Inc., USA). The differences between the data were tested using the Duncan’s multiple range tests (P < 0.05).
RESULTS AND DISCUSSION
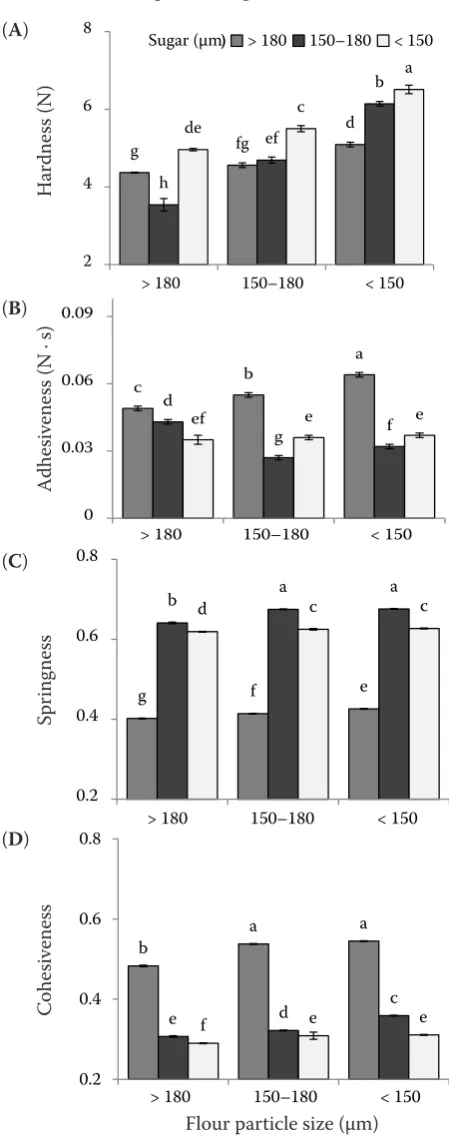
The reduction in the particle size of sugar and flour significantly affected the texture profile analy-sis results of the cookie dough (P < 0.01) (Figure 1). The hardness values of the cookie dough generally increased with the decrease in sugar particle size at three different flour particle sizes (Figure 1A). The highest hardness values (6.51 N) were obtained in formulations containing flour and sugar fractions below 150 µm. The solubility of sugar used in the formulation during preparation of dough is one of the most important factors affecting hardness in cookie doughs. The hardness of cookie dough is related to the interactions between sugar and water and the development of gluten. Thus, hard-ness of the dough can be thought of as a function of the solubility of sugars. Dough hardness may be reduced due to the increase in the solubility of the sugar in the dough formulation. Similar results were obtained in cookies containing different sug-ars. Taylor et al. (2008) stated that sugars having greater solubility result in a more soft dough. Also, Kissell et al. (1973) explained that increasing the surface area of sugar reduces the solubility during dough preparation.
The adhesiveness in the cookie dough is associated with the sugar that dissolves before the baking. For this reason, the high solubility of sugar during dough formation increases its adhesiveness. When the sugar is dissolved, an increase in the total solution volume occurs within the dough. Dissolved sugar inhibits the production of gluten while creating a syrup-like environment. Therefore, more adhesive dough is formed (Curley & Hoseney 1984; Taylor et al. 2008). According to the data obtained (Figure 1), the reduction in sugar particle size decreased the adhe-siveness values of the cookie dough. It can be said
[image:3.595.304.529.97.667.2]that the decrease in sugar particle size delays the dissolution of sugar during dough formation. Because Kissell et al. (1973) stated that during processing, sugar particles are coated with fat. As sugar particle
Figure 1. Effect of particle size of flour and sugar on the textural properties of cookie dough. (A) hardness, (B) adhesiveness, (C) springiness, and (D) cohesiveness
g fg
d
h
ef
b
de c
a
2 4 6 8
> 180 150–180 < 150 > 180 150–180 < 150 Sugar (µm)
c b
a
d
g f
ef e e
0 0.03 0.06 0.09
> 180 150–180 < 150
g f e
b d a c a c
0.2 0.4 0.6 0.8
> 180 150–180 < 150
b a
a
e f d e c e
0.2 0.4 0.6 0.8
> 180 150–180 < 150
H
ar
dne
ss (N
)
A
dhe
sivene
ss (N · s)
Spr
ing
ne
ss
Cohe
sivene
ss
Flour particle size (µm) (A)
(B)
(C)
size increases, less surface is available in the system, and surface area thus becomes an impressive factor in achieving dough viscosity and ultimate spread potential. Therefore, the fat layer surrounding the surface of the sugar particles may have affected the interaction between dough components.
Lower cohesiveness values indicate that the dough is crumblier or brittle. The development of the gluten network is largely responsible for the structure and cohesiveness of bakery products. However, gluten development is limited due to the high levels of sugar in cookie dough. Thus, the cohesiveness in cookie doughs does not depend only on gluten (Taylor et al. 2008). The cohesiveness values in the cookie dough decreased with the decrease in sugar particle size. Fur-thermore, the cohesiveness values of cookie dough increased with the decrease of flour particle size. According to the results obtained, it can be stated that the increase of durability of the cookie doughs is related to the decrease in flour particle size.
High flexibility is not a desirable situation when it comes to a cookie or biscuit dough. The springiness values of cookie dough increased with the decrease in sugar particle size. In other words, the flexibility of cookie dough has increased due to the increase in the sugar particle size. The lowest springiness values were obtained in the formulations containing sugar and flour fractions over 180 µm. The springiness values of cookie dough ranged from 0.402 to 0.676. The low-est springiness value (0.402) was determined in the formulation containing flour and sugar fractions over 180 µm, while the highest springiness value (0.676) was obtained in the formulation containing flour fractions below 150 µm and sugar fractions between 150–180 µm. The highest springiness values in the formulations containing flour were detected with the finer fractions. Similar observations were described by Hera et al. (2013) for gluten-free rice bread.
According to the results of forward extrusion (Fig-ure 2), the energy and force required for dough ex-trusion increased with the decrease in sugar particle size. This increase in energy stemming from the sugar particle size may be due to delay in the dissolution of smaller particle size sugars during the prepara-tion of the dough. On the other hand, the energy and force values of the cookie dough decreased with the decrease in the particle size of flour. The highest the energy and force values were determined in the formulation containing flour fractions over 180 µm.
Many structural, physicochemical and organolep-tic changes occur during baking of bakery products
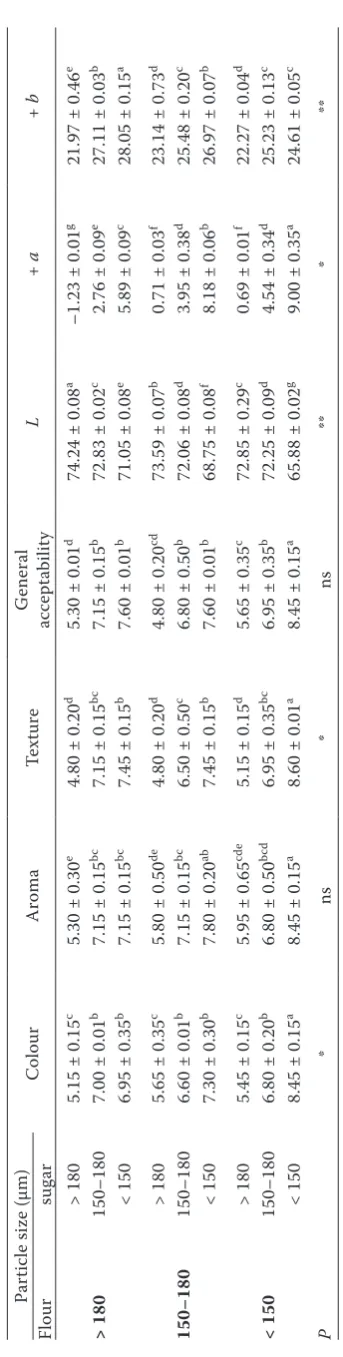
such as bread and cookie. All these changes during the baking are important for digestibility and sen-sorial acceptance by the consumers (Mohsen et al. 2009). The lowest scores for sensory parameters, colour, aroma, texture and general acceptability were obtained in the formulations containing flour and sugar fractions over 180 μm (Table 1). In terms of colour, aroma, texture and overall acceptability, the most favoured formulations were identified as the formulations containing flour and sugar fractions below 150 µm. These formulations received scores over 8 for all sensory parameters evaluated. A significant negative correlation between the particles size of sugar and the sensory parameters was also determined.
[image:4.595.305.531.92.405.2]With the reduction in the sugar particle size, the L colour values in the cookies were significantly af-fected and ranged from 74.24 to 65.88 (Table 1). The +a and +b colour values of the samples increased with the decrease in sugar particle size. The lowest +a and + b colour values were determined in the formulations containing flour and sugar fractions over 180 µm. As the sugar and flour particle sizes decreased, the colour of the cookies became darker, and the L colour values decreased. The L colour
Figure 2. Effect of particle size of flour and sugar on for-ward extrusion parameters of cookie dough. Foron for-ward extrusion force (A) and area (B)
a a a
e
c b
d c
b
40 60 80 100 120 140 160 180 200 220
> 180 150–180 150 > 180 150–180 < 150 Sugar (µm)
b a a
f d
c
f e
c
100 200 300 400 500 600 700 800 900 1000 1100
> 180 150–180 < 150
For
w
ar
d e
xtr
usion f
or
ce (N
)
For
w
ar
d e
xtr
usion ar
ea (N
·
s)
Flour particle size (µm) (A)
values of the cookie samples generally showed a de-crease due to the ina de-crease in the spread ratio. Due to the increase in spread ratio, the cookies may be more affected by the oven temperature. The results obtained in this study were similar to the study by Kissell et al. (1973).
The diameters of the samples were significantly affected by the decrease in the sugar particle size (P < 0.01) and the diameter of cookies increased (Figure 3). The largest diameter was found in the formulation containing sugar particle size below 150 µm. The dissolution of sugars in the formulation during baking has a high effect on the spread of cook-ies (Taylor et al. 2008). In formulations containing a smaller sugar particle size, the sugar may be dis-solved during cooking and may affect the spreading ratio of cookies. Kulp et al. (1991) suggested that because all of the sucrose is not dissolved during the preparation of cookie dough, sugar syrup is formed during baking, leading to an increased diameter. On the other hand, the results obtained in this study for the diameter values of cookies were not similar to the study by Kissell et al. (1973).
Amount and type of sugar used in the cookie for-mulation are important factors affecting the cookie thickness (Kissel et al. 1973; Santiago-García et al. 2017). The thickness values of the cookies decreased with the decrease in the particle size of flour. Similar observations were reported by Barak et al. (2014) who determined an increase in the thickness values of the cookies with the decrease in particle size of flour.
Spread ratio of cookies represents a ratio of diameter to height. Thus, sugar’s effects on the diameter (sugar dissolution) of cookie and height (inhibiting gluten development) of cookie are combined into a single parameter (Taylor et al. 2008). The spread ratio of the cookie samples increased with the decrease in particle sizes of flour and sugar (Figure 3). The highest spread ratio in the cookie samples was deter-mined in the formulations containing sugar particle size between 150–180 µm. The decrease in particle size of sugar increased the spread ratio of the cookie samples in the formulations containing flour frac-tions over 180 µm, while it decreased the spread ratio in the formulations containing flour fractions between of 150–180 µm and below 150 µm. Similar observations have been described by Yamazaki et al. (1959) flour particle size and by Lindley (1988) for sugar particle size.
Smaller flour particle sizes would be expected to contain a higher level of damaged starch than coarse
[image:5.595.77.249.94.774.2]Ta
ble 1. Eff
ec
t of p
ar
tic
le si
ze of flour and sug
ar on s
ens
or
y and c
olour pr
op
er
tie
s of c
ook ie s Par tic le si ze (µm) Colour Ar oma Text ur e G eneral ac ce pt ability L + a + b Flour sug ar > 180 > 180
5.15 ± 0.15
c
5.30 ± 0.30
e
4.80 ± 0.20
d
5.30 ± 0.01
d
74.24 ± 0.08
a
–1.23 ± 0.01
g
21.97 ± 0.46
e
150–180
7.00 ± 0.01
b
7.15 ± 0.15
bc
7.15 ± 0.15
bc
7.15 ± 0.15
b
72.83 ± 0.02
c
2.76 ± 0.09
e
27.11 ± 0.03
b
< 150
6.95 ± 0.35
b
7.15 ± 0.15
bc
7.45 ± 0.15
b
7.60 ± 0.01
b
71.05 ± 0.08
e
5.89 ± 0.09
c
28.05 ± 0.15
a
150–180
> 180
5.65 ± 0.35
c
5.80 ± 0.50
de
4.80 ± 0.20
d
4.80 ± 0.20
cd
73.59 ± 0.07
b
0.71 ± 0.03
f
23.14 ± 0.73
d
150–180
6.60 ± 0.01
b
7.15 ± 0.15
bc
6.50 ± 0.50
c
6.80 ± 0.50
b
72.06 ± 0.08
d
3.95 ± 0.38
d
25.48 ± 0.20
c
< 150
7.30 ± 0.30
b
7.80 ± 0.20
ab
7.45 ± 0.15
b
7.60 ± 0.01
b
68.75 ± 0.08
f
8.18 ± 0.06
b
26.97 ± 0.07
b
< 150
> 180
5.45 ± 0.15
c
5.95 ± 0.65
cd
e
5.15 ± 0.15
d
5.65 ± 0.35
c
72.85 ± 0.29
c
0.69 ± 0.01
f
22.27 ± 0.04
d
150–180
6.80 ± 0.20
b
6.80 ± 0.50
bcd
6.95 ± 0.35
bc
6.95 ± 0.35
b
72.25 ± 0.09
d
4.54 ± 0.34
d
25.23 ± 0.13
c
< 150
8.45 ± 0.15
a
8.45 ± 0.15
a
8.60 ± 0.01
a
8.45 ± 0.15
a
65.88 ± 0.02
g
9.00 ± 0.35
a
24.61 ± 0.05
c P * ns * ns ** * ** Value s ar e me
an ± s
d; diff
er
en
t le
tters in t
he same c
olumn ar e sig nific an tly diff er en t (* P
< 0.05; **
P
flours (Zucco et al. 2011). Spread ratio for cook-ies is directly related to a particle size of flour. The reason for this is that starch is damaged during par-ticle size reduction (Yamazaki 1959; Barak et al. 2014). The damaged starch content of flour affects both the spread ratio and specific volume values of the cookie. The specific volume values of the cookie samples generally increased with the decrease in sugar particle size at the three different flour fractions. The decrease in the size of the sugar particles also increased the specific volumes of the cookies, and this increase won the appreciation of the panelists.
[image:6.595.66.533.87.398.2]The three-point bending test results of the studied cookies are shown in Figure 4. According to the results obtained from the breaking test, while the hardness values of the cookie samples increased with the decrease in the particle size of sugar, they decreased with the decrease in the particle size of flour. Similar observa-tions have been described by Zucco et al. (2011) for pulse flour, Mcwatters et al. (2003) for cowpea flours and Sudha et al. (2007) for wheat and rice bran. Hard-ness values of the cookie samples ranged from 18.22 N to 26.48 N. Also, a positive correlation was determined between the hardness values and the diameter of the
Figure 3. Effect of particle size of flour and sugar on physical properties of cookies. (A) diameter (B), thickness (C) spread ratio, (D) specific volume
a
c
b
bc
d a
a bc
a
12 14 16 18 20
> 180 150–180 < 150
f e e
a
b
c
c cd d
2 3 4 5 6
> 180 150–180 < 150
d c d d
bc bc
b
a a
1 1.5 2 2.5 3
> 180 150–180 < 150
e e
d bc ab ab a c a
55 60 65 70 75
> 180 150–180 < 150 > 180 150–180 < 150 Sugar (µm)
Di
ame
ter (mm)
Thic
kne
ss (mm)
Spr
ead ra
tio
Sp
ec
ific volume (ml/g)
Flour particle size (µm) Flour particle size (µm)
d de de
a
b
c b
c
e
16 20 24 28 32
> 180 150–180 < 150 > 180 150–180 < 150 Sugar (µm)
bc bc
a
b bc
cd d
e
f
2 4 6 8
> 180 150–180 < 150
Figure 4. Effect of particle size of flour and sugar on textural properties of cookies. (A) hardness, (B) fracturability
Co
ok
ie har
dne
ss (N
)
Frac
tura
bility (mm)
Flour particle size (µm) Flour particle size (µm)
(A) (B)
(C) (D)
[image:6.595.66.534.599.750.2]cookie samples. As the diameter of the cookie samples increased, the hardness values also increased.
The fracturability of cookie represents the de-formation of a cookie sample until it breaks during compression. For this reason, greater fracturability values indicate higher flexibility (Hwang et al. 2016). The fracturability values of the cookie samples were higher in the formulations containing flour fraction below 150 µm than the other formulations. Also, it decreased with the decrease in the particle size of sugar in the formulations containing flour particle size below150 µm.
CONCLUSIONS
This study showed that the particle size of sugar and flour used in the cookie formulation significantly affects the characteristics of cookie dough and cookies. Cookie quality was positively affected with a decrease in the particle size of sugar and flour. It was observed that the effect of sugar particle size on cookie quality was more pronounced than flour particle size. Both the sugar particle size and the flour particle size in cookie dough affected the hardness, adhesiveness, cohesiveness, and springiness of the cookie doughs and this effect was statistically at a significant level (P < 0.01). While the energy and force values needed for the dough extrusion decreased with the decrease in sugar particle size, they also did not show any sig-nificant change with the decrease in flour particle size. As the particle sizes of flour and sugar decreased, the colour of the cookies became darker, and the L colour values decreased. It was observed that both flour and sugar particle size used in cookie production af-fects the appreciation of panelists. According to the results of the sensorial evaluation, the formulations containing sugar and flour fractions below 150 µm had the highest score from the panelists.
References
Barak S., Mudgil D., Khatkar B.S. (2014): Effect of flour par-ticle size and damaged starch on the quality of cookies. Journal of Food Science and Technology, 51: 1342–1348. Curley L.P., Hoseney R.C. (1984): Effect of corn sweeteners
on cookie quality. Cereal Chemistry, 61: 274–681. Elgün A., Ertugay Z., Certel M., Kotancilar H.G. (2002):
Guide Book for Analytical Quality Control and Labora-tory for Cereal and Cereal Products. Erzurum, Atatürk University: 245.
Guttieri M.J., Bowen D., Gannon D., O’Brien K., Souza E. (2001): Solvent retention capacities of irrigated soft white spring wheat flours. Crop Science, 41: 1054–1061. Hera E.D.L., Martinez M., Gómez M. (2013): Influence of
flour particle size on quality of gluten-free rice bread. LWT-Food Science and Technology, 54: 199–206. Hoseney R.C. (1994): Principles of Cereal Science and
Tech-nology. (2nd Ed.). St. Paul, AACC International: 197–211.
Hrušková M., Švec I. (2015): Cookie making potential of composite flour containing wheat, barley and hemp. Czech Journal of Food Sciences, 33: 545–555.
Hwang H-S., Singh M., Lee S. (2016): Properties of cookies made with natural wax-vegetable oil organogels. Journal of Food Science, 81: 1045–1054.
Jan R., Saxena D.C., Singh S. (2016): Physico-chemical, textural, sensory and antioxidant characteristics of glu-ten-free cookies made from raw and germinated
Cheno-podium (Chenopodium album) flour. LWT-Food Science
and Technology, 71: 281–287.
Kissel L.T., Marshall B.D., Yamazaki W.T. (1973): Effect of variability in sugar granulation on the evaluation of flour cookie quality. Cereal Chemistry, 50: 255–264.
Kulp K., Lorenz K., Stone M. (1991): Functionality of carbo-hydrate ingredients in bakery products. Food Technology, 45: 136–140.
Lindley M.G. (1988): Structured sugar systems. In: Blan-shard J.M.V., Mitchell R. (eds). Food Structure – Its Cre-ation and Evolution. London, Butterworths: 297–311. Maache-Rezzoug Z., Bouvier J.M., Allaf K., Patras C. (1998):
Effect of principal ingredients on rheological behaviour of biscuit dough and on quality of biscuits. Journal of Food Engineering, 35: 23–42.
McWatters K.H., Ouedraogo J.B., Resurreccion V.A., Hung Y.C., Phillips R.D. (2003): Physical and sensory charac-teristics of sugar cookies containing a mixture of
Fo-nio (Digitaria exilis) and Cowpea (Vigina unguiculata)
flours. International Journal of Food Science and Tech-nology, 38: 403–410.
Mohsen S.M., Fadel H.H.M., Bekhit M.A., Edris A.E., Ahmed Y.S. (2009): Effect of substitution of soy protein isolate on aroma volatiles, chemical composition and sensory quality of wheat cookies. International Journal of Food Science and Technology, 44: 1705–1712. Pareyt B., Goovaerts M., Broekaert W.F., Delcour J.A.
(2011): Arabinoxylan oligosaccharides as a potential su-crose replacer in sugar-snap cookies. LWT-Food Science and Technology, 44: 725–728.
Ronda F., Perez-Quirce S., Angioloni A., Collar C. (2013): Impact of viscous dietary fibres on the viscoelastic behav-iour of gluten-free formulated rice doughs: a fundamental and empirical rheological approach. Food Hydrocolloids, 32: 252–262.
Santiago-García P.A., Mellado-Mojica E., León-Martínez
F.M., López M.G. (2017): Evaluation of Agave angustifolia
fructans as fat replacer in the cookies manufacture. LWT-Food Science and Technology, 77: 100–109.
Shekara P., Kumar V.P., Hosamane G.G. (2011): Gravity flow operated small electricity generator retrofit kit to flour mill industry. Journal of Food Science and Technology, 50: 1006–1011.
Sudha M.L., Vetrimani R., Leelavathi K. (2007): Influence of fibre from different cereals on the rheological char-acteristics of wheat flour dough and on biscuit quality. Food Chemistry, 100: 1365–1370.
Švec I., Hrušková M., Babiaková B. (2017): Chia and teff as improvers of wheat-barley dough and cookies. Czech Journal of Food Sciences, 35: 79–88.
Taylor T.P., Fasina O., Bell L.N. (2008): Physical properties and consumer liking of cookies prepared by replacing su-crose with tagatose. Journal of Food Science, 73: 145–151. Yamazaki W.T. (1959): Flour granularity and cookie quality
II. Effects of changes in granularity on cookie character-istics. Cereal Chemistry, 36: 52–59.
Yousaf A.A., Ahmed A., Ahmad A., Hameed T., Randhawa M.A., Hayat I., Khalid N. (2013): Nutritional and func-tional evaluation of wheat flour cookies supplemented with gram flour. International Journal of Food Science and Nutrition, 64: 63–68.
Zoulias E.I., Pikins S., Oreopoulou V. (2000): Effect of sugar replacement by polyols and acesulfame-K on properties of low fat cookies. Journal of the Science of Food and Agriculture, 80: 2049–2056.
Zucco F., Borsuk Y., Arntfield S.D. (2011): Physical and nutritional evaluation of wheat cookies supplemented with pulse flours of different particle sizes. LWT-Food Science and Technology, 44: 2070–2076.