Abstract— This paper introduces an improved spectrogram to identify multiple harmonic sources (MHS) produced by inverter loads in power system using time-frequency distribution (TFD) analysis which is spectrogram with cost efficient of single-point measurement approach. The spectrogram is very applicable method to represent signals in time-frequency representation (TFR) and the main advantage of spectrogram is the accuracy, speed of the algorithm and use low memory size such that it can be computed rapidly. The identification of MHS is based on the significant relationship of spectral impedances which are fundamental impedance (Z1) and harmonic impedance (Zh) that been extracted from TFR. To verify the accuracy of the proposed method, MATLAB simulation are carried out for several unique cases with different harmonic producing loads. It is confirmed that the proposed method is superior with 100% correct identification of MHS. It is proven that the method is very accurate, fast and cost efficient to localize MHS in distribution system.
Keywords— multiple harmonic source identification, time-frequency distribution, spectrogram, spectral impedance
I. INTRODUCTION
resent day in modern power distribution system, a lot of harmonic producing loads consist of non-linear loads and electronically switched loads such as inverters, arc furnaces and so on, injected harmonic into system, which are lead to potential threat for standard performance of power system as per discussed in [1]–[3]. Thus, it is a crucial request to reduce or eliminate the harmonic pollution and the detection of multiple harmonic sources (MHS) is the first step towards enhancing the power quality of the system
Manuscript received Jan 10, 2017; revised Jan 11, 2017. This work was supported by Center for Robotics and Industrial Automation (CeRIA), Faculty of Electrical Engineering and Engineering Technology of Universiti Teknikal Malaysia Melaka (UTeM) Ministry of Higher Education Malaysia (MOHE) and funded by Ministry of Science, Technology and Innovation (MOSTI) under Grant 06-01-14-SF00119 L00025.
Abdul Rahim Abdullah is with CeRIA and Faculty of Engineering Technology, Universiti Teknikal Malaysia Melaka (phone: +606 555 2353; fax: +606 555 2222; email: abdulr.utem.edu.my)
Mohd Hatta Jopri is with CeRIA and Faculty of Engineering Technology, Universiti Teknikal Malaysia Melaka (phone: +606-2346528; fax: +606-2346526; email: [email protected])
Mustafa Manap is with CeRIA and Faculty of Engineering Technology, Universiti Teknikal Malaysia Melaka (e-mail: [email protected])
Mohd Rahimi Yusoff is also with CeRIA and Faculty of Engineering Technology, Universiti Teknikal Malaysia Melaka (e-mail: [email protected])
[4]-[5]. Meanwhile, in power distribution system, MHS can be found at utility side which known as upstream and downstream when MHS located at customer side with a respect to a measurement point of point of common coupling (PCC) [6]– [8].
Previously, diverse methodologies to localize MHS can be found in many kinds of literature. The earliest technique to localize the MHS is utilizing power direction technique, however, this method cannot give accurate results when some harmonics and phase angle beyond 90° [3], [9]. Moreover, a state estimation method is introduced with the implementation of least square and Kirchhoff current law [10]. However, a study [11], showed that state estimation technique requires numerous measurement devices and unreasonable setup cost for the large power system. Furthermore, the critical impedance (CI) technique also been discussed [12]–[14]. The major drawback of this technique is a pre-requirement of source internal impedances values of utility and customer side and in practical it is hard to obtain those parameters without switching test [15],[16]. In the previous studies [1], [17] MHS identification has been proposed utilizing harmonic state estimation (HSE) and Bayesian estimation. Anyhow, this technique requires a high multiplicity in the algorithm and very expensive cost to setup the distributed measurement system station [18]. In real time, accuracy, quick estimation and low cost are important and most of the previous studies do not take into account. Based on above discussion, the limitation of previous techniques can be overcome using spectrogram.
This paper proposes high accuracy, fast estimation and costs efficient of a new MHS identification method with single-point measurement [8] at the PCC by utilizing spectrogram. The spectrogram is a method to represent signals in time-frequency representation (TFR). Furthermore, signals information of the system areextracted from TFR in order to identify the system characteristic and a common harmonic producing load which is inverter will be used as loads in the system. From TFR, spectral impedances which are fundamental impedance, Z1 and harmonic impedance, Zh will be estimated and calculated accurately. Finally, utilizing the significant characteristic between Z1 and Zh, the identification of MHS location can be realized accurately.
An Improved Spectrogram to Identify Multiple
Harmonic Sources in Distribution System with
Inverter Loads
Abdul Rahim Abdullah, Mohd Hatta Jopri, Mustafa Manap, Mohd Rahimi Yusoff
II. METHODOLOGY
A. Spectrogram
Spectrogram is one of the technique in time frequency distribution (TFD) analysis and representing a distribution of energy of the signal in time-frequency. It is well defined in Equation1 and Equation 2 [1]-[2].
2 2
)
(
)
(
)
,
(
t
f
v
w
t
e
dt
S
v
j f
(1)2 2
)
(
)
(
)
,
(
t
f
i
w
t
e
dt
S
i j f
(2)Whereby, w(t) is observation windows. The Hanning window is selected with respect to IEC standard that characterized this window is suitable for analyzing harmonic [3], [4].
B. Principle of Proposed Methodology
The implementation for MHS identification can be realized as depicts in Figure 1 and Figure 2. There are four condition considered in the simulation with referring to the PCC as follows:
• No MHS within the distribution system.
• A downstream, when the MHS located at a customer side.
• Both stream, when the MHS located at utility and customer side. Whereby, this is the common scenario in practice.
• An upstream, when the MHS at the utility side.
The measurement data are analyzed by utilizing spectrogram and the signal parameters of power system are estimated from the time frequency representation (TFR). Finally, the MHS location will be identified based on the significant relationship between Z1 and Zh.
Figure 1: Case 1 Figure 2: IEEE 4 bus feeders for Case 2, 3 and 4
Whereby, N is non-harmonic producing load and H is harmonic producing load.
III. PRINCIPLE OF PROPOSED METHODOLOGY The accuracy and validity of this methodology are tested and verified on IEEE 4 bus feeders. Meanwhile, two types of three-phase inverter are used alternately as MHS which are an AC-DC-AC Pulse Width Modulation (PWM)
converter and two-level single bridge converter. Furthermore, the significant relationship of spectral impedances will be observed due to distinguish the location of MHS. The system modeling and spectrogram analysis of the system done by Matlab.
A.Case 1: No MHS within the System
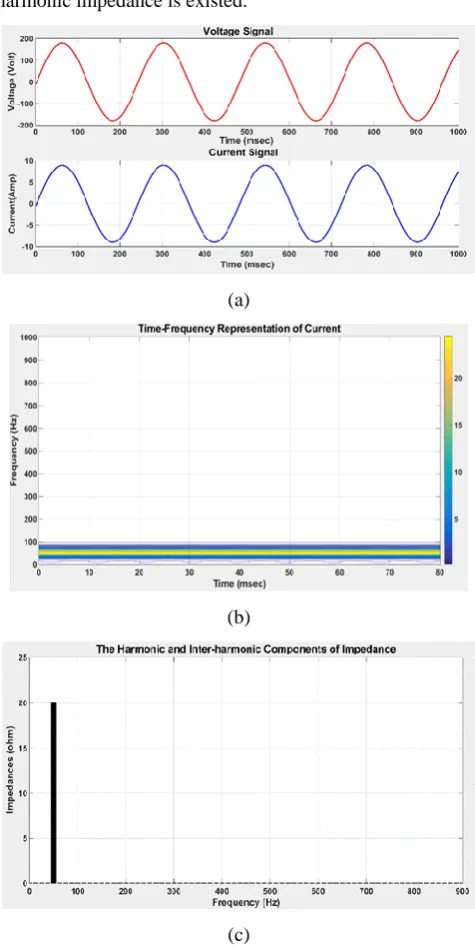
The data for this case was measured at PCC N-N as illustrated in Figure 1 and non-harmonic producing loads connected to the system. Figure 3(a) shows the voltage and current signal in time domain. Meanwhile, Figure 3(b) clearly shows that only fundamental frequency at 50Hz exists in the system. As can be seen from Figure 3(c), the Z1 is estimated from TFR at a value of 20 ohm and no harmonic impedance is existed.
(a)
(b)
[image:2.595.307.545.234.709.2](c)
Figure 3: No MHS. (a) Voltage and current Signal (b) TFR of current, (c) Harmonic and inter-harmonic components of spectral impedance.
[image:2.595.50.294.547.676.2]Zh= 0 ohm (3)
Z1 ≠ 0 ohm (4)
B.Case 2: MHS at Downstream
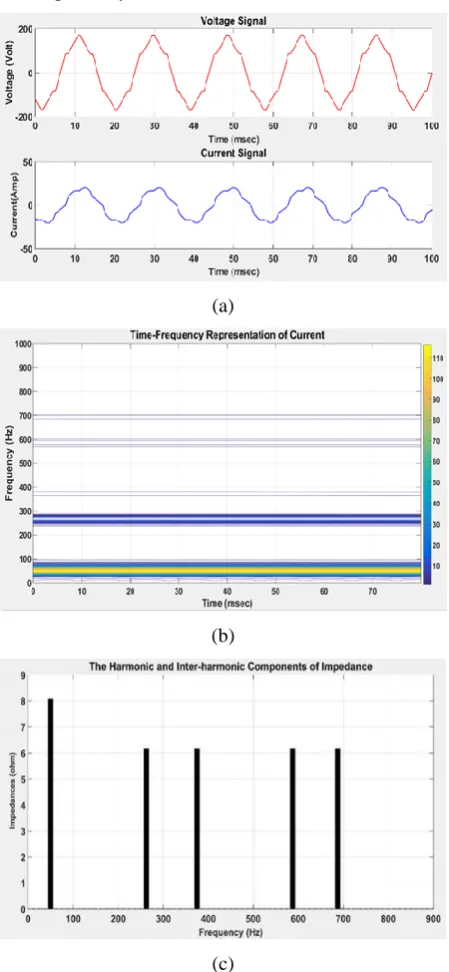
Case 2 was carried out due to find out the location of MHS when the harmonic producing load located at downstream and the measurement data were taken at PCC N-H. Figure 4(a) shows the harmonic signal in time domain when AC-DC-AC PWM converter was used as a MHS at downstream. Furthermore, the TFRs in Figure 4(b) shows the signals of five frequency components consist of the fundamental frequency (50Hz) and inter-harmonic components at 262.5Hz, 375Hz, 587.5Hz and 687.5Hz. Figure 4(c) presents the estimated impedances value of Z1 was 8 ohm and the average value of Zh was 6 ohm respectively.
(a)
(b)
[image:3.595.321.542.170.679.2](c)
Figure 4: Three-phase two-level single bridge converter as MHS at upstream. (a) Voltage and current signal, (b) TFR of current, (c) Harmonic and inter-harmonic components of spectral impedance.
The voltage and current signal as shown in Figure 5(a) was obtained when three-phase two-level single bridge converter was used as MHS at downstream. Figure 5(b) shows the signal parameter of fundamental and inter-harmonic of voltage and current that estimated from TFR. Components consist of fundamental frequency at 50Hz and inter-harmonic components at 262.5Hz, 375Hz and 587.5Hz. Furthermore, from Figure 5(c), it shows that the
Z1 is 11.3 ohm while the average value of Zh is 8.57 ohm respectively.
(a)
(b)
[image:3.595.61.286.251.738.2](c)
Figure 5: Three-phase two-level single bridge converter as MHS at upstream. (a) Voltage and current signal, (b) TFR of current, (c) Harmonic and inter-harmonic components of spectral impedance.
Z1 > Zh (5)
C. Case 3: MHS at Upstream and Downstream
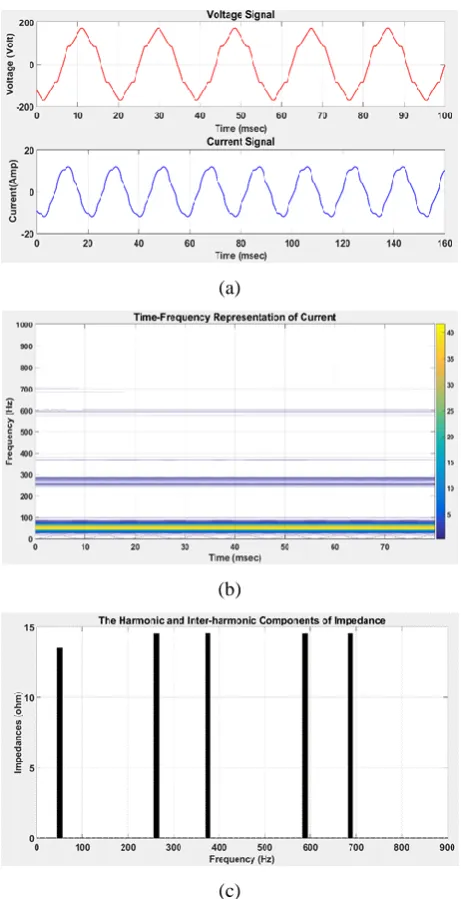
This case study aims to identify the location of MHS when both streams contain the MHS and the measurement of voltage and current were taken at PCC H-H. Current and voltage signals are shown in Fig. 6(a) when AC-DC-AC PWM converter acted as harmonic producing loads at upstream and downstream. As can be seen from Figure 6(b), the signals frequency components clearly seen from TFRs and consist of the fundamental frequency (50Hz) and inter-harmonic components at 262.5Hz, 375Hz, 587.5Hz, and 687.5Hz. As shown in Figure 6(c), the Z1 is 14 ohm and the average value of Zhis 14.8 ohm.
(a)
(b)
(c)
Figure 6: AC-DC-AC PWM converter as MHS at upstream and downstream. (a) Voltage and current signal, (b) TFR of current, (c) Harmonic and inter-harmonic components of spectral impedance.
Figure 7(a) shows the voltage and current signal in time domain when three-phase two-level single bridge converter acted as MHS at upstream and downstream. Figure 7(b) shows frequency components consist of the fundamental
frequency (50Hz) and inter-harmonic components at 262.5Hz, 375Hz and 587.5Hz. As shown in Figure 7(c), the
Z1 estimated at a value of 18 ohm and the average value of
Zh is 22 ohm.
(a)
(b)
(c)
Figure 7: Three-phase two-level single bridge converter as MHS at upstream and downstream. (a) Voltage and current signal, (b) TFR of current, (c) Harmonic and inter-harmonic components of spectral impedance.
Results from Figure 7(c) and Figure 8(c) clearly show that the magnitude of the Z1 is always lesser than the Zh. Thus, the significant relationship of spectral impedances for Case 4 can be written as:
Z1 < Zh (6)
D.Case 4: MHS at Upstream
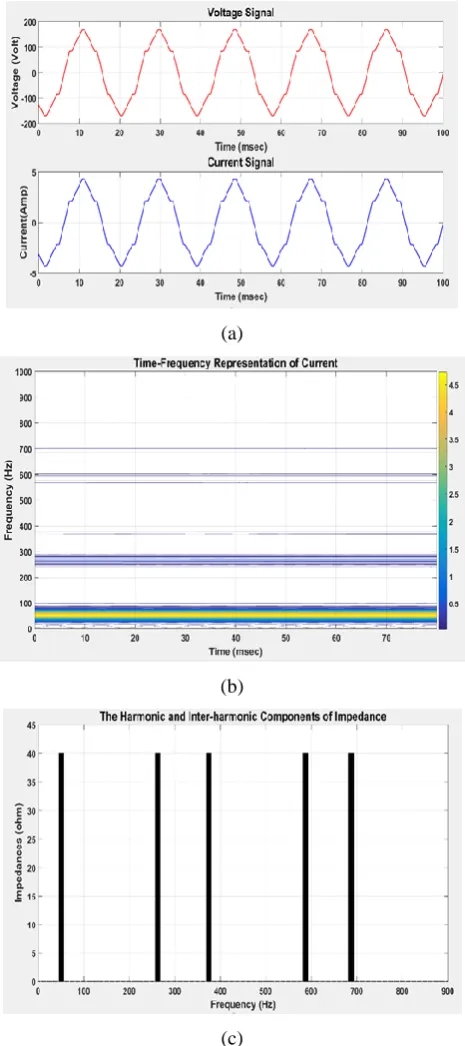
[image:4.595.312.546.103.547.2] [image:4.595.58.289.245.695.2]262.5Hz, 375Hz, 587.5Hz and 687.5Hz. The analysis of TFR as depicts in Figure 8(c) estimated the Z1 and Zh are equal with a value of 40 ohm.
(a)
(b)
(c)
Figure 8: AC-DC-AC PWM converter as MHS at downstream. (a) Voltage and current signal, (b) TFR of current, (c) Harmonic and inter-harmonic components of spectral impedance.
Three-phase two-level single bridge converter is alternately used as MHS in the system. The voltage and current signal at PCC H-N in time domain are shown in Figure 9(a). Meanwhile, the TFR in Figure 9(b) show the signals of frequency components consist of fundamental frequency at 50Hz and inter-harmonic components at 262.5Hz, 375Hz and 587.5Hz. As can be seen in Figure 9(c), the Z1 and Zh were estimated at 40 ohm, respectively.
(a)
(b)
(c)
Figure 9: Three-phase two-level single bridge converter as MHS at downstream. (a) Voltage and current signal, (c) TFR of current, (e) Harmonic and inter-harmonic components of spectral impedance.
It is apparent from the results of Figure 8(c) and Figure 9(c), the magnitude of the Z1 is always equal with Zh in Case 4. Therefore, the significant relationship of spectral impedances for Case 4 can be concluded as:
[image:5.595.314.545.95.620.2] [image:5.595.52.285.97.621.2]TABLE 1
CONCLUSION OF SPECTRAL IMPEDANCE CHARACTERISTIC FOR MHS DETECTION
Case Upstream Downstream Spectral Impedance
1 N N Zh= 0 ohm
2 N H Z1 > Zh
3 H H Z1 < Zh
4 H N Z1=Zh
Whereby, N is non-harmonic load, H is harmonic producing load, Z1 is
fundamental impedance and Zh is harmonic impedance.
IV. CONCLUSION
The main concern of this paper is to identify the location of MHS with a single-point measurement approach by utilizing spectrogram technique. This is another new solution for identifying the location of MHS in power systems by knowing the significant relationship of spectral impedance. Based on Table 1, the MHS in the power system can be identified clearly as follow:
If the Zh is 0 ohm, there is no MHS in the system. If the Z1 is greater than Zh, there is MHS at the
downstream.
If the Z1 is lower than Zh, there are MHS at upstream and downstream.
If the Z1 is equal to Zh, there is MHS at the upstream
ACKNOWLEDGMENT
This research is supported by Advanced Digital Signal Processing Laboratory (ADSP Lab). Special thanks also to the Center for Robotics and Industrial Automation (CeRIA), Faculty of Electrical Engineering and Engineering Technology of Universiti Teknikal Malaysia Melaka (UTeM), Center of Robotics and Industrial Automation (CERIA) of UTeM, Ministry of Higher Education Malaysia (MOHE). The authors also gratefully acknowledge financial support from Ministry of Science, Technology and Innovation Malaysia (MOSTI) with a grant number of 06-01-14-SF00119 L00025.
REFERENCES
[1] G. D’Antona, C. Muscas, and S. Sulis, “Localization of Nonlinear Loads in Electric Systems Through Harmonic Source Estimation,” IEEE Trans. Instrum. Meas., vol. 60, no. 10, pp. 3423–3430, Oct. 2011.
[2] M. Farhoodnea, A. Mohamed, and H. Shareef, “A single point measurement method for evaluating harmonic contributions of utility and customer in power distribution systems,” Journal of Applied Sciences, vol. 11, no. 2. pp. 257–265, 2011.
[3] Z. Yin, Y. Sun, and T. Yu, “New methods exploration for harmonic source identification technologies,” DRPT 2011 - 2011 4th Int. Conf. Electr. Util. Deregul. Restruct. Power Technol., pp. 399–402, 2011. [4] S. Nath, P. Sinha, and S. K. Goswami, “A wavelet based novel
method for the detection of harmonic sources in power systems,” Int. J. Electr. Power Energy Syst., vol. 40, no. 1, pp. 54–61, Sep. 2012. [5] M. Farhoodnea, A. Mohamed, H. Shareef, and H. Zayandehroodi,
“An enhanced method for contribution assessment of utility and
distribution systems,” Int. J. Electr. Power Energy Syst., vol. 43, no. 1, pp. 222–229, 2012.
[6] A. Banshwar and A. K. Chandel, “Identification of harmonic sources using fuzzy logic,” in 2010 Joint International Conference on Power Electronics, Drives and Energy Systems & 2010 Power India, 2010, pp. 1–7.
[7] Y. Liu, H. Gong, X.-Y. Xiao, and H. Yang, “Harmonic Source Location at the Point of Common Coupling Based on the Nonlinearity Index of Load,” in 2009 Asia-Pacific Power and Energy Engineering Conference, 2009, pp. 1–5.
[8] A. R. Abdullah, G. Z. Peng and S. A. Ghani, “A new vector draft method for harmonic source detection at point of common coupling,” Proc. 2014 IEEE 8th Int. Power Eng. Optim. Conf. PEOCO 2014, no. March, pp. 110–114, 2014.
[9] M. Moradloo, M. A. Tabrizi, and H. R. Karshenas, “A new method for identification of main harmonic source based on the superposition and critical impedance methods,” in 2008 40th North American Power Symposium, 2008, pp. 1–6.
[10] G. D’Antona, C. Muscas, and S. Sulis, “State estimation for the localization of harmonic sources in electric distribution systems,” IEEE Trans. Instrum. Meas., vol. 58, no. 5, pp. 1462–1470, 2009. [11] J. E. Farach, W. M. Grady, and A. Arapostathis, “An optimal
procedure for placing sensors and estimating the locations of harmonic sources in power systems,” IEEE Trans. Power Deliv., vol. 8, no. 3, pp. 1303–1310, Jul. 1993.
[12] D. Srinivasan, W. S. Ng, and A. C. Liew, “Neural-Network-Based Signature Recognition for Harmonic Source Identification,” IEEE Trans. Power Deliv., vol. 21, no. 1, pp. 398–405, Jan. 2006. [13] N. Hamzah, A. Mohamed, and A. Hussain, “Identification of
Harmonic Source at the Point of Common Coupling Based on Voltage Indices,” J. Teknol., vol. 43, no. 1, pp. 11–32, Dec. 2005. [14] N. A. Abidullah, G. Z. Peng, and A. R. Abdullah, “A new two points
method for identify dominant harmonic disturbance using frequency and phase spectrogram,” Int. Rev. Electr. Eng., vol. 9, no. 2, pp. 453– 459, 2014.
[15] Y. R. Sood and R. K. Jarial, “Identification of Harmonic Sources in Deregulated Power Sector Identification of Harmonic Sources in Deregulated Power,” vol. 3, no. March, pp. 2435–2442, 2011. [16] B. Blazic, T. Pfajfar, and I. Papic, “A modified harmonic current
vector method for harmonic contribution determination,” IEE PES Power Syst. Conf. Expo., pp. 1049–1054, 2004.
[17] G. D’Antona, C. Muscas, P. A. Pegoraro, and S. Sulis, “Harmonic source estimation in distribution systems,” Appl. Meas. Power Syst. (AMPS), 2010 IEEE Int. Work., vol. 60, no. 10, pp. 1–5, 2010. [18] N. H. H. A. A. R. Abdullah, N. A. Abidullah and N. H. Shamsudin,