Abstract— Quick response to the urgent need of relief after disasters is critical issues for emergency logistics distribution. The urgent relief distribution is a vital operation to the alleviation of disaster impact in the affected areas. This study will concentrate on how to distribute relief material effectively and fairly which means that satisfied the demands and minimizing the cost of transportation. We consider the case of earthquake disaster occurred in Taiwan on September 1999. The problem was modeled and simulated using Arena Rockwell Software. We compared numerical result with obtained by the existing strategy.
Index Terms— Earthquake, Relief distribution, Modeling, Simulation
I. INTRODUCTION
LTHOUGH minor earthquake occur nearly every day, the effects of a strong earthquake are devastating [9]. In the history, earthquake occurred in China killed 830.000 people in 1556. Recent fatal earthquake occur again and took place in Taiwan (termed as the 921 Chichi earthquakes) in 1999 and killed 2455 in total, more than 8000 injuries, with 3895 homes destroyed [7]. After that similar earthquakes happened again such as in India in January 2001, Southeastern Iran in December 2003, Indonesia in December 2004, Pakistan in October 2005, Haiti in 2010, Tokyo Japan in 2011, Negros Oriental Philiphines in 2012 and recently the earthquake killed more than 8,600 in Nepal. Emergency logistic is different from general business logistic; it is different in four aspects that may increase the relative complexity and difficulty in solving the induced relief logistics problems, particularly in terms of emergency logistics distribution. First, demand-related information, for example, the severity of the disaster, the size of the disaster area and the effects on victims are limited to the beginning period of search and rescue, and cannot predicted intuitively by using historical data. Second, logistics resource may not be fully controlled for decision makers, adding more challenging problems for rapid emergency response in logistic distribution system. Third, the infrastructure damaged by disaster may lead unexpected risk to distribute the aid, and coupled by the issues lead to the restructuring of
Manuscript received July 7th, 2017; revised August 16, 2017. This work was supported by the project “Utique” entitled “Étude Et Développement D’un Système Spatio-Temporel Pour La Gestion Des Secours Médicaux d’Urgence (RESCUESYS)”
T..Ferdinand-Lionardo, University of Indonisia, Indonisia (corresponding author), e-mail: [email protected]).
I. Nouaouri, Université Lille Nord de France, Université d’Artois, LGI2A EA3926, Béthune, France, e-mail: [email protected]
emergency logistics network, and must be completed within a limited time frame. Four, regarding the global relief supply for large-scale natural disasters such as tsunami tremendous victims from Southeast Asia, which generated international support and logistical problems of resources management, can make the entire logistics emergency system more complicated, causing more serious problems of supply-demand imbalance in the process of emergency logistics distribution.
The characteristics of relief distribution systems consist of: material items, cost of materials, number of vehicles, modes of transportation, number of depots, demand of materials, transportations networks, vehicle capacity, travel time, and various operational modes. The objective is to find a combination of those variables that minimizes total traveling time and the number of vehicles, maximizes capacity service, and minimizes cost that consist of fixed and variable cost. In relief distribution system there is general physical distribution systems that also consist of three separate parts: demand, supply and transportations. The collection points in non-devastated area play the role of supply, while demand point is the affected areas by disasters where relief is provided to victims who play role as customers. In additions, large-scale commodities distribution depots near the demand point or affected areas play the role of distribution centers. The only difference between general distribution system and relief distribution system that the distribution depots are temporary storage points instead of permanent distribution warehouse. Moreover, operators for relief distribution are often from government agents and non-profit organizations that emphasize efficiency and fairness.
In this paper, we based on the real case study presented on [11]. The case study consists on earthquake disaster occurred in Taiwan on September 1999. It caused 2455 death in total, more than 8000 injuries, with 38,935 homes destroyed [7]. The affected areas are located in Taichung and Nantou Counties, central Taiwan. There are 24 most severely affected areas (in terms of dead casualties) of Taichung. To centralize the actions of rescue and relief distribution to the affected areas, there are three tentative refugee centers (terms as relief distribution center 1, 2 and 3) to collect and supply relief. Mean while the support of rescue and relief supply comes from 6 unaffected counties. Due to lack of coordination between the refugee center (distribution center) and relief supply sources as well as the overestimation of relief demand from affected areas, there will make relief supply-demand imbalances problems. The paper is organized as follows: Section 2 presents
A Simulation Study of Emergency Logistic in
Case of Disaster
T. Ferdinand-Lionardo, and I. Nouaouri
some related works. Section 3 describes the problem. Section 4 exposes the experimental results of simulation. Section 5 includes some concluding remarks.
II. SOME RELATED WORKS
Despite the importance of works related to business logistics and supply chain management, only limited amount of related research to emergency logistics distribution has been carried out. The significance of issues on relief supply to areas suffering from disaster and the resulting logistic problems had been presented [1] [13] [15]. A number of researches tended to formulate the resulting relief transportation issues as multi-commodity, multi modal flow problems with time windows [12] [17]. Fuzzy set method has become an active research area in risk analysis and management for flood disaster [19] due its successful application on complex engneering optimization model.
[5] developed a sophisticated real-time decision support system using optimization approach simulation techniques as well as decision maker’s judgment for both relief resources allocation and assignment following a disaster. Considering a multi commodity supply problems under emergency conditions three linear programming formulation are proposed in [17] where the routes and the supply amount carried on each route are assumed to be known in each of given origin-destination (O-D) pairs. [12] proposed time-spaced network formulated the large-scale disaster relief transportation problem as a commodity and multi-modal network flow model with a single objective function. In their conceptual model, the time-varying status of commodities and vehicles moving in a transportation network is represented by three types of links: routing, transfer, and supply/demand carry-over links, to facilitate the analysis of the resulting complicated network flow problem. In [8] a dynamic combinatorial optimization model is proposed to find the optimal resource rescue schedule with the goal of minimizing the total number of fatalities during the search and rescue (SAR) period, which refers to the first few days after the disaster.
Considering the complexity and difficulty in solving the emergency logistics distribution problem with a single model, there is a research trend of decomposing the original problem into given mutually correlated sub-problems, then solve them systematically in the same decision scheme. For instance, a bi-level hierarchical decomposition approach is proposed in [2] for helicopter mission planning during a disaster relief operation. Another case studied by [16] is unique in incorporating the vehicle routing problem into the relief distribution process, in which vehicles are treated as commodities to facilitate decomposing the comprehensive emergency logistics distribution problem into two multi-commodity network sub-problems, and then solved using Lagrangean relaxation.
[11] presents a hybrid fuzzy clustering-optimization approach to the operation of emergency logistics responding to the urgent relief demands based on real earthquake disaster occurred in Taiwan on September 1999. The author proposes three-layer emergency logistics co-distribution that involve two recursive mechanisms: (1) disaster-affected area clustering, and (2) relief co-distribution.
Although the emergency logistics distribution problem considered is related to vehicle routing problems (VRP) which have been extensively investigated in previous literature, the nature of the problem of a comprehensive emergency logistics distribution system can be more complicated, and needs to further include the pre-route operational tasks, such as relief demand forecasting and collection as well as efficient relief resource allocation to affected areas. In addition, the typical vehicle routing maneuvers, involving the requirement of vehicle dispatching and returning to the same depot, do not necessarily hold in the emergency logistics context. However, it is maintained in [16] that in some emergency logistics operational cases, any given node receiving relief commodities can be the new depot or the former depot may no longer supply relief, and thus vehicles may stay at their last stop, until the next distribution mission is identified. Surveys and discussions on the existing VRP approaches and their extensions can be readily found in the previous literature [3] [4] [6] [10] [14] [18], and many more that support this paper.
Our work in this paper concentrates on how to distribute relief material effectively and fairly during the crucial rescue period after natural disaster by using modeling and simulation. The following are the important steps taken during the rescue within the first three days after the disaster.
III. PROBLEM DESCRIPTION
A. Relief Logistic Network
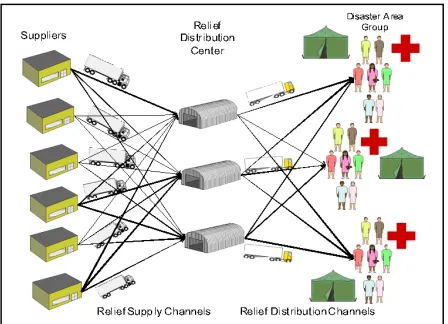
In case of disaster, the victims need to be provided with food, medicine, water, tents, hygiene products and other relief goods. However, due to disaster, the infrastructure in the affected region can be destroying to a large extent. Therefore, transportation system including intermediate depots has to be establishing in order to be able to transport the relief goods from suppliers to disaster victims. In the case of Chichi earthquake suppliers come from another local region out from the disaster area which is the resources of the relief. Thereafter, we have to transport those materials to Relief Distribution Center. The recipients at Relief Distribution Center could be a Governments or Relief Agency. Thus, the transportation has to establish to deliver materials to demand point or affected areas.
Fig. 1. Relief Supply Network
The next step is to transfer the relief material right after arriving in the distribution center to affected area casualty and damaged caused by disaster. Data may need used for relief demand forecasting and area grouping; it may facilitate to deliver a numbers of needed relief materials related to the demand of disaster area. [7] reported the official statistic of casualty and the number of damaged data in the 921 earthquakes. Aggregate statistic in terms of disaster effects as well as the corresponding population data associated with the affected areas of the study site. Population is the number of people whose living at that area. Helpless people means that a part of population would need more extra attention related to their health, for example they need supply of meal box/pack (food, medicine, vitamins, etc) that cover their health. The casualty means that building damage condition caused by disaster, it is stated by the degree of damage. The effect of that casualty, population needs support of a camp for a temporary shelter because their homes are damage by the earthquake until the reconstruction. The statistic of disaster effects and population of the affected area is shown in [11]
B. Strategic Level
[7] reported that the earthquake and its aftershock caused 2455 death in total; more than 8000 injuries with 38.935 homes destroy. The affected areas, Taichung and Nantou County are located in central Taiwan. Here, this study aimed at 24 areas most severely affected (in terms of death people or victims) by disaster in the city of Taichung. To centralize the action of rescue and distribute humanitarian relief to the affected areas, three temporary refugees center (can be mentioned as relief distribution centers 1, 2, and 3) to collect and supply relief which was establish in three towns (Dongshih, Shinkang and Wufong) in Taichung Country. The support of trapped victims in the collapsed building rescue and relief supply from 6 unaffected counties including Taipei, Taoyuan, Hsinchiu, Changhua, Tainan, and Kaohsiung (termed as supply sources 1 to 6), was requested immediately by the corresponding refuge centers. Based on the background of the problems mentioned above, a simplified 6 x 3 x 24 relief supply network is formed [11], where the geographical relationship among these relief demand and supply units are specified.
However, due to the lack of coordination between the refuge center and source of relief demand from affected areas, pose a serious problem for relief supply became imbalance. In addition, the allocation of relief distribution resources such as vehicles and volunteers, and the corresponding vehicle dispatching strategies implemented as these relief distribution centers become disordered, resulting in significant delay in transporting relief to certain affected areas.
Therefore, this phase aims to transport the optimal relief supply amounts efficiently in multiply relief supply channels (from multiple relief suppliers to multiple relief distribution centers). Differing from the previous relief distribution phase which serve to distribute various or mixed type of relief in each given relief distribution channel (pair of relief distribution center and affected area), and the phase of relief supply aims to transport homogenous supplied relief in each relief supply channel with the goal of minimizing the transportation cost.
Location of warehouse (Relief Distribution Center)
As aforementioned, the relief distribution center had defined in three tentative areas (Dongshi, Shingkang and Wufan) right inside the Nantou County that affected by disaster. Each relief distribution center which predetermined has storage capacity with respect to a given type of relief. The placement of three warehouses had defined because they are close to the disaster area in order to short access to serve delivery of humanitarian aid to disaster areas. In order to minimize the cost of transportation, distance from warehouse to disaster area has an important role to be defined related to the flow of materials to serve the demand area as fast as they could do. The distance from distribution center located in Dongshi is 5, 81 km from distribution center located in Shinkang. But, the longest distribution center is located in Wufong, they took 45,31 km from Dongshi and 43,13 km from Shinkang. The problem is all distribution center has to serve 24 disaster area that has been grouped before that is closed to each distribution center. Disaster area group 1 which is consisting of area 1 – 7 are close to Dongshi distribution center. Disaster group area 2 which is consist of area 8 – 15 are close to distribution center located in Shinkang and Disaster group area 3 which is consist of area 16 -24 are close to distribution center located in Wufong.
Definition the number and storage capacity of relief distribution
The capacity storage of relief distribution center is different among the three of relief distribution center. Each of them has a different capacity to accommodate the type of relief from different suppliers. The capacity of different distribution center related to storage of different relief materials is shown in [11].
Based on capacity storage of each relief distribution center, this study propose on how to optimize relief distribution with given data which is more than capacity storage of each relief distribution center to disaster areas effectively and equitably, thus, all demand points related to relief aid distribution may properly fulfilled.
distribution center. But, since the capacity of the relief distribution center as known above in m3 and volume of relief in cm3, we equate the volume of relief materials in to the same denomination with relief capacity storage.
Beside the capacity storage of Relief Distribution Center we have also the capacity of vehicle that transports all relief materials to Relief Distribution Center. The capacity of vehicle loading equals with 12 m3. Than we can deduce that
vehicle capacity may contain of a mixed relief materials type such as below.
TABLEI
The equation of Relief type in Vehicle loading capacity
Equation Water Meal box Sleeping bag Camp
3 m3 750 1000 50 7
6 m3 1500 2000 100 14
9 m3 2250 3000 150 21
12 m3 3000 4000 200 28
C. Operational Level
Prior to the relief humanitarian operation is executed the first thing to defined is the ability of the transportation and availability the personnel to drive the vehicle to the set of destination place. The driver is a significant thing should be hired when the catastrophe happens. Driving in a long distance and going back and forth is impossible done by certain people that have not trained before to face the situation and limited personnel. Therefore, employing the right people can facilitate the work. Scheduling time determined to distribute the relief humanitarian related to the transportation and drivers. Distance also could be more considerate to find efficiently the fleet of vehicles. Path defined to get the shortest route, thus, after first sending the humanitarian relief to distribution center, the vehicles return to the point of departure and resent another order. Apart from all this, the need of fuel for vehicle should keep in mind of no less important. Typically, when disaster happened the consumption of fuel for domestic use or industrial will increase. Therefore, planning system for relief humanitarian operational has to establish before the action in order to have a good task.
This operational phase aims to transports numbers of relief materials from suppliers to distribution center, there after transports the relief materials from relief distribution center to disaster/affected areas. The objective of this phase is how to minimize the transportation cost related to the number of relief type materials and number of relief distribution, meanwhile simultaneously minimize the time of transfer materials. Due to the cost of transportation, each relief type has a different cost of transport to a different destination (relief distribution center). Corresponding to relief type there is also cost set-up of each given relief type that added in the transportation cost. This cost setup divided in two bases on the suppliers’ location. Cost setup 1 related to suppliers n = 1,2 and 3 and Cost setup 2 related to supplier n = 4,5 and 6. Considering to the cost setup and cost transportation the of this study is to minimize the cost transport related to given relief materials from the suppliers
to distribution center and from distribution center to disaster areas. As Shown in [11], the cost setup and cost transport correlate to the type of relief and supplier. Also, the cost of transportation related to each type of relief materials for each destination (relief distribution center), are presented in [11].
IV. MODELING AND SIMULATION
In this study, to find the objective result we use ARENATM Rockwell Software Basic Edition as a solver of the problems show in this paper. This software can makes simple way to build the model and simulation of the work. Arena Rockwell Software is most effective when analyzing business, service, or simple (nonmaterial-handling intensive) manufacturing processes or flows.
This numerical result in the study case show the number of relief materials from suppliers 1,2,3,4,5, and 6 delivered to a given distribution area 1,2, and 3.
We show the example of Taipei and Taoyuan counties, and the supplier 1.
TABLEII
Number of relief materials to distribution center Taipei Taipei DC1 DC2 DC3
Water 16769 16432 16799
Meal box 2278 1465 2257
S. bag 1164 737 1099
Camp 162 131 207
TABLEIII
Number of relief materials to distribution center Taoyuan
Taoyuan DC1 DC2 DC3
Water 10024 9904 10072
Meal box 1551 936 1513
S. bag 777 456 767
Camp 110 82 108
TABLEIV
Summary of transportation cost from supplier to distribution center Taipei
Taipei DC1 DC2 DC3
Water 30184 27934 30238
Meal box 3417 2197,5 3611,2
S. bag 11640 7370 12089
Camp 5346 4061 6624
TABLEV
Summary of transportation cost from supplier to distribution center Taoyuan
Taoyuan DC1 DC2 DC3
Water 17041 15846 17122,4
Meal box 2016,3 1216,8 2118,2
S. bag 6993 3648 6903
Camp 3410 2560 3348
After aforementioned in distribution relief materials to disaster areas, the urgent relief supply and distribution operations were implemented following the optimal solutions determined by the models embedded in this phase. To quantitatively assess the efficiency of the method, particularly in quickly responding to relief demand in the affected areas and coordinating multiple relief supply sources in diverse disaster severity, criteria are proposed.
(1) AT, which represent the average time difference between successive relief arrivals to a given affected areas in a day.
(2) TC, represent the total emergency logistic cost including the corresponding increase in inventory costs at relief distribution center in three day period.
(3) CT, represent the computing times in the test scenario using the system
In addition, to evaluate the relative performance of the present method, this study compared numerical result with obtained under the condition that all relief distribution center and supply sources resulting in the references articles. As can see in the table below, the aggregate relative improvement in the system performance result mainly from the time saving in continuously distributing relief to the affected areas during the crucial rescue period. In the study case the average time headway of relief supply to a given affected areas is 6,5 which is improved significantly by 13,33%, upon employing the proposed method. Such a numerical result is meaningful particularly for the application in emergency logistic management. It should be noted that differing from general business logistics and supply chain management, the efficiency of relief supply to affected areas determines not only the operational performance of emergency logistics system in the supply side but also the survival of trapped people in the affected areas. From physical point of view, shortening the time headway of the supplied relief arrivals to affected areas may create the image of governmental attempt in rescue and also firm up the will power of trapped people therefore the government can stabilizing the disaster effects.
The coordination between the layers of relief supply and demand through the relief distribution center is vital in relief logistics control. As mentioned previously, the problem of relief demand imbalance is a common critical issues existing in emergency logistic management. However, through the integration of relief demand forecast and demand drive pull base relief supply strategies the aggregate emergency cost cannot reduce during three days rescue period. Due to emergency logistics distribution to relief demand areas at the time of disaster occurred, minimizing the cost of relief distribution to disaster areas is not become a priority rather than time arrivals of relief distribution it self.
TABLEVI
Comparison of system performance in three days period
Criteria strategy AT (h) TC (US$) Averages (h) CT
The existing strategy 7.5 2.3 -
The study case 6.5 3.6 0,4508
Average improvement (%) 13.33 - 1.3 -
In addition, the number of vehicles available at each supplier and at each distribution center appears to be critical factor in determining the system performance of the relief distribution. As observed from the result of experimental scenario, the reduction the number of vehicles associated with each supplier and each distribution center has caused significant negative effect on the entire system performance, particularly in both the average time headway of relief arrivals to a given affected areas (AT) and (TC) in system performance on the program to find better time headway comparing to the existing head time. This may infer that the sufficient number of vehicles serving relief distribution to affected areas. In this study, the number of vehicles was set as 12. In the experimental scenario, reducing the number of vehicle can make time performance is longer than existing strategy. Thus, determined number of vehicle can improve serving performance to quick response in emergency logistic distribution
V. CONCLUSION
areas in a relief supply network. For future work we will use heuristics combined with simulation to solve the problem. Another future work is to include the operational level (example: vehicle routing problem) with the tactical and strategic levels proposed in this paper.
REFERENCES
[1] Ardekani, S. A., & Hobeika, A. (1988). Logistic Problem in the aftermath of the 1985 Mexico City erthquake. Transportation Quarterly 42 , 107-124.
[2] Barbarosoglu, G., Ozdamar, G., & Ahmet, C. (2002). An iterative approach for hierarchical analysis of helicopter logistic in disaster relief operations. European Journal of Operations Research 140 , 118-133.
[3] Bertsimas, D., Chervi, P., & Peterson, M. (1995). Computational approach to stachasitic vehicle routing problems. Transportation Science 29 , 342-352.
[4] Bramel, J., & Simchi-Levi, D. (1999). The capacitated VRP with unequal demands. Dalam
[5] Brown, G., & Vassiliou, A. (1993). Optimizing disaster relief : real-time operational and tactical decision support. Naval Research Logistic 40 , 1-23.
[6] Dror, M., Laporte, G., & Trudeau, P. (1989). Vehicle routing with stochastic demands: properties and solution frameworks . Transportation Science 23 , 166-176.
[7] Executive, Y. (1999). The 921 earthquake special report : casualty and damage. Taiwan.
[8] Fiedrich, F., Gehbauer, F., & Rickers, U. (2000). Optimized resource allocation for emergency response after earthquake disaster. Safety Science 25 , 41-57.
[9] Gwo-Hshiung T.. Huang J-J. (2013), Fuzzy Multiple Objective Decision Making, CRC Press
[10] Fisher, M. (1995). Vehicle Routing. Dalam M. Ball, Hand book in OR and MS, vol. 8. Amsterdam: Elsevier Science.
[11] Jiuh-Biing, S. (2005). An emergency logistics distribution approach for quick response to urgent relief demand in disasters, Transportation Research Part E, 43 (2007) 687–709.
[12] Haghani, A., & Oh, S. (1996 ). Formulation and solution of multi-commodity, multi modal network flow model for disaster relief operation . Transportation Research Part A 30 (3) , 231-250. [13] Kembel, D. C., & Stephenson, R. (1984 ). Lesson in logistic from
Somalia . Disaster 8 (1) , 57-66.
[14] Laporte, G. (1992). The vehicle routing problem : an overview of exact and approximate algorithms . European Journal of Operation Research 59 , 345-358 .
[15] Long, D. C., & Wood, D. F. (1995). The logistics of famine relief . Journal of Business Logistic 16 (1) , 213-229.
[16] Ozdarmar, L., Ekinci, D., & Kucukyazici, B. (2004). Emergency logistic planning in Natural Disaster. Annals of Operations Research 129 , 217-245.
[17] Rathi, A. K., Church, R. L., & Solanki, R. S. (1992). Allocating resources to support multicommodity flow with time window. Logistics and Transportation Review 28 (2) , 167-188.
[18] Solomon, M. M., & Desrosiers, J. (1988). Time window constrained routing and scheduling problems:a survey. Transportation Science 22 , 1-13.