IRISH METEOROLOGICAL SERVICE
FINAL REPORT
CONTRACT
No.
ESF - 019 - EIR (N)
BETWEEN
EEC AND S. McWilliams
PROJECT F- SOLAR RADIATION DATA
ME1648
1
-EC SOLAR ENERGY R&D PROGRNN.IE
PROJ ECT F - SOLAR RAO I A TI ON DATA
INVESTIGATION OF THE ACCURACY OF SHADING RING CORRECTIONS APPLIED IN
THE MEASUREMENT OF DIFFUSE SOLAR RADIATION
Author
Controct number
Duration
Total budget
Head of project
Contractor
Address
S. McWillioms
ESF-OI9-EIR(N)
24 months 1st Jonuary 1981 - 31st December 1982
IR£II,450 CEC contribution IR£5,725
S. McWilliams
S. McWilliams
c/o Valentia Observatory,
Cahirciveen, Co. Kerry,
Irelond.
FINAL REPORT
r
,
! •
---2
-SUI,VAARY
The Diffuse Sky Radiation as measured with a pyranometer and shading ring must be corrected to compensate for sky radiation cut aff by the ring. This correction is generally computed an the basis af the geametric area af the sky cut off and assuming isotropic sky.
This assumptian results in values of DR which differ from the true value D by a factor "k" = D
ID
R
.
The fre§uency distribution of k for the 2-year periad'was:
k = frequency % =
D.9 1. 58
1.0 51.45
1.1 32.56
1.2 12.30
1.3 1. 84
1.4 0.22
1.5 0.05
There was no significant dependence of k on Solar Elevation and only a very slight dependence on Solar Declination (d).
The most significant variations of k are associated with DR/G and the fallowing equation was found to fit the dota.closely:
k
=
1.1578 - O. 1548(OR/G)3 - 0.000143dWhen the observed data are adjusted by applying the factor k as derived from this formula 83.47% of the data ore brought within! 5% of the
+
3
-INVESTIGATION OF THE ACCURACY OF SHADING RItJG CORRECTIONS APPLIED ItJ THE I.IEASUREI.IENT OF DIFFUSE SOLAR RADIATION
1. Project description
1.1. Introduction
The measurement of Diffuse Sky Radiation is most frequently done by means of a pyranometer combined with shading ring to shield the pyranometer from the direct solar beam. The ring, which casts a shadow of projected width somewhat larger than the pyranometer sensor
is mounted on a polar axis so as to obscure the entire diurnal path
of the sun. Adjustments are necessary every few days to allow for changing solar declination. Ring designs are discussed fully by Blackwell [1] and Drummond [2].
The shade ring obscures not only the sun but also a considerable area of the sky, so the measured values must be corrected to
compensate for the sky radiation cut off by the ring. This correction is generally computed on the basis of the geometric area of sky
obscured by the ring and assuming that the sky irradiance is isotropic even though the sky is aften very anisotropic. It is
now generally accepted that diffuse irradiance obtained with a shading
ring and corrected by the geometric correction, assuming isotropic
sky, results in values which are considerably underestimated especially in clear or only partly cloudy skies. Drummond [2]
made comparisons in South Africa between diffuse irradiances obtained with a ring and a disc and found that the measurements made with the
ring and corrected by the geometric foctor, assuming isotropic
conditions, were, on average, underestimated by 7%, with mainly clear skies, and about 5% in partly cloudy skies.
The purpose of this project is to assess the error involved in the isotropic-geometric corrections and to find a method of obtaining the additional correction ta be applied to the diffuse ring data to bring them nearer the true data in middle latitude conditions.
1.2. Instrumentation and measurement
At Valentia Observatory a pyrheliometer on solar tracker hos been measuring the Direct Sun radiation at Normal Incidence (I) since November 1978. The Global Solar radiation on a horizontal surface (G) has also been measured.
The combination of Direct Sun measurement (I) and the Global measurement (G) provides the most accurate measurement of the Diffuse Sky radiation on a horizontal surface from the relation:
D =G-ISinE ....•...••... (l)
c
where E is the soler elevation.
4
-1.2.1. Instruments used
The instruments in use during the 2-year period for the measurement of Direct Sun. Global and Diffuse radiation were as follows:
Sensor Integrator
Di rect Sun Eppley NI P Type E6 Eppley 411-5880
Global Kipp and Zonen Type G2 Lintronic 717A
Diffuse Kipp and Zonen Type G18 Lintronic 484B
Shading Ring width (b)
=
50rm1 Radius (r) 155rm1b/r
=
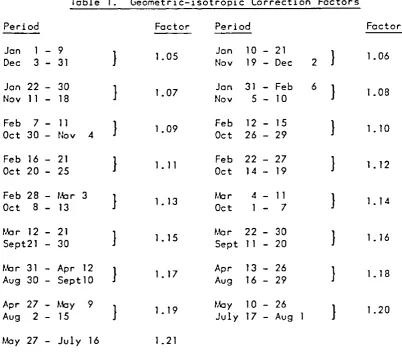
0.321.2.2. Diffuse Sky Geometric-isotropic Correction Factors
The factors used to correct the measured diffuse irradiance data for the geometric area of sky cut off by the ring (assuming isotropic sky) were as shown in Table 1.
Table 1. Geometric-isotropic Correction Factors
Period
Jan 1 - 9 Dec 3 - 31
Jon 22 - 30 Nov 11 - 18
Feb 7 - 11 Oct 30 - Nov 4
Feb 16 - 21 Oct 20 - 25
Feb 28 - Mar 3 Oct 8 - 13
IJar 12 - 21 Sept21 - 30
IJar 31 - Apr 12 Aug 30 - Sept10
Apr 27 - May 9 Aug 2 - 15
IJay 27 - Ju I y 16
Factor
}
1.05}
1.07}
1.09}
1.11}
1. 13}
1. 15}
1. 17}
1. 19 1. 21Period
Jan 10 - 21 Nov 19 - Dec
Jan 31 - Feb Nov 5 - 10
Feb 12 - 15 Oct 26 - 29
Feb 22 - 27 Oct 14 - 19
I.'or 4 - 11
Oct 1 - 7
'.'or 22 - 30 Sept 11 - 20
Apr 13 - 26 Aug 16 - 29
IJay 10 - 26 July 17 - Aug
2
}
6
}
}
}
}
}
}
}
Factor 1.06 1.081 . 10
1. 12
1. 14
1. 16
1. 18
1. 20
The correction factors shown in
the dimensions of the Valentia ring. recorm1ended by Blackwell [1] and are recommended by Drummond [2].
[image:5.598.94.497.405.758.2]r---.~
5
-1.3. Analysis procedure
As stated obove the most accurate value of the Diffuse Sky irradiance is obtained from the combination of Direct Sun and Global measurements as given in equation (1).
data
If "k" is the factor required to reduce the DR data to the true Dc then
Dc = G - ISinE = kD
R .•...•••.••...•...• (2)
The factor k = G - ISinE
DR was computed for each hour of the 2-year period 1979/80 and analysed.
In the analysis the following data were rejected:
(1) (2 )
o
All data when the solar elevation E ~as less than 10 All data when G was less thon 20J/cm
2• In practice all dota
are rounded off to the nearest 1 J/cm and moreover the accuracy of measurement in any element can anly be relied upon to within! 5%. Thus the smaller values could result in unreliable values of
k.
2. Results obtained
2.1. Frequency distribution of "k"
The overall mean value was
distribution of k values for the
found to be k 2-year period
=
1 .062. wos as
The frequency follows:
k
=
0.9 1.0 1.1 1.2 1.3 1.4 1.5Frequency %
=
1.58 51.45 32.56 12.30 1. 84 0.22 0.05This meons that on average the diffuse radiation data os generally derived from the shading ring plus geometric carrection, based on isatrapic sky, are underestimated by 6.2%; 30% of the hourly values are underestimated by more than 10%; 14% af the hourly values are underestimated by more than 15% and 6.5% of the hourly values are underestimated by more than 20%.
2.1.1. Seasonal variation
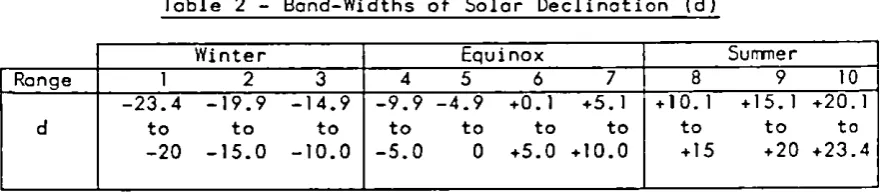
The frequency distribution of k is very similar for the different seasons of the year. To investigate this seasonal aspect the data were grouped in 10 ranges of solar declination each ronge being 0
declinatian band as shown in Table 2.
Table 2 - Bond-Widths of Solar Declination (d)
Winter Equinox Surrmer
Range 1 2 3 4 5 6 7 8 9 10
-23.4 -19.9 -14.9 -9.9 -4.9 +0.1 +5.1 + 1 O. 1 + 15. 1 .. 20.1
d to to to to to to to to to to
[image:6.596.111.554.673.770.2]6
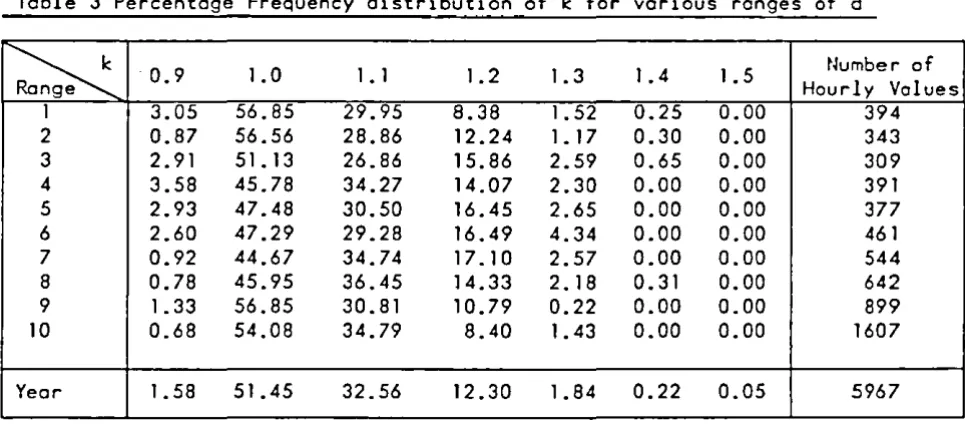
-The percentage distribution of k for each range of solar declination (d) is given in Table 3.
Table 3 Percentage Frequency distribution of k for various ranges of d
~
0.9 1.0 1 • 1 1.2 1.3 1.4 1.5 Number ofHourly Values
1 3.05 56.85 29.95 8.38 1.52 0.25 0.00 394
2 0.87 56.56 28.86 12.24 1. 17 0.30 0.00 343
3 2.91 51.13 26.86 15.86 2.59 0.65 0.00 309
4 3.58 45.78 34.27 14.07 2.30 0.00 0.00 391
5 2.93 47.48 30.50 16.45 2.65 0.00 0.00 377
6 2.60 47.29 29.28 16.49 4.34 0.00 0.00 461
7 0.92 44.67 34.74 17.10 2.57 0.00 0.00 544
8 0.78 45.95 36.45 14.33 2.18 0.31 0.00 642
9 1.33 56.85 30.81 10.79 0.22 0.00 0.00 899
10 0.68 54.08 34.79 8.40 1. 43 0.00 0.00 1607
Year 1. 58 51.45 32.56 12.30 1. 84 0.22 0.05 5967
Grouping the annual data into three seasons (Winter, Equinox and Summer) of approximately 4 months each as shown in Table 2 the frequency distribution
for each seeson becomes
Winter (d below _100) k 0.9 1.0 1.1 1.2 1.3 1.4
2.29 55.07 28.68 11 .85 1.72 0.38
Equinox (d between _100 k 0.9 1.0 1.1 1.2 1.3 1.4
and + 100) 2.37 46.19 32.32 16. 13 2.99 0.00
SUl'TYner (d greeter k 0.9 1.0 1.1 1.2 1.3 1.4
than + 100) 0.89 53.21 33.99 10.29 1.24 0.29
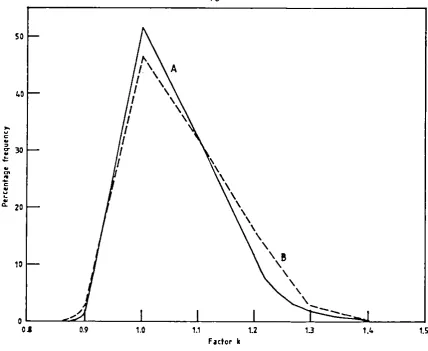
The distribution curves for each of the three seasons are shown with the annual distribution curves in Figs 1-3. The only points of note are
(1) The highest percentage frequency of k = 1.0 occurs in winter and the lowest at the equinox.
(2) A tendency for a higher percentage frequency of k = 1.2 or more during the equinoctial period.
These factors can probably be attributed to the sky conditions which generally prevail during these seasons, in the middle latitude of Valentia. Overcast skies are more prevalent in the winter while settled anticyclonic conditions tend to occur in late spring and in early autumn.
2.2. Variation with Solar Elevation (E)
The data were assembled according to solar elevation (E) for ranges of 50 and the mean value of k found for each range as follows:
Table 4 Mean value af k for various ranges of Solar Elevation
1.5 0.00
1.5 0.09
10 15 20 25 30 35 40 45 50 55
Full
EO to to to to to to to to to ta
14.9 19.9 24.9 29.9 34.9 39.9 44.9 49.9 54.9 59.9 Year
k 1.057 1.054 1.054 1.060 1.067 1. 063 1.069 1.073 1.070 1.067 1.062
[image:7.599.71.554.134.350.2]7
-There seems to be 0 tendency towords higher volues with increosing
elevation. However the overoll range from 1.054 to 1.073, representing only ! 1~ about the meon volue could hordly be considered as 0
significant dependence of "k" on solor elevotion.
2.3. Variation of k with Solor Declinotion (d)
In section 2.1.1. obove it wos shown how the doto were ossembled into sol or declinotion bonds to exomine the frequency distribution on a seosonal basis.
For eoch ronge of solar declinotion (See TobIe 2 obove) the meon value of k wos computed. These were os follows:
Tobie 5 Meon volue of k for eoch ronge of Solor Declinotion
Ronge 1 2 3 4 5 6 7 8 9 10
k 1.052 1.057 1.062 1.064 1.065 1.068 1.077 1.072 1.053 1.059
Winter k
=
1.057 Equinox k=
1. 069 Surrmer k=
1. 060It would oppeor therefore thot the contribution of solor declinotion
to the voriotion of k is limited to obout ! 1~ with the higher volues occurring in the equinoctiol period ond the lower volues during the winter period.
2.4. Voriotion of k with DR/G
The volues of DR/G were computed for eoch hour of the 2-yeor period ond the corresponding volues of k assembled in bond widths of 0.1 for DR/G. The meon volue of k for each bond width is shown in TobIe 6.
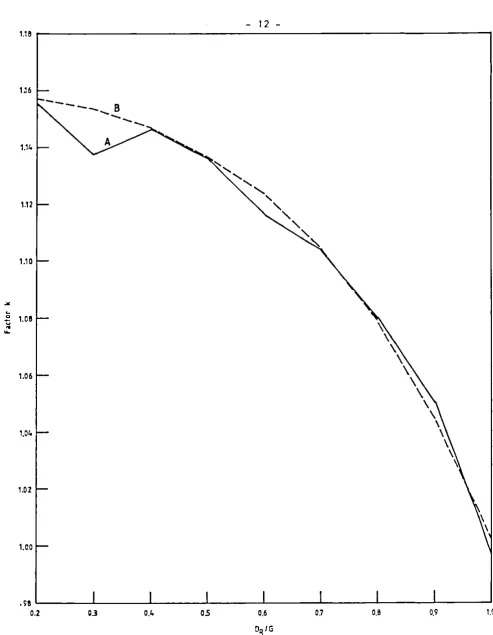
Table 6 Mean values of k for band-widths af DR/G
DR/G 0.2 0.3 0.4 0.5 0.6 0.7 0.8 0.9 1.0
k 1 .156 1. 138 1.147 1 . 136 1 . 11 7 1 . 104 1 .0 8 1 1. 051 0.997
The data are shown graphicolly in fig. 5. These values wauld indicate that the value of DR/G was the most important factor in the variation of k volues and shaw 0 definite trend of increasing k with decreasing values of
DR/Gwhile the diffuse radiotion as at present derived would be accurate when the skies were overcast or almost completely clouded.
In view of the obvious importance of DR/G in the determination of the k values on effort was made to fit an equotion to represent the voriation of k with DR/G.. The solar declinotion (d) was also included as a parameter even though, cis stated in para 2.3. obove, its contribution was small.
The following equation wos found to fit the dota very closely:
8
-Computing k for each value of DR/G in Table 6 above gives the following results (ignoring the declination contribution which is negligible).
Table 7 Values of k computed from formula (3)
DR/G 0.2 0.3 0.4 0.5 0.6 0.7 0.8 0.9
k 1 . 157 1 . 154 1.148 1 . 138 1.124 1. 105 1.079 1.045
These values are also plotted in fig. 5 which shows the very good fit of the equation to the observed values.
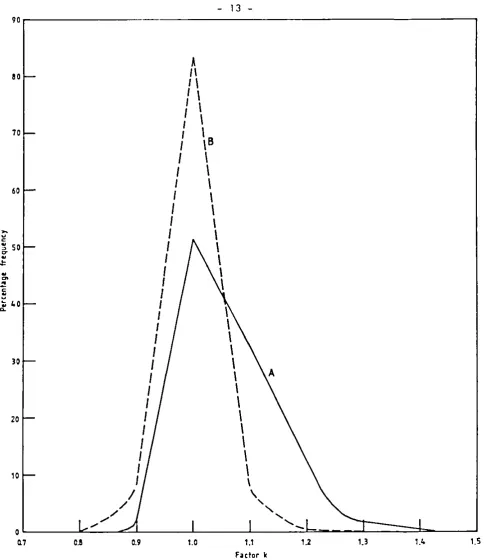
The values of k given in Table 7 provide factors for correcting the hourly values of diffuse radiatian as measured with the ring and to which the geometric ring corrections (assuming isotropic sky) have already been applied. When the haurly data are so adjusted and, the adjusted k value (say kl) computed, the frequency distribution now
becomes:
k 1 = Frequency "'
=
0.8 0.27
0.9 8.23
1.0 83.47
1.1 7.53
1.2 0.40
This distribution is shown graphically in fig. 6.
1.3 0.08
1.4 0.02
It can be seen that by adjusting the data by means of the factor "k" found from equation (3) the occuracy is improved to the extent that 83.47", of the dota are correct to within: 5"' of the true value and 96.48"' of the data are correct to within: 10"'.
3. Conclusion
Hourly values of diffuse solar radiation may be determined with acceptable accuracy with pyronometer plus shading ring provided the following procedure is followed:
(1) The values as measured should firstly be corrected for the sky radiation cut off by the ring. This is done on a purely geometric basis and assuming isotropic sky (Blackwell [1] or Drummond [2]).
(2) The data resulting from (1) should then be corrected by application of a further factor k as determined from equation (3) or
interpolated from the values given in TobIe 7 since DR/G is readily available.
Strictly speaking equation (3) for the correction factors applies to the shading ring in use at Valentia. Other stations may use a shading ring of different dimensions i.e. different b/r ratio. It still remains to be seen how the equation and the resultant k factors may be influenced by variations in the b/r ratio of the shading ring.
1.0
- - -
9
-REFERENCES
1. M.J. Blackwell, "Five years continuous recording of total and diffuse solar radiation at Kew Observatory", Air Ministry Meteorol. Res. Comm., London, M.R.P. 895 (1954).
- 10
-50
40
10
oL---~~
____
~____
~L-____
~____
-L~~~____
~0.1 0.9 1.0 1.1 1.2 1.3 1.4 1.5
F~ctor k
Fi~.l. frlqulncy distribution of k for (A) full year and (B) equmox.
50
40
20
F.Jctor k
[image:11.598.116.545.36.387.2]- 11
-50
40
20
10
--0
0.8 0.9 1.0 1.1 1.2 1.3 1.4 1.5
fl.ctor k
Fig. 3- Frequlncy distribution of k for·~A) full year and ( B) summer to8
1.07
An"u,t mUn 1.062
1.06
1.05 L -_ _ .L-_ _ --L _ _ ---1L-_ _ L-_ _ ...L _ _ ----1 _ _ _ L-_ _ ...L _ _ ----1 _ _ --I
50 55 60
10 15 20 25 30 35 40 45
Solar th:v.tion fdtgrus1
[image:12.597.59.530.49.437.2], - - -
-~ ~
~
~ ~
- 12
-1.18
r - - - .
116
---1.14
1.12
1.10
1.08
'\
'\
\
\
1.06
\
\
\
\
\
\
1.04 \
\ '\
~
1.02
1.00
.,8L_ _ _ _ -L _ _ _ ~ _ _ _ _ ~ _ _ _ _L _ _ _ _ L_ _ _ _ J _ _ _ _ ~ _ _ _ ~
0.2 0.4 05 0.6
°R 1G
0.7 o.! 0.9
[image:13.598.53.547.85.721.2]- 13 9 0 . . .
-10
70
60
30
20
10
A
"
I \
,
\
, I
I \
:
\
I
1
8I
\
I
\
,
\
I
\
I
\
I
I
I
\
I
\
I
\
I
I
f
\
,
\
:
\
I
\
I
\
I
\
I
I
I
\
I
\
I
\
I
\
I
\
I
\
I
\
I
\
/
\/
"-/ "-/
,
0~ _ _ ~~~~~~ _ _ _ ~ _ _ _ ~_~'~-~~ __ ~t:==~~~
__
__1
~7 0.1 0.9 1.0 1.1
Fntor k
1.2 1.3 1.4
Fig. 6. Frequency distribution of k for IAJ original data and IBJ data after adjustment by mllns of equltion 3.
[image:14.597.73.558.85.646.2]