JOURNAL OF FOREST SCIENCE, 57, 2011 (11): 491–499
Tree-ring widths largely reflect environmental conditions. The effect of different factors is visible in the variation of ring size and structure, which systematically vary throughout the life of the tree. The information contained in annual tree rings is a valuable source for studying environmental chang-es by methods of dendrochronology (Fritts 1976; Schweingruber 1996). Recently, dendroclima-tological methods based on these principles have been widely used for the growth prognosis of tree species under the conditions of climate warming (Andalo et al. 2005; Ricker et al. 2007; Su et al. 2007). In addition to climatic factors, more com-plex dendroecological approaches study also site factors as variables influencing the tree ring width (Adams, Kolb 2005; Bolli et al. 2007).
Although the use of tree rings for studying en-vironmental changes is widespread, the extraction of desired signal from unwanted noise can be dif-ficult and uncertain. The conceptual model for ring widths according to Cook and Briffa (1992) indi-cates that the variance of a ring width series may be decomposed into a pure age trend component (A), two common stochastic signal components: cli-matic (C) and exogenous disturbance (D1), and two unique stochastic signal components: endogenous disturbance (D2) and unexplained variability (E). In dendroclimatic studies, the common climatic sig-nal C is of interest, while other sigsig-nals are collec-tively considered as non-climatic variance or noise. The removal of non-climatic trend components from ring-width series is known as
standar-diza-Detrending ability of several regression equations
in tree-ring research: a case study based on tree-ring data
of Norway spruce (
Picea abies
[
L.
]
)
M. Bošeľa
1,2, L. Kulla
1,
R. Marušák
21National Forest Centre – Forest Research Institute in Zvolen, Zvolen, Slovakia
2Faculty of Forestry and Wood Sciences, Czech University of Life Sciences Prague, Prague, Czech Republic
ABSTRACT: The aim of this study was to investigate tree-ring width variability and to distinguish groups of trees with similar growth trends in order to study tree growth responses to various stand and site conditions. The methods of cluster analysis were employed for this purpose. Four distinct groups of trees were identified. For each group, the mean tree-ring curve was calculated in order to look for the main signals that distinguish the groups from one another. The idea behind this was to divide the samples into homogeneous groups with similar growth trends, representing typical examples of variability of the studied Norway spruce population. In the next step, several regression functions were studied and compared for their ability to fit the ring-width-age data applied to the mean ring-width curve of each group. Fischer’s F-test was used to test the differences in goodness of fit between the equations in each group. From all examined/applied equations, smoothing spline, polynomial of degree 5, and Šmelko-Burgan functions were found to be the most universal and suitable for detrending of all examined ring width curves. Hugershoff function was found to be suitable for curves with one local maximum only. Exponential and Korf’s functions were unsatisfactory for the purposes of tree ring curves detrending.
Keywords: radial increment; growth functions; empirical fitting; tree-ring indices; dendroclimatology
Supported by the Ministry of Agriculture and Rural Development of the Slovak Republic, Project No. “The research
tion (Fritts 1976). Standardization transforms the non-stationary ring widths into a new series of stationary, relative tree ring indices that have a defined mean of 1.0 and stabilized variance. Many deterministic (few stochastic) models are known and applied to growth trend estimation and to re-moving non-climatic variance from ring series. The models belong to the family of linear, exponential, polynomial, or more complex growth functions, as comprehensively summarized for example by Vys-kot et al. (1971), Šmelko et al. (1992), and most recently by Pretzsch (2009).
The aim of the present study is to perform anal-yses of tree-ring series obtained during extensive research of declining unnatural Norway spruce ( Pi-cea abies [L.] Karst.) forests in northern Slovakia in order to:
– contribute to the knowledge of variability of tree diameter growth in different site and stand conditions,
– compare the suitability of commonly used equa-tions to fit and to standardize various observed tree-ring series.
MATERIAL AND METHODS
Study region and sampling scheme
The data for the analysis originate from the Orava region in northern Slovakia, belonging to the West Beskids flysch built of sandstones, slates and clay-stones. Moderately cold and very wet hilly climate is typical of the region. The altitude ranges from about 500 to 1,700 m a.s.l. Unnatural spruce ests predominate in the region. Recently, the for-ests have been extensively affected by forest decline driven by bark beetles (Scolytidae) and honey fun-gus (Armillaria sp.) accompanied by destructive harmful factors, mainly wind and snow. Climatic factors have been examined as possible reasons for the observed forest decline.
Pairs of dominant and co-dominant spruce trees, one healthy and one declining, were selected in each sample plot. The plots were arranged in three linear transects situated across the region in the directions of the highest variability of site conditions. In such a way, the whole range of variability of site and stand conditions was covered. From each selected tree, one increment core was taken with a standard incre-ment borer at breast height (1.3 m) in May 2008. To avoid reaction wood, the cores were strictly sampled in up-and-down slope directions. Site and stand pa-rameters were assessed for each sample plot, and for
each sample tree quantitative and qualitative param-eters were measured or visually assessed.
Dendrochronological analyses
From the whole data set, 104 tree ring series were extracted for the analysis, each containing more than 90 radial rings at breast height (i.e. from adult trees older than 100 years). Tree-ring width was measured to the nearest 0.01 mm with the positional measuring system TIME TABLE. A lo-cal ring-width curve was derived, and the obtained ring-width series were cross-dated, checked, and corrected for missing and false rings using dendro-chronological software PAST 32 (Holmes 1994).
Detection of representative incremental patterns
For each ring series, linear increment trend (LIT) was computed for cambial age classes 21–40, 41–60, 61–80 and 81–100 years as the slope of the fractional straight line for each class. If on average the incremental curve shows an upward trend in the range of the age class, LIT is > 0, if the trend is downward, LIT is < 0. Cluster analysis was used to group similar ring series according to LIT val-ues for age classes that represent input variables. Hierarchical clustering by Ward’s method and Eu-clidean distances was used for the estimation of the number of clusters. For the final grouping of ring series, K-means clustering for the predefined num-ber of clusters by the method of maximum starting distance between clusters was applied. Software STATISTICA 7.0 (StatSoft, Inc., 2009) was used. Consequently, selected site-related (altitude and soil quality), stand-related (stand density, vertical structure, stand damage) and tree-related param-eters (tree age, crown length, health status) of clus-ters were compared between the clusclus-ters.
Standardization of mean incremental curves
designed by Šmelko and Burgan in Slovakia, were applied (Table 1). Furthermore, we also applied a cubic smoothing spline method (Reinsch 1967 cited in Cook, Peters 1981; Ruppert et al. 2003), which belongs to nonparametric or semiparamet-ric statistical methods. The spar value of 0.9 was used for the calculation of the smoothing param-eter. R software was used for the computation of all detrending functions.
F-test was employed to compare the goodness of fit between the particular models expressed by the mean square of their residual errors (MSi):
MS1 F = ––––– MS2
n1 n2
∑
(y1 – yˆ 1)2∑
(y 2 – yˆ 2)2 i=1 i=1MS1 = –––––––––– MS2 = –––––––––– n1 – k1 n2 – k2
where:
n – sample size,
k – degrees of freedom of regression parameters.
For each cluster, the minimum mean square was taken as reference for the comparison of other functions. Subsequently, P-value was calculated to determine the statistical significance of differences between the reference model and other models. Moreover, the differences in goodness-of-fit be-tween all selected detrending equations were com-pared using AIC (Akaike information criterion), since the criterion not only rewards of fit, but also includes a penalty that is an increasing function of the number of estimated parameters.
To compare the models by AIC (Akaike 1974), we selected the model for each cluster with mini-mum AIC value. Then we used the formula:
EXP((AICmin –AICi)/2)
in order to evaluate the relative probability that the ith model minimizes the information loss.
RESULTS
Representative incremental patterns
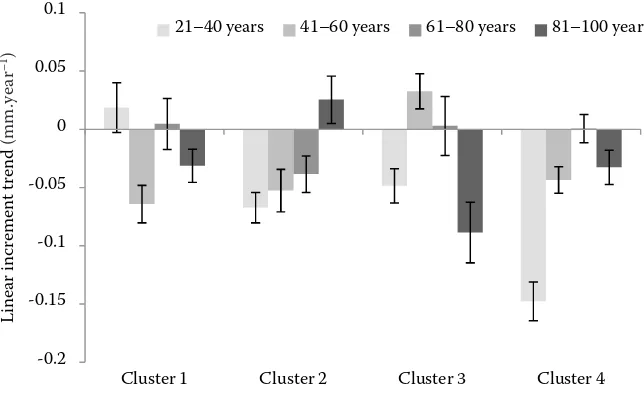
The sample file of 104 tree-ring series was divided into four groups (clusters) on the basis of the par-tial trends of radial increments in the age interval of 21–100 years (Fig. 1). Main differences between clusters are in the number and in the position of radial increment culminations in time. Cluster 1 has its main local maximum at the age of around 30–40 years and a slight indication of its secondary maximum at 80 years. An early main maximum be-fore the age of 30 years and a late secondary signifi-cant maximum after 100 years are typical of clus-ter 2. Clusclus-ter 3 differs from the others by a striking secondary maximum at middle age (60–90 years). Cluster 4 resembles cluster 1, but its main maxi-mum appears much earlier, before the age 20 years.
[image:3.595.66.266.422.561.2]Table 2 summarizes the differences in selected site, stand and tree-related parameters between the clusters. The revealed differences are generally unclear (Table 2). The only noteworthy difference is a significantly higher proportion of multi-sto-ried stands in cluster 3, which is a probable reason for its distinct secondary increment maximum at middle age. In the case of cluster 1, a higher pro-portion of poor sites and sites at higher elevations could cause its later first maximum and in general a slower drop of the incremental curve. A higher proportion of damaged stands, sparse stands and stand rests in clusters 2 and 4 could contribute Table 1. List of the functions used for standardisation of example incremental curves
1. y(t) = a × tb × exp(–ct) + d Hugershoff (1936)
2. y(t) = a exp
(
–––––b t1–c)
–––b1 – c tc Korf (1939) 3. y(t) = a0(1 + exp(a1t + a2t2 + a
3t3 + a4t4)) Šmelko-Burgan (Burgan 1983)
4. y(t) = a + exp (–bt) + c Exponential (Fritts 1976) 5. y(t) = a0 + a1t + a2t2 + a
3t3 + a4t4 + a5t5 Polynomial
6.
n
∑
(y1 – ƒˆ (xi))2 + λ3∫
ƒˆ (x)2dxi=1 Spline (Ruppert et al. 2003)
to the late increment maximum indication due to light increment.
Standardization of incremental curves
In the text below, a graphical comparison of goodness-of-fit between particular equations for the clusters is presented.
In the case of cluster 1, exponential and Korf’s equations were shown to represent the growth
trend of the mean increment in the worst way, us-ing both MS and AIC statistics. Following the F -test, a spline or polynomial equation tended to have the best fit, and thus they were assumed to remove the major portion of the non-climatic vari-ance. However, using the AIC, the Šmelko and Bur-gan equation was found to be better than the spline one. Similarly, for cluster 2, Korf’s and exponential function can be said to be insufficient to explain the growth trend. The best equations (according to MS as well as AIC) were Šmelko and Burgan and Hu--0.2
-0.15 -0.1 -0.05 0 0.05 0.1
Cluster 1 Cluster 2 Cluster 3 Cluster 4
Linear incr
ement
trend
(mm.year-1)
[image:4.595.68.390.60.261.2]21–40 years 41–60 years 61–80 years 81–100 years Fig. 1. Linear radial incre-ment trends (LIT) of de-signed clusters according to cambial age classes (whiskers represent a 95% confidence interval)
Table 2. Comparison of the clusters according to selected site, stand- and tree-related parameters
Variable Cluster 1 Cluster 2 Cluster 3 Cluster 4
Continuous Med. Q10 Q90 Med. Q10 Q90 Med. Q10 Q90 Med. Q10 Q90
Altitude (m a.s.l.) 1,052 730 1,175 957 785 1,114 793 760 1,125 959 775 1,117
Stand density 6 3 8 6 0 7 7 0 8 4 3 7
Tree age (years) 120 99 140 120 101 133 99 96 133 123 99 135
Relative crown length (%) 53 38 63 48 37 83 61 47 79 48 37 60
Categoric n (%) SE n (%) SE n (%) SE n (%) SE
Soil quality
Oligotrophic 11 55 ± 15 5 20 ± 18 8 32 ± 16 13 38 ± 13
Hemioligotrophic 5 25 ± 19 12 48 ± 14 13 52 ± 14 15 44 ± 13
Eutrophic 4 20 ± 20 8 32 ± 16 4 16 ± 18 6 18 ± 16
Vertical structure
Stand rests 1 5 ± 22 4 16 ± 18 3 12 ± 19 0 0 –
One-storey 15 75 ± 11 21 84 ± 8 10 40 ± 15 32 94 ± 4
Multi-storey 4 20 ± 20 0 0 – 12 48 ± 14 2 6 ± 17
Stand damage
Undamaged 4 20 ± 20 6 24 ± 17 11 44 ± 15 4 12 ± 16
Moderate 10 50 ± 16 12 48 ± 14 9 36 ± 16 11 32 ± 14
Strong 6 30 ± 19 7 28 ± 17 5 20 ± 18 19 56 ± 11
Tree status
Healthy 11 55 ± 15 14 56 ± 13 11 44 ± 15 15 44 ± 13
Declining 9 45 ± 17 11 44 ± 15 14 56 ± 13 19 56 ± 11
Med. – median; Q10, Q90 – quantiles; n – sample size, % – ratio, SE – standard error
(mm.ye
ar
[image:4.595.63.536.463.738.2]gershoff equations along with the polynomial one. The growth trend in cluster 3, as represented by the mean curve, belongs to the most complicated and the functions such as exponential and Korf’s ones tend to have an almost linear shape, thus supposed not to be sufficient. Cluster 4 has a similar trend like cluster 2, but with the more complicated trend at mature age, with increased increment width at the age of around 120.
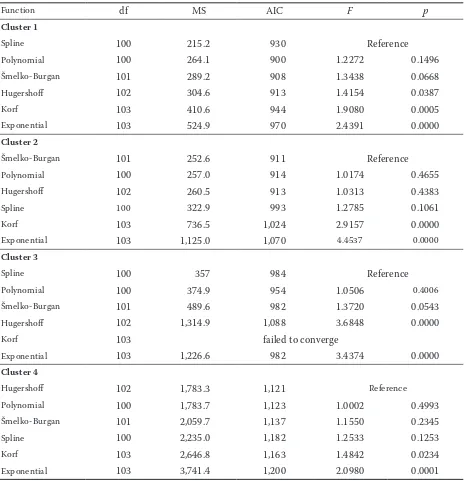
As seen in Table 3, in cluster 1 the spline was cho-sen as a reference model with the best goodness of fit (the mean root square is 215). It is clear from
the comparison of other models with the reference model based on F-test that the models including the polynomial of degree 5 and Šmelko-Burgan could be used instead of the reference model. Moreover, the comparison by means of AIC showed the poly-nomial of degree 5 as the best model fitting to clus-ter 1. The Hugershoff and Korf growth functions and the exponential model were not satisfactory to be used for cluster 1.
[image:5.595.67.533.71.552.2]In the case of cluster 2, the model developed by Šmelko and Burgan was taken as a reference model as it provided the best fit according to both MS and
Table 3. Comparison of goodness of fit of the models inside cluster 1, 2, 3 and 4
Function df MS AIC F p
Cluster 1
Spline 100 215.2 930 Reference
Polynomial 100 264.1 900 1.2272 0.1496
Šmelko-Burgan 101 289.2 908 1.3438 0.0668
Hugershoff 102 304.6 913 1.4154 0.0387
Korf 103 410.6 944 1.9080 0.0005
Exponential 103 524.9 970 2.4391 0.0000
Cluster 2
Šmelko-Burgan 101 252.6 911 Reference
Polynomial 100 257.0 914 1.0174 0.4655
Hugershoff 102 260.5 913 1.0313 0.4383
Spline 100 322.9 993 1.2785 0.1061
Korf 103 736.5 1,024 2.9157 0.0000
Exponential 103 1,125.0 1,070 4.4537 0.0000
Cluster 3
Spline 100 357 984 Reference
Polynomial 100 374.9 954 1.0506 0.4006
Šmelko-Burgan 101 489.6 982 1.3720 0.0543
Hugershoff 102 1,314.9 1,088 3.6848 0.0000
Korf 103 failed to converge
Exponential 103 1,226.6 982 3.4374 0.0000
Cluster 4
Hugershoff 102 1,783.3 1,121 Reference
Polynomial 100 1,783.7 1,123 1.0002 0.4993
Šmelko-Burgan 101 2,059.7 1,137 1.1550 0.2345
Spline 100 2,235.0 1,182 1.2533 0.1253
Korf 103 2,646.8 1,163 1.4842 0.0234
Exponential 103 3,741.4 1,200 2.0980 0.0001
Fig. 2. Example mean incremental curves standardized by six selected equation 0 50 100 150 200 250 300 350 400
0 50 100 150
In cr em ent (0 .0 1 m m ) Age (years) 0 50 100 150 200 250 300 350 400
0 50 100 150
In cr em en t ( 0. 01 m m ) Age (years) 0 50 100 150 200 250 300 350 400
0 50 100 150
In cr em en t ( 0. 01 m m ) Age (years) 0 50 100 150 200 250 300 350 400
0 50 100 150
In cr em en t ( 0. 01 m m ) Age (years) 150 200 250 300 350 400 450 rement (0.01 mm) 0 50 100 150 200
0 50 100 150
Increment ( Age (years) 100 150 200 250 300 350 rement (0.01 mm) 0 50 100 150
0 50 100 150
Increment Age (years) 300 400 500 600 ent (0.01 mm) Increment Hugershoff Šmelko-Burgan Exponential Korf Polynomial Spline 0 100 200 300
0 50 100 150
Increment (0.0 1 Age (years) Polynomial Spline 300 400 500 600 ent (0.01 mm) Increment Hugershoff Šmelko-Burgan Exponential Korf Polynomial Spline 0 100 200 300
0 50 100 150
Increment (0.0
1
Age (years)
Polynomial Spline
AIC (Table 3). The other models, which could be used instead of the reference model, are polynomial of degrees 5, Hugershoff, and spline. In contrast, un-satisfactory models are Korf’s and exponential ones. In cluster 3, similarly like in cluster 1, the spline was found to have the best goodness of fit compar-ing the mean square of the residuals, as it can be seen from Table 3. On the contrary, when the AIC method was used, one can see that the polynomial function provided the best fit. The spline func-tion was shown as the third best. Among the other models, the polynomial model and that developed by Šmelko and Burgan were the only two models that could potentially be used instead. However, when compared with AIC, Šmelko and Burgan and exponential functions provided the second best fit.
This cluster is characterized by very complex for-est structures, and hence the theoretical models such as Korf and Hugershoff, and those with only two or even three regression parameters appear to fit the data very weakly. For such forests, stochas-tic methods seem to be better to use for detrend-ing, because the complicated diameter growth is supposed to be the result of tree competition, and employing the known growth function is not ap-parently enough to maintain the low-frequency climatic signals.
The Hugershoff function was chosen as refer-ence for cluster 4 on the basis of both MS and AIC. The models that can also be efficiently utilized for growth modelling are the polynomial of degrees 5, spline, and the function of Šmelko and Burgan.
Cluster 1 Cluster 2
DISCUSSION
The first objective of the paper was to describe the variability of tree-ring width patterns and to verify their expected relations mainly to various stand conditions. Considering this objective, a multifactorial statistical method, namely cluster analysis, was employed. Each tree-ring series was divided into four groups according to age. The lin-ear increment trends within the four groups repre-sented input variables. Similarly, Koprowski and Zielski (2006) used a hierarchical cluster analysis to distinguish regions with similar increment pat-terns. This method was successfully employed also by Wilson and Hopfmueller (2001 as cited in Koprowski, Zielski 2006) to distinguish groups of trees at various altitudes.
In contrast to our expectations, stand and tree related parameters did not differ substantially be-tween the specified clusters of trees. It means that it is not possible to estimate radial increment pat-terns on the basis of tree and stand parameters sat-isfactorily. According to the results of our study, almost 50% of the markedly abnormal tree ring series having more than one local maximum (clus-ter 3), which are expected in multi-storied uneven-aged stand structures, belong to the trees growing in single-storied even-aged stands. Therefore, de-trending functions that are able to fit abnormal and complicated incremental curves should be univer-sally applied to ring series standardization.
Another aim of the study was to compare the ability of various increment functions to fit the dif-ferent growth trends of pre-defined clusters using the least-square method. For the analysis, the fol-lowing six equations were selected: Korf, Šmelko-Burgan, exponential, polynomial of degree 5, Hu-gershoff and cubic spline. For each cluster, the best function was determined by Fischer’s F-test and Akaike information criterion. There exist many studies dealing with dendrochronology and the equations to be potentially used for such analyses. However, many studies focusing on tree-ring re-search do not analyze the particular equations and do not compare them with one another. In most methodologies, only one equation is chosen for ring-width studies without its previous evaluation. However, after a review of recently published ar-ticles dealing with tree-ring research, we can con-clude that the smoothing spline method prevails. A spline provides more natural fit to the data because it operates effectively as a centrally weighted mov-ing average of the data (Cook, Peters 1981) and in the recent tree-ring research it has been widely
open-canopy forests (Fritts 1976; Bräker 1981 as cited in Fang et al. 2010). From among deter-ministic functions, a linear or negative exponen-tial function is less suitable for tree-ring research, since they cannot imitate the accelerated growth of tree rings close to the pith (Fang et al. 2010), thus for instance Hugers-hoff function could be used instead (Waren 1980; Bräker 1981). Fang et al. (2010) also pointed out the end-fitting problem of Hugershoff equation suggesting that the distur-bances for a certain period could bias the global fitted function (also stated by Melvin 2004). In our study, the Hugershoff function showed one of the best fittings except for cluster 3, where trees experienced two maximums of growth increment, one at the growth beginning and second at the age of about 80 years. Here, the best function was shown to be a smoothing spline.
CONCLUSION
To summarize the results from our analysis, sim-ple equations such as exponential function, which is widely used for detrending all over the world, along with Korf’s function were shown to be the weakest in fitting the tree-ring series of all clusters. There are many cases when tree-ring series have more than one maximum, which is caused in many cases by thinning or other management measures and they should be removed to study low-frequency climatic signals. For such cases, the common equations such as exponential, linear, Hugershoff, Korf are not able to satisfactorily remove significant non-climatic variability. Moreover, the end-fitting problem is present when using such equations. As resulted from our study, the most appropriate deterministic function was Hugershoff function, which optimally fit the data at the pith. However, it was found in-appropriate when employed for close-canopy trees that were stressed by competition or other distur-bances and had more than one maximum of growth increment caused by other than climatic factors. For such tree-ring series, more flexible functions such as smoothing spline, polynomial of higher degree and that proposed by Šmelko and Burgan should be preferred to preserve the low-frequency variance caused by climate dynamics.
References
Adams H.D., Kolb T.E. (2005): Tree growth response to drought and temperature in a mountain land-scape in
northern Arizona, USA. Journal of Biogeography, 32: 1629–1640.
Akaike H. (1974): A new look at the statistical model iden-tification. IEEE Transactions on Automatic Control, 19: 716–723.
Andalo C., Beaulieu J., Bosquet J. (2005): The impact of climate change on growth of local white spruce popula-tions in Quebec. Canadian Forest Ecology Management, 205: 169–182.
Bijak S. (2010): Tree-ring chronology of silver fir and its de-pendence on climate of the Kaszubskie Lakeland (Northern Poland). Geochronometria, 35: 91–94.
Bolli J.C., Rigling A., Bugmann H. (2007): The influence of changes in climate and land-use on regeneration dynamics of Norway spruce at the treeline in the Swiss Alps. Silva Fennica, 41: 55–70.
Bouriaud O., Popa I. (2008): Comparative dendroclimatic study of Scot pine, Norway spruce, and silver fir in the Vrancea Range, Eastern Carpathian Mountains. Trees, 23: 95–106.
Bräker O.U. (1981): Der Alterstrend bei Jahrringdichten und Jahrringbreiten von Nadelhölzern und sein Ausgleich. Mitteilungen der Forstlichen Bundesversuchsanstalt, 142: 75–102.
Brienen R.J.W., Zuidema P.A. (2005): Relating tree growth to rainfall in Bolivian rain forests: a test for six species us-ing tree rus-ing analysis. Oecologia, 146: 1–12.
Burgan K. (1983): Modeling of the Selected Biometric Relationships in Forest Stands. [Ph.D. Thesis.] Zvolen, Technical University in Zvolen: 133. (in Slovak)
Büntgen U., Frank D.C., Kaczka R.J., Verstege A., Zwijacz-Kozica T., Esper J. (2007): Growth responses to climate in a multi-species tree-ring network in the Western Carpathian Tatra Mountains, Poland and Slovakia. Tree Physiology, 27: 689–702.
Carrer M., Urbinati C. (2006): Long-term change in the sensitivity of tree-ring growth to climate forcing in Larix
deciduas. New Phytologist, 170: 861–872.
Cook E., Briffa K. (1992): Data analysis, introduction. In: Cook E., Kairiukstis L. (eds): Methods of Dendro-chronology: Application in the Environmental Sciences. Dordrecht, Kluwer Academic Publishers: 397.
Cook E.R., Peters K. (1981): The smoothing spline: A new approach to standardizing forest interior tree-ring width series for dendroclimatic studies. Tree-Ring Bulletin, 41: 45–53.
Cook E. R., Kairiukstis L.A. (1990): Methods of Dendro-chronology: Application in the Environmental Sciences. Dordrecht, Kluwer Academic Publishers.
Fang K., Gou X., Peters K., Li J., Zhang F. (2010): Remov-ing biological trends from tree-rRemov-ing series: testRemov-ing modified Hugershoff curves. Tree-Ring Research, 66: 51–59. Fritts H.C. (1976): Tree Rings and Climate. New York,
Fritts H.C., Vaganov E.A., Sviderskaya I.V., Shashkin A.V. (1991): Climatic variation and tree-ring structure in conifers: empirical and mechanistic models of tree-ring width, number of cells, cell-wall thickness and wood den-sity. Climate Research, 1: 97–116.
Gray S.T., Fastie Ch.L., Jackson S.T., Betancourt J.L. (2004): Tree-ring-based reconstruction of precipitation in the Bighorn Basin, Wyoming, since 1260 A.D. Journal of Climate, 17: 3855–3865.
Holmes R.L., (1994): DPL-Dendrochronology Program library. Tucson, University of Arizona.
Korf V. (1961): Growth process of forest stands and general increment equation. Lesnictví, 7: 231–256. (in Czech) Melvin T.M. (2004): Historical growth rates and changing
climate sensitivity of boreal conifers. [PhD Thesis.] Nor-wich, University of East Anglia.
Pérez P.J., Kahle H.P., Spiecker H. (2005): Growth trends and relationships with environmental factors for scots pine [Pinus sylvestris (L.)] in Brandenburg. Investigación Agraria: Sistemas y Recursos Forestales, 14: 64–78. Podlaski R. (2002): Radial growth trends of fir (Abies alba
Mill.), beech (Fagus sylvatica L.) and pine (Pinus sylvestris L.) in the Świętokrzyski National Park (Poland). Journal of Forest Science, 48: 377–387.
Pretzsch H. (2009): Forest Dynamics, Growth and Yield: From Measurement to Model. Berlin; Heidelberg, Sprin- ger: 664.
Ricker M., Guiterrez-Garcia G., Daly D.C. (2007): Mod-eling long-term tree growth curves in response to warming climate: test cases from a subtropical mountain forest and a tropical rainforest in Mexico. The Canadian Journal of Forest Research, 37: 977–989.
Ruppert D., Wand M.P., Carroll R.J. (2003): Semipa-rametric Regression. Cambridge, Cambridge University Press: 386.
Schweingruber F.H. (1996): Tree Rings and Environment: Dendroecology. Swiss Federal Institute for Forest, Snow and Landscape Research and Paul Haupt Verlag: 609. StatSoft, Inc. (2009): STATISTICA (data analysis software
system). Version 9.0., Available at www. statsoft.com Su H.X., Sang W.G., Wang Y.X., Ma K.P. (2007):
Simulat-ing Picea schrenkiana forest productivity under climatic
changes and atmospheric CO2 increase in Tianshan Moun-tains, Xinjiang Autonomous Region China. Forest Ecology Management, 246: 273–284.
Šmelko Š., Wenk G., Antanaitis V. (1992): Growth, Structure and Production of Forest. Bratislava, Príroda: 342. (in Slovak)
Vyskot M., Doležal B., Jurča J., Korf V., Korpeľ Š., Macháč D., Polák L., Priesol A., Řehák J., Wolf J. (1971): Bases of Growth and Production of Forests. Praha, SZN: 440. (in Czech)
Waren W.G. (1980): On removing the growth trend from dendrochronological data. Tree-Ring Bulletin, 40: 35–44 Wilson R.J.S., Hopfmueller M. (2001): Dendrochrono-logical investigations of Norway spruce along an elevation transect in the Bavarian Forest, Germany. Dendrochrono-logia, 19: 67–79.
Received for publication December 6, 2010 Accepted after corrections September 29, 2011
Corresponding author:
Ing. Michal Bošeľa, National Forest Centre – Forest Research Institute, T. G. Masaryka 22, 960 92 Zvolen, Slovak Republic