David W. Rees Jones,∗ Richard F. Katz, and Meng Tian
Department of Earth Sciences, University of Oxford, South Parks Road, Oxford, OX1 3AN, UK.
John F. Rudge
Department of Earth Sciences, Bullard Laboratories,
University of Cambridge, Madingley Road, Cambridge CB3 0EZ, UK. (Dated: January 11, 2017)
Magmatism in subduction zones builds conti-nental crust and causes most of Earth’s subaerial volcanism. The production rate and composition of magmas are controlled by the thermal struc-ture of subduction zones. A range of geochemical and heat flow evidence has recently converged to indicate that subduction zones are hotter than predicted by models of solid-state mantle creep. We show that this discrepancy can be resolved by consideration of the heat transported by magma itself. In our one- and two-dimensional numeri-cal models and snumeri-caling analysis, magmatic trans-port of sensible and latent heat locally alters the thermal structure of canonical models by∼300 K, increasing predicted surface heat flow and mid-lithospheric temperatures to observed values. We find the advection of sensible heat to be signifi-cantly larger than the deposition of latent heat. Based on these results we conclude that thermal transport by magma migration affects the chem-istry and the location of arc volcanoes.
Petrological estimates of temperature conditions in both continental and oceanic subduction zones are sys-tematically higher than predicted by thermal models, typically by 200–300 K [1–3]. Similarly, measurements of geothermal heat flow in SW Oregon and NE Japan are higher than predicted [1, 4] by approximately 50– 100 mW/m2 near the volcanic arc. Geophysical
evi-dence from seismic imaging and magnetotelluric imaging of high temperatures and/or magma at depth under vol-canic arcs [5, 6] is consistent with the emerging consensus that subduction zones are hotter than canonical models predict.
In canonical models, the thermal structure of subduc-tion zones is calculated as a balance between diffusion of heat and advection of heat by the creeping solid mantle within the wedge-shaped region between the subducting slab and overriding lithosphere [7]. Previous modelling efforts to resolve the conflict with observations have in-volved varying the prescribed geometry of subduction, the coupling between mantle and slab, and the rheolog-ical model of the mantle [1, 4]. Inclusion of frictional heating along the slab top in the seismogenic zone in-creases heat flow in the fore-arc [8]. None of these efforts
∗Corresponding author: David.ReesJones@earth.ox.ac.uk
have been successful in explaining both the amplitude of the thermal observations and their position relative to the volcanic arc.
It is known that hydrous fluids are released from the subducting slab by de-volatilization reactions [9] and per-colate upward into the mantle wedge. There they reduce the solidus temperature, promote melting, and hence be-come silicic as they ascend. During their ascent, the flu-ids traverse from cooler mantle adjacent to the slab, to hotter mantle at the core of the wedge, to cooler mantle at the base of the lithosphere. They advect their temper-ature between these regions and consume or supply latent heat with melting and freezing. Despite the copious pro-duction of magma in subpro-duction zones, these processes have been neglected from previous models. The circula-tion of hydrous fluids in the crust is believed to play a role in cooling the slab in the fore-arc region [11], and a scaling argument comparing advective heat transport by magma flow to thermal diffusion in terms of a P´eclet number suggests that magma flow may also be thermally significant [10]. In this paper we assess the role of mag-matic processes in altering the thermal structure of the wedge and lithosphere. Our approach is based on the the-ory of two-phase dynamics of the magma–mantle system [12]. We quantify the role of melts in terms of advection by melt transport and latent heat sources/sinks associ-ated with freezing and melting reactions.
Magma migration in the mantle is a particular case of two-phase flow, governed by continuum equations of mass and momentum conservation with constitutive re-lations for the shear and bulk viscosity of the mantle and the mobility of the magma [12]. In order to calcu-late the thermal effect of melt migration, we also solve a heat equation derived from the conservation of energy, and equations for conservation of chemical species. We specify a petrological model of phase change to deter-mine the rate at which latent heat is released by melting and freezing reactions. We omit most of these governing equations, which can be found in, for example, references [12, 13], and are discussed further in the Supplementary Material. However, since it is central to our study, we briefly describe the heat equation:
∂T
∂t +v· ∇T=κ∇
2T+ L ρcp
Γ, (1a)
v=vs(1−φ) +vlφ≡vs+vD. (1b)
T denotes temperature, t time, κthermal diffusivity, ρ
density, cp specific heat capacity, L latent heat, and Γ melting rate. We neglect differences between the ther-mal properties of the phases since these do not affect the solution at leading order. The velocity variables involved are: solid mantle velocityvs, liquid magma velocityvl, the Darcy (or segregation) flux vD ≡ φ(vl−vs), and phase averaged velocityv.
In the absence of magma, eqn. (1a) reduces to the heat equation used in canonical single-phase flow calcu-lations. In the presence of magma, two additional terms are present. First, a latent heat sink associated with melting (Γ>0), which becomes a source in the case of freezing (Γ <0). Second, an additional advective term associated with the segregation flux of magma (caused, for example, by its tendency to rise buoyantly). For the latter, the decomposition of the phase-averaged velocity
v intovs and vD clarifies the advective role of magma-tism in the energy balance of subduction zones. Hence we emphasize that the latent heat of phase change is not the only contribution; we next consider the importance of latent heat relative to advective transport by the magma. So-called ‘melting-column models’ have been used to understand mid-ocean ridge magmatism, where the main cause of melting is decompression of the upwelling magma and mantle [14–16]. Subduction zones are a con-siderably more complex environment, but we adapt ideas from melting-column models to investigate how magma-tism modifies subduction thermal structure. One impor-tant difference from mid-ocean ridges is that hydrous flux-melting is the dominant cause of melting in sub-duction zones. Therefore, we extend the two-component phase diagrams used previously [16] by adding a third, hydrous component [17]. We use a quasi-linear solidus depression with water content and choose parameters to mimic the main features of the isobaric productivity curves given by [18], which are based on compiled labo-ratory data. Further details of our parameterization are given in the Supplementary Material.
A one-dimensional, steady-state heat equation, with lengths rescaled by the height of the column H and ve-locities rescaled by the diffusive scaleκ/H, can be written
PeT0−Ψ =T00−Pe St (T0+ ∆TH), (2)
where a prime denotes a derivative with respect to height (e.g., T0 is a rescaled vertical heat flux) and ∆TH is melting rate associated with decompression. Two di-mensionless numbers control the behaviour of the sys-tem: a P´eclet number Pe =HW0/κis the scaled volume
flux at the base of the column and quantifies the flux of fluid off the subducting slab; and a Stefan number St = (L/cp)∂F/∂T is a scaled isobaric productivity and quantifies the latent heat of melting.
The mantle flow in subduction zones is far from one-dimensional; a corner flow is driven by the motion of the subducting slab [7]. A key step in representing corner flow in a column model is to introduce a spatially vari-able volumetric heating term Ψ that mimics the effects of large-scale mantle advection. We calculate Ψ from
a single-phase, two-dimensional flow and thermal struc-ture model, using the domain geometry and temperastruc-ture- temperature-dependent viscosity given by a benchmark study [19]. We show the geometry and thermal structure in the Sup-plementary Material. This is generic, not intended to represent any particular subduction zone. We extract a vertical temperature profile at some position of in-terest Tref.(z), and use it to calculate the source term
Ψ =−Tref00 .. In the absence of fluid flow (Pe = 0), this model returns T = Tref.. For Pe > 0, this approach
is reasonable provided melt does not drastically change the large-scale mantle dynamics, a prospect we consider below.
We present example column solutions in Fig. 1. These use a slab-fluid source at 100 km depth, roughly consis-tent with the observed mean position of arc volcanoes [21, 22]. The hydrous flux at the base of the column is varied within the range suggested by a previous study of fluid flow in subduction zones [20]. Column (a) shows profiles of the absolute temperature; column (b) shows the temperature difference compared to a single-phase (magma-free) reference case. The change in temperature from the reference state increases with fluid transport, and is significant even at the lower end of the range of fluxes [20]. Immediately above the slab, fluid flow reduces the mantle temperature as material is transported from the relatively cold slab. Nearer the surface, the effect is reversed as fluid flow brings warm material from the mantle into the lithosphere. This effect is supplemented by latent heat release, shown in column (c). Above the slab, melting of the mantle wedge facilitated by the pres-ence of water consumes latent heat. Nearer the surface, solidification of the melt deposits latent heat. It is inter-esting to note that the maximum degree of melting (d) does not vary monotonically with fluid flow, but peaks at an intermediate P´eclet number between 2 and 5.
The main physical mechanism giving rise to this tem-perature signal is advection by the magma, represented in the advection term of eqn. (2). Indeed, the latent heat of freezing/melting is relatively small. In the Sup-plementary Material, we report further calculations that show that neglecting latent heat makes little difference to the temperature profiles, and that changing the pa-rameterization of hydrous flux melting (either to mimic more closely a more detailed parameterization [18], or by artificially doubling the Stefan number) is also inconse-quential.
ther-FIG. 1. Melting column model with prescribed temperature at the base (z= 0) and top (z= 1) of the melting column, which runs from the slab to the surface respectively. (a) temperature profiles, (b) temperature perturbation caused by magmatism, (c) scaled melting rate, (d) degree of melting. The range of P´eclet number considered is roughly equivalent to melt fluxes from the slab reported in Wilsonet al.[20]. Bulk water content is 0.5%.
mal structure and solid flow, which are coupled through the temperature-dependence of mantle viscosity, until a steady-state is achieved. The thermal impact of magma-tism is then defined as the difference between the cal-culated and reference temperature fields. Note that we do not consider any latent heat effects in this exercise because we previously observed that these are negligible.
The two-dimensional calculations predict that fluid flow substantially alters the thermal structure in sub-duction zones, as shown in Fig. 2. The main effect is to raise temperatures near the base of the lithosphere, where warm material is transported from the mantle up-ward. These 2D results are qualitatively similar to the 1D column models (cooling above the slab, warming near the surface), indicating that the physical mechanisms dis-cussed in the previous section remain pertinent. Some features only occur in two dimensions, such as the along-slab cooling observed deeper than the fluid source that is caused by advection by the mantle flow. Thus the thermal impact of magmatism is felt beyond where the magma itself flows.
Using a reference estimate of global arc magma produc-tion of 1 km3/yr [26], comparable to the estimate used in
England and Katz [27], magmatism raises temperatures by up to 270 K (Fig. 2b). We also consider a magmatic flux 50% smaller or larger than this reference case. Tem-peratures are raised by∼150 K (Fig. 2a) with the lower estimate (consistent global average estimate of arc
vol-canism excluding plutonism [28]). The higher estimate raises temperatures by up to 380 K (Fig. 2c). In the Sup-plementary Material, we separately consider fluid release associated with the major dehydration reactions of the slab. We also show that the coupling of the solid flow to the heat equation increases the thermal perturbation (since the solid viscosity is reduced leading to increased solid velocities, a positive feedback), that only the total flux (not the width) of the fluid source is thermally sig-nificant, and that a thicker overriding plate reduces the thermal perturbation.
Elevated near-surface temperatures in subduction zones are associated with elevated heat flow, as shown in Fig. 3. This elevated heat flow is strongest at the posi-tion of the arc, over a width of around 50 km. The width is determined by thermal diffusion rather than the im-posed width of fluid source. Calculations with a magma flux between the reference and high values are consistent with heat-flow observations.
[image:3.612.92.535.63.314.2]FIG. 2. The thermal impact of magmatism (T −Tref.) associated with a source beneath the volcanic arc (dashed black line). The slab and overriding plate geometry are shown by solid black lines. We compare a low, medium and high estimate of the magmatic flux (a–c). The prescribed magma flow (segregation flux) is shown in (d). Horizontal and vertical scales are distance from the trench, in kilometres.
FIG. 3. Elevated heat flow in subduction zones associated with melt migration is consistent with observed ranges [23– 25] in oceanic and continental subduction zones. The heat flow is raised by around 40–120 mW/m2 concentrated near the region of peak fluid flow 100 km from the trench. The results were obtained by evaluating surface temperature gra-dients from Fig. 2 and converting to heat flow using a constant thermal conductivity of 2.52 W/m/K.
based on two-phase flow supports the hypothesis that magmatism significantly alters the thermal structure of subduction zones.
Scaling arguments also support this argument. Indeed,
0 500 1000 1500
T(◦C)
0
20
40
60
80
100
120
D
ep
th
(k
m
)
FIG. 4. Temperature structure compared to a compilation of petrological and heat flow data (black open shapes are taken from Plate 1 in Reference [1]). We shift the output of two thermal models [4, 29] by the thermal impact of melt migra-tion calculated as the reference case in Fig. 2(b). The origi-nal temperatures are open blue circles and diamonds and the modified temperatures are shown in solid red markers of the corresponding shape. Our reference (blue dashed) and mod-ified (solid red) thermal profiles are also included, but note that these were computed with a greater subduction angle from the geometry of [19].
it is possible to approximate the thermal effect of mag-matism due to advection as follows. The elevated heat flow
Q≈ FVρcp∆T Asub.
≈80 mW/m2, (3)
[image:4.612.54.298.251.553.2] [image:4.612.317.559.255.441.2]is consistent with Fig. 3. We can also support our con-tention that advective heat transport matters more than latent heat release by estimating the ratio R of these terms in eqn. (1a):
R≈ cp∆T L
ρ|vD| ΓH ≈
cp∆T
L ≈3.2, (4)
where L= 5×10⁵J kg−1. We have used the fact that, at steady state, ρ|vD|/ΓH ≈ 1 on average, since there is a balance between melt production, melt extraction, and melt solidification. Therefore, magmatism has a sig-nificant thermal effect and this effect is mainly due to advection by the magma. This latter finding is in con-trast to a one-dimensional model of thermal erosion that balances latent heat release with vertical diffusion, but neglects advection and horizontal diffusion [2, 27].
The thermal signature of melt migration should be con-sidered when interpreting heat flow, petrologic, gravity, and seismic data. A perturbation as large as 300 K is likely to affect the chemistry of arc volcanoes [30]. It also significantly affects the solid mantle flow through reduc-tion of mantle viscosity, leading to increased circulareduc-tion in the mantle wedge [29]. Viscosity also affects magma pathways in subduction zones through its effect on the compacting length, focussing magmas from a broader area to beneath the arc volcanoes [20, 31]. Thus, consis-tent with evidence from global systematics [27], coupled mantle–magma flow may well affect the location of arc volcanoes themselves.
Author contributions. D.R.J. and M.T. developed
the one-dimensional melting column model and petrolog-ical model of melting. D.R.J., R.F.K. and J.F.R. devel-oped the two-dimensional thermal model with magma-tism. J.F.R. contributed a single-phase numerical code to compute the thermal structure of a subduction zone, to which D.R.J. added two-phase flow. R.F.K. and D.R.J. compared the model with petrological and heat flow ob-servations. D.R.J. wrote the manuscript with R.F.K., and discussed the manuscript with M.T. and J.F.R. All authors jointly discussed and analyzed the data, results, conclusions, and implications.
Acknowledgements. The authors would like to thank Dan McKenzie and Phil England for comments on an earlier version of this manuscript. We would like to thank the Isaac Newton Institute for Mathematical Sci-ences for its hospitality during the programme Melt in the Mantle which was supported by EPSRC Grant Number EP/K032208/1. D.R.J. acknowledges research funding through the NERC Consortium grant NE/M000427/1 and NERC Standard grant NE/I026995/1. The re-search of R.F.K. leading to these results has received funding from the European Research Council under the European Union’s Seventh Framework Programme (FP7/20072013)/ERC grant agreement number 279925. M.T. received research funding from the Royal Society Newton International Fellowship. J.F.R. thanks the Lev-erhulme Trust for support. The authors would also like to thank the Deep Carbon Observatory of the Sloan Foun-dation.
[1] P. B. Kelemen, J. L. Rilling, E. M. Parmentier, L. Mehl, and B. R. Hacker, “Thermal structure due to solid-state flow in the mantle wedge beneath arcs,” Geophysical Monograph Series138, 293–311 (2003).
[2] A. Perrin, S. Goes, J. Prytulak, D. R. Davies, C. Wil-son, and S. Kramer, “Reconciling mantle wedge thermal structure with arc lava thermobarometric determinations in oceanic subduction zones,” Geochemistry, Geophysics, Geosystems (2016), 10.1002/2016GC006527.
[3] S. C. Penniston-Dorland, M. J. Kohn, and C. E. Man-ning, “The global range of subduction zone thermal structures from exhumed blueschists and eclogites: Rocks are hotter than models,” EPSL428, 243–254 (2015). [4] Y. Furukawa, “Depth of the decoupling plate interface
and thermal structure under arcs,” J. Geophys. Res. – Solid Earth98, 20005–20013 (1993).
[5] C. A. Rychert, K. M. Fischer, G. A. Abers, T. Plank, E. Syracuse, J. M. Protti, V. Gonzalez, and W. Strauch, “Strong along-arc variations in attenuation in the mantle wedge beneath Costa Rica and Nicaragua,” G-cubed 9 (2008), 10.1029/2008GC002040.
[6] R. S. McGary, R. L. Evans, P. E. Wannamaker, J. Elsen-beck, and S. Rondenay, “Pathway from subducting slab to surface for melt and fluids beneath Mount Rainier,” Nature511, 338–340 (2014).
[7] D. P. McKenzie, “Speculations on the consequences and
causes of plate motions,” Geophysical Journal Interna-tional18, 1–32 (1969).
[8] X. Gao and K. Wang, “Strength of stick-slip and creeping subduction megathrusts from heat flow observations,” Science345, 1038–1041 (2014).
[9] M. Schmidt and S. Poli, “4.19 - Devolatilization during subduction,” in Treatise on Geochemistry (Second Edi-tion), edited by H. D. Holland and K. K. Turekian (El-sevier, Oxford, 2014) 2nd ed., pp. 669–701.
[10] S. M. Peacock, “Numerical simulation of metamorphic pressure-temperature-time paths and fluid production in subducting slabs,” Tectonics9, 1197–1211 (1990). [11] G. A. Spinelli, I. Wada, J. He, and M. Perry, “The
ther-mal effect of fluid circulation in the subducting crust on slab melting in the Chile subduction zone,” EPSL434, 101–111 (2016).
[12] D. P. McKenzie, “The generation and compaction of par-tially molten rock,” J. Petrol.25, 713–765 (1984). [13] J. F. Rudge, D. Bercovici, and M. Spiegelman,
“Disequi-librium melting of a two phase multicomponent mantle,” Geophysical Journal International184, 699–718 (2011). [14] N. M. Ribe, “The generation and composition of partial
melts in the earth’s mantle,” EPSL73, 361–376 (1985). [15] P. D. Asimow and E. M. Stolper, “Steady-state mantle–
[16] I. J. Hewitt, “Modelling melting rates in upwelling man-tle,” EPSL300, 264 – 274 (2010).
[17] T. Keller and R. F. Katz, “The role of volatiles in reactive melt transport in the asthenosphere,” J. Petrol. (2016), 10.1093/petrology/egw030.
[18] R. F. Katz, M. Spiegelman, and C. H. Langmuir, “A new parameterization of hydrous mantle melting,” G-cubed4 (2003).
[19] P. E. van Keken, C. Currie, S. D. King, M. D. Behn, A. Cagnioncle, J. He, R. F. Katz, S.-C. Lin, E. M. Par-mentier, M. Spiegelman, and K. Wang, “A community benchmark for subduction zone modeling,” Physics of the Earth and Planetary Interiors171, 187 – 197 (2008). [20] C. R. Wilson, M. Spiegelman, P. E. van Keken, and
B. R. Hacker, “Fluid flow in subduction zones: The role of solid rheology and compaction pressure,” EPSL 401, 261 – 274 (2014).
[21] P. England, R. Engdahl, and W. Thatcher, “Systematic variation in the depths of slabs beneath arc volcanoes,” GJI156, 377–408 (2004).
[22] E. M. Syracuse and G. A. Abers, “Global compilation of variations in slab depth beneath arc volcanoes and im-plications,” G-cubed7(2006), 10.1029/2005GC001045. [23] M. Manga, M. J. Hornbach, A. Le Friant, O. Ishizuka,
N. Stroncik, T. Adachi, M. Aljahdali, G. Boudon, C. Bre-itkreuz, A. Fraass, A. Fujinawa, R. Hatfield, M. Jutzeler, K. Kataoka, S. Lafuerza, F. Maeno, M. Martinez-Colon, M. McCanta, S. Morgan, M. R. Palmer, T. Saito, A. Sla-gle, A. J. Stinton, K. S. V. Subramanyam, Y. Tamura, P. J. Talling, B. Villemant, D. Wall-Palmer, and F. Wang, “Heat flow in the Lesser Antilles island arc and adjacent back arc Grenada basin,” G-cubed 13(2012), 10.1029/2012GC004260.
[24] D. D. Blackwell, R. G. Bowen, D. A. Hull, J. Riccio, and J. L. Steele, “Heat flow, arc volcanism, and subduction in northern oregon,” J. Geophys. Res. – Solid Earth87, 8735–8754 (1982).
[25] V. Vacquier and R. P. Von Herzen, “Evidence for connec-tion between heat flow and the mid-atlantic ridge mag-netic anomaly,” J. Geophys. Res. – Solid Earth69, 1093– 1101 (1964).
[26] A. Reymer and G. Schubert, “Phanerozoic addition rates to the continental crust and crustal growth,” Tectonics 3, 63–77 (1984).
[27] P. C. England and R. F. Katz, “Melting above the an-hydrous solidus controls the location of volcanic arcs,” Nature467, 700–703 (2010).
[28] J. A. Crisp, “Rates of magma emplacement and vol-canic output,” Journal of Volcanology and Geothermal Research20, 177–211 (1984).
[29] P. E. van Keken, B. Kiefer, and S. M. Peacock, “High-resolution models of subduction zones: Implica-tions for mineral dehydration reacImplica-tions and the trans-port of water into the deep mantle,” G-cubed3(2002), 10.1029/2001GC000256.
[30] S. J. Turner, C. H. Langmuir, R. F. Katz, M. A. Dungan, and S. Escrig, “Parental arc magma compositions dom-inantly controlled by mantle-wedge thermal structure,” Nature Geosci.9, 772–776 (2016).
SUPPLEMENTARY MATERIAL
I. PETROLOGICAL MODEL OF HYDROUS FLUX MELTING
In our melting column model, we use a simple petrolog-ical model of hydrous flux melting, which is the dominant form of melting in subduction zones. The model is devel-oped as follows. First, we restrict attention to a ternary system. The three components should not be thought of as identifiable minerals but rather as idealized com-ponents chosen to capture the physics in which we are interested. We start with two components that can be considered ‘refractory’ and ‘fertile’ [14, 16]. To this sys-tem, we add a third component to represent volatiles. We initially will take this component to be ‘water.’ It must be understood that our model will only be valid in the case that the concentration of the ‘water’ component is relatively small. The main role of this third hydrous component is to depress the solidus temperature.
Our second simplification is to use a linear phase di-agram. This can be thought of as a linearization of the ternary phase loops used by Keller and Katz [17] about some initial composition at the bottom of the melting column.
Our third simplification is that the melting/freezing reactions happen sufficiently rapidly that a partially molten region is at thermodynamic equilibrium. This implies that compositions of the solid and liquid phases are controlled directly by the phase diagram.
A. Mathematical description of phase diagram
The solidus temperature increases with increasing pressure at a rate γ. We linearize the dependence of the solidus on chemical composition. Since the sum of the concentrations of the components is unity, we need only specify 2 linear coefficients M2, M3 for the fertile
and water components respectively, both of which lower the solidus temperature. Thus the solidus temperature
Ts=Ts0−ρgz/γ−M2cs2−M3cs3. (5)
This expression can be rearranged to give, for example, the solidus concentrationcs2as a function of temperature,
depth, and concentration of the third component. An in-terpretation of equation (5) can be made by identifying Ts0−ρgz/γ with the solidus temperature of the
refrac-tory component at given depthz, which is this section is negative.
We assume that the liquidus concentration is related to the solidus concentration as follows
cl2=cs2+ ∆c2, (6)
cl3=cs3+ ∆c3. (7)
For the simplest case we take ∆c2,3to be constants, but
we will also consider generalizations.
B. Choice of parameter values and implications for melting
We choose parameters in our model to constrain the degree of so-called ‘batch melting’ as a function of tem-perature and pressure:
F =cf0j−c s j cl
j−c s j
. (8)
Batch melting refers to the degree of melting experienced by a sample raised to given temperature and pressure conditions assuming no extraction of melt from the batch or sample. The composition cf0j is the composition of the solid mantle before the onset of melting. We then combine equations (5)—(7), which apply for eachj, with equation (8) to obtain
F = cf03−c s
3
∆c3
= T−Ts0+ρgz/γ+M2cf02+M3cf03 M2∆c2+M3∆c3
.
(9) A key quantity is the isobaric productivity ∂F/∂T. If ∆c2 and ∆c3 are constants, then the isobaric
productiv-ity is a constant
∂F ∂T =
1
M2∆c2+M3∆c3
. (10)
Thus melt is produced at a constant rate with increasing temperature. Linear models of two component melting already include this effect [e.g. 16].
In this formulation, volatiles do indeed depress the solidus temperature. However, as well as depressing the solidus, volatiles are also associated with a ‘low-productivity tail.’ The initial melting above the solidus temperature is less productive than later melting:
∂F ∂T F=0 < ∂F ∂T F=1 . (11)
The purely linear model does not satisfy this constraint, because the productivity is constant. Therefore, we gen-eralize our model to allow for a low-productivity tail. Volatiles are incompatible, and partition into the melt with a partitioning coefficientD defined by
cs3=Dcl3⇒∆c3=cs3(1/D−1), (12)
where D 1 for volatile elements. We assume that D is constant. However, ∆c3 is no longer constant, instead
depending on composition, and hence pressure and tem-perature. Upon a little rearrangement, we find
T−(Ts0−ρgz/γ−M2cf02−M3cf03) = (M2∆c2/∆c3+M3)(cf03−c
s
3), (13)
which can be rearranged to give a quadratic equation for cs3, recalling that ∆c3 is proportional tocs3. The degree
so there is no computational difficulty, unlike more com-plex nonlinearities where iterative methods are required to solve forF). We can calculate the isobaric productiv-ity atF = 0 andF = 1 and find
∂F ∂T F=0
= [M3cf03(1/D−1) +M2∆C2]−1, (14)
∂F ∂T F=1
= [M3cf03D(1−D) +M2∆C2] −1
. (15)
We can interpret the effective isobaric productivity of the mixture as the harmonic mean of productivities associ-ated with the fertile and volatile component. Typically, the contribution of the volatile component dominates at smallF and the fertile component dominates at largeF because
M3cf03D(1−D)M2∆C2M3cf03(1/D−1). (16)
Our formulation thus achieves the low-productivity tail expected physically and recovers the fertile-refractory system in the absence of volatiles.
To summarize, the degree of melting increases over the temperature range
T(F = 0) =Ts0−ρgz/γ−M2cf02−M3cf03, (17)
T(F = 1) =Ts0−ρgz/γ−M2cf02+M2∆c2−M3Dcf03. (18)
The gradient of the functionF(T) at these endpoints is given by equations (14), (15).
Thus a quite limited number of parameters can de-scribe a significant range of realistic melting behaviours, as shown in Fig. 5. For the anhydrous fertile-refractory part of the system, we useTs0= 1100◦C,ρg/γ= 4.5×
10−3 ◦C/m, M2= 700◦C, ∆c2 = 0.6, and cf02 = 0.15.
This ensures that we match the anhydrous melting curve of Katz, Spiegelman, and Langmuir [18], particularly around 3 GPa. For the hydrous part of the system, we use M3= 2×10⁵ ◦C, D = 0.01. This choice of
param-eters was chosen to roughly match the hydrous melting curve of Katz, Spiegelman, and Langmuir [18], particu-larly around 3 GPa with 0.5 wt% water. Although the precise parameter values are in the right region for con-sistency with previous studies and their associated exper-imental libraries, as well as inferences from field obser-vations, this parameterization is too simple to reproduce all the features observed experimentally. However, it can reproduce the two main features: solidus depression and a low-productivity tail.
C. Generalized model: accounting for saturation in water
[image:8.612.320.564.53.274.2]The addition of more water does not indefinitely lower the solidus, because eventually water becomes saturated in the liquid phase. The amount of water that dissolves
FIG. 5. The degree of meltingF as a function of tempera-tureT at increasing water concentration. Other parameters were fixed, namely Ts0−ρgz/γ= 1550◦C at z= 100 km,
M2= 700◦C, M3= 2×10⁵ ◦C, D = 0.01, ∆c2 = 0.6, and
f
c02= 0.15. These numbers are motivated by Katz, Spiegel-man, and Langmuir [18].
increases with pressure, and Katz, Spiegelman, and Lang-muir [18] use the formula
XHsat20= 12.00P0.6+ 1.00P, (19)
where the pressureP is measured in GPa. This is well constrained by experiment below 2 GPa, and constrained indirectly at higher pressures. This corresponds to a critical degree of melting and critical temperature be-low which the degree of melting drops rapidly to zero, as shown in Fig. 6c, for example.
Our modelling approach is to mimic this behaviour by modifying the phase diagram. We first compute the corresponding critical solid saturation point cs
sat, using
equation (19) for the liquid saturation, and the partition coefficient of equation (12). For temperatures below this point, we change the freezing point depression coefficient:
Ts=Ts0−ρgz/γ−M2cs2−M4(cs3−c
s
sat)−M3cssat, (20)
whereM4≤M3. Note that the previous model is a
spe-cial case M4 = M3, and a eutectic-like phase diagram
can be obtained by the special caseM4= 0. In practice,
we findM4 =M3/50 makes a decent approximation to
Katz, Spiegelman, and Langmuir [18], as shown in Fig. 6. This means that the initial productivity nearF= 0 is a factorM3/M4= 50 times greater. We will use this
FIG. 6. The degree of melting F(T) produced by our re-vised model (solid black) and the parameterization of Katz, Spiegelman, and Langmuir [18] (dashed red). Results com-puted at fixed pressure (3 GPa) at increasing water content: (a)cf03= 1×10⁻³, (b)cf03= 3×10
−3
, and (c)cf03= 5×10⁻³. Note the kink in the curves around 950◦C in (b,c), which is associated with water saturation. Without this saturation be-haviour, the standard model predicts melting at several hun-dred degrees cooler temperatures (dashed blue curves).
II. FURTHER DETAILS OF ONE-DIMENSIONAL COLUMN MODEL
In the context of a one-dimensional melting model, conservation plays a strong role in constraining the model behaviour in steady state. We adopt an extended Boussi-nesq approximation in which we neglect density differ-ences between the phases except for their role in driving fluid flow buoyantly. There are several equivalent ways to present the following equations; we approach the prob-lem by considering conservation in the liquid phase and in the two-phase composite.
Mass conservation gives
d dz(φw
l ) =Γ
ρ, (21)
d
dzw= 0, (22)
wherex=xs(1−φ) +xlφdenotes an average over the solid and liquid phases, with volume fractions (1−φ) andφrespectively. The vertical velocity isw, volumetric melting rate is Γ and density is ρ. We first integrate equation (22) to obtain
φwl
W0
+(1−φ)w s
W0
= 1, (23)
whereW0is the volume flux at the bottom of the melting
column (which is not the motion of the solid phase alone, unlike in upwelling mantle columns used in the context of mid-ocean ridge magmatism). We follow the approach of Ribe [14] and define the quantityF=φwl/W
0. Thus
the scaled liquid phase volume flux isF and the scaled solid phase volume flux is (1−F).
We can recover our previous definition ofFin equation (8) by considering conservation of species mass. For each componentj= 1,2,3,
d dz(φw
lcl j) =
Γj
ρ , (24)
d
dzwcj = 0. (25)
Note that, by summing equation (24) over j and com-paring with equation (21), P
jΓj = Γ. We integrate equation (25) and use equation (23) to obtain
F clj+ (1−F)csj = W0c0j
W0
≡cf0j. (26)
We then determine the degree of melting F, which is controlled by an energy equation and our phase di-agram. One unusual feature of subduction zones is the non-monotonic temperature profile, which is largely con-trolled by the flow of the solid mantle. We use a steady energy balance for a one-dimensional column
ρcpW0 dT
dz =−LΓ + d dz
ρcpκ
dT dz
+ρcpΨ, (27)
with a volumetric source termρcpΨ that represents hor-izontal advection and diffusion of the background solid flow. In the absence of melting, the final pair of terms on the right-hand side establishes a non-monotonic tem-perature profile.
Next we observe that W0F0 = Γ/ρ and F0 is
FIG. 7. Stefan number St = (L/cp)∂F/∂T at P = 3 GPa with and without modified phase diagram to account for water saturation, as discussed in section I C. Note that there is now a small segment of higher productivity between the solidus temperature and the temperature at which the melt becomes saturated.
melting column), and the source term by κ/H2. The
dimensionless parameters involved are a P´eclet number Pe = HW0/κ, a Stefan number St = (L/cp)∂F/∂T, a
temperature change ∆TH = ρgH/γ. Then the energy equation is
T00=−Ψ + Pe [T0(1 + St ) + St ∆TH], (0≤z≤1). (28) A scaled version of the melting rate is
e Γ≡ H
2
κ Γ ρ = Pe
∂F ∂T(T
0+ ∆TH), (29)
which has units of degrees Kelvin. Equation (28) is sub-ject to boundary conditions onT atz= 0 andz= 1. In general, the P´eclet number is fixed but the Stefan num-ber depends on temperature and pressure (hence depth), as well as the compositional parameters of our melting model. We plot the Stefan number in Fig. 7.
Our experimental approach is as follows. Extract a ver-tical temperature profileTref.from a single phase mantle flow thermal model of a subduction zone, as shown in Fig. 8. We then calculate Ψ =−Tref00 .(z). To investigate the effect of melting, we solve the dimensionless energy equa-tion, focussing on the effect of varying the P´eclet number and Stefan number (since the decompression term ∆TH is well known).
[image:10.612.327.547.56.215.2]We show a set of typical results in the main arti-cle. The main physical mechanism giving rise to this temperature signal is the fluid advection term in equa-tion (28). Indeed, the latent heat of freezing/melting is
FIG. 8. Reference temperature fieldTref.from the benchmark of van Kekenet al.[19]. The dip angle, slab velocity and thick-ness of the overriding plate are prescribed. The solid velocity in the mantle wedge is calculated and coupled to the temper-ature through the tempertemper-ature-weakening viscosity. We show only a subset of the full computational domain, which is 660 km wide and 600 km deep.
rather small and can be neglected. In Fig. 7 we see that S <0.1 throughout the temperature range encountered (Tref.≤1250◦C), and in Fig. 9 we show that neglecting latent heat makes very little difference to the temperature profiles. One possible concern with this conclusion is that our standard phase diagram does not have an increased region of productivity associated with saturation of the melt phase, as discussed in section I C. This increased productivity corresponds to a significantly increased Ste-fan number for temperatures between the solidus temper-ature and the tempertemper-ature at which the melt is saturated in water (Fig. 7). However, this increased productivity only occurs over a narrow temperature range and is not significant in changing the thermal profile predicted (Fig. 9).
III. FURTHER DETAILS OF TWO-DIMENSIONAL THERMAL MODEL
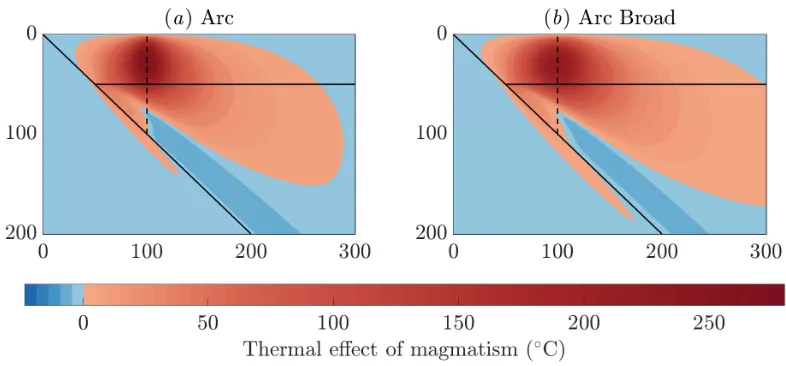
Sources of fluids in subduction zones are believed to be localized to particularly depth ranges, associated with particular dehydration reactions in the subducting slab. Thus, in addition to the calculations presented in the main article, we also take three Gaussian fluid flow pro-files associated with the major dehydration reactions of the slab, with a position, magnitude and width suggested by Wilson et al. [20]. We also consider the effect of all three sources combined.
FIG. 9. Thermal structure is not significantly affected by latent heat release. We show temperature change with varia-tions to the reference form of latent heat release in the energy equation (28) at fixed Pe = 1. Units are (◦C). Note that the Stefan number St = (L/cp)∂F/∂T. Other parameters are as in Fig. 7.
the most thermally significant, raising temperatures by over 200 K. Fluid flow associated with the MORB source (b) raises temperatures near the trench by about 40 K; the gabbro source (c) is thermally insignificant. The peri-dotite source is strongest because it is associated with the largest fluid flow. The gabbro source is especially weak because it is rather narrower than the other sources, and so tends to diffuse laterally more strongly. The combined set of sources (d) is dominated by the peridotite source, although there are also slightly elevated temperatures in the fore-arc region associated with the MORB source.
We next consider the physical mechanisms that affect the thermal perturbation associated with magmatism. For all these calculations we return to the arc case with reference magma flux from the main article.
First, we show that the total amount of magma flux is more significant that the width of the source. In Fig. 11, we show that similar temperatures are found with the same total flux but very different widths. The width of the thermal response is controlled primarily by the balance between advective heat transport by the magma and thermal diffusion.
Second, we consider the effect of the coupling between the solid velocity and the temperature field through the temperature-weakening viscosity. We perform semi-decoupled calculations in which the solid velocity is fixed at the reference conditions associated with the reference temperature field (i.e., that without magmatism). In Fig. 12, we show that the fully coupled calculations are sub-stantially warmer than the semi-decoupled calculations.
The mechanism behind this change is the increased cir-culation in the mantle wedge, leading to increased heat transport, shown in Fig. 13. The effect of coupling is more pronounced with smaller plate thickness, because there is a larger region of mantle flow where the viscosity is reduced, leading to faster circulation.
FIG. 12. Effect of changes in solid flow and plate thickness. We perform experiments in which we vary the thickness of the overriding plate (either 50 km or 80 km) and whether the solid flow is coupled to the perturbed temperature field (or just the reference field) denoted C (coupled) or DC (semi decoupled).
[image:14.612.117.499.481.671.2]
![FIG. 3.Elevated heat flow in subduction zones associatedwith melt migration is consistent with observed ranges [23–25] in oceanic and continental subduction zones](https://thumb-us.123doks.com/thumbv2/123dok_us/9015550.398205/4.612.54.298.251.553/elevated-subduction-associatedwith-migration-consistent-observed-continental-subduction.webp)

![FIG. 6.The degree of melting F(T) produced by our re-vised model (solid black) and the parameterization of Katz,Spiegelman, and Langmuir [18] (dashed red)](https://thumb-us.123doks.com/thumbv2/123dok_us/9015550.398205/9.612.51.280.69.437/degree-melting-produced-solid-parameterization-spiegelman-langmuir-dashed.webp)