ISSN Online: 2160-0481 ISSN Print: 2160-0473
DOI: 10.4236/jtts.2019.93023 Jul. 23, 2019 354 Journal of Transportation Technologies
Quantifying the Influence of Road Geometric
Parameters on Road Safety (Case Study:
Hawassa-Shashemene-Bulbula Rural Two-Lane
Highway, Ethiopia)
Mandefro Terefe Abebe
Department of Civil Engineering, Hawassa University, Hawassa, Ethiopia
Abstract
Road safety depends on humans, vehicles, and highway conditions. These factors influence road safety separately or in combination. Despite these facts, the police report indicated that only a single cause of accident has been re-ported for a given accident in Ethiopia and the number of accidents that had been caused by road defect accounted around 1% of total accidents per year, which underestimates its contribution to road accidents. Beside these facts, only a few studies were carried out in Ethiopia on this issue. Even though dangerous road segments were identified and ranked along the same study area of this paper in our previous publication, Hawassa-Shashemene-Bulbula two-lane rural highway, the influences of road geometric parameters on road safety were not correlated along this study area. Therefore, it is imperative to clarify the relationship between the expected number of traffic accidents and the geometric conditions of the road under study to reduce accidents and provide safe driving environment. The main objective of this study was to quantify the influence of road geometric parameters on road safety. Using historical accident data, traffic data, and road data, the expected numbers of accidents were estimated by using the empirical Bayes (EB) method. Then, the expected numbers of accidents have been correlated with one or more road geometric parameters at a time. Accordingly, the identified dangerous road segments in the previous publication (DOI: 10.4236/jtts.2018.83009) were further analyzed to estimate the influence of road geometric parameters on road safety based on expected accident frequency. The result of the analy-sis shows that the radius of horizontal curve, superelevation, transition curve length, lane and shoulder widths were negatively correlated with the expected frequencies of accidents. Whereas the numbers of horizontal and vertical How to cite this paper: Abebe, M.T.
(2019) Quantifying the Influence of Road Geometric Parameters on Road Safety (Case Study: Hawassa-Shashemene-Bulbula Rural Two-Lane Highway, Ethiopia). Jour-nal of Transportation Technologies, 9, 354-380.
https://doi.org/10.4236/jtts.2019.93023
Received: December 20, 2018 Accepted: July 20, 2019 Published: July 23, 2019
Copyright © 2019 by author(s) and Scientific Research Publishing Inc. This work is licensed under the Creative Commons Attribution International License (CC BY 4.0).
DOI:10.4236/jtts.2019.93023 355 Journal of Transportation Technologies curves per segment, grade of the road, the occurrence of left turn horizontal curves with down grade and right turn horizontal curves with upgrade were positively correlated with the expected number of accidents. Therefore, it has been concluded that the influence of road geometry has significant effect on the occurrence of accidents along this study area.
Keywords
Road Geometric Parameters, Expected Number of Accidents
1. Introduction
The very high cost of highway accidents paid by societies around the world makes highway safety improvement an important objective of transportation engineering. Highway engineers are usually interested in identifying road and traffic factors (which includes pavement condition, road geometry and its en-vironmental, lane and shoulder width, number of traffic and its composition) to improve roadway design for new roads and provide a safer driving envi-ronment for existing roads. The occurrence of road accident is usually caused not only by a single factor rather due to the convergence of a series of events. A framework for relating the series of events in a road crash to the categories of crash-contributing factors is the Haddon Matrix [1]. According to this ma-trix, the factors that may cause to road crashes are generally categorized into three types, such as: 1) Human Factors, 2) Vehicle Factors, and 3) Road-way/Environment Factors. According to the Highway Safety Manual (HSM) [2], three percent (3%) of road crashes have been occurred due to only roadway fac-tors, but thirty-four percent (34%) of road crashes have been occurred due to the combination of roadway, vehicle and human factors. In relation to this, Berhanu [3] cited (Downing et al., 1991) the cause of road accidents that were identified by the police in ten developing countries and the UK. The report indicated that the sum of the causes of accidents in UK only exceeds 100% (accounted 131%) owing to more than one identified causing factors of accidents.
Accidents are rarely caused because of one single factor; therefore, a mul-ti-disciplinary approach is essentially needed to understand the problems and provide better and appropriate solutions. According to Berhanu’s study in Ethi-opia [3], traffic police officer usually reported what they consider the primary cause of road accident for a given accident. Accordingly, the police indicated a single cause of accident but they failed to list multiple factors involved as on-the-spot investigations of individual accident. Furthermore, his study indi-cated that due to road defect only 1% of total accidents were reported in Ethi-opia. This was because of the police report provided some insight into what the police considered as the major factor involved in road accident.
acci-DOI: 10.4236/jtts.2019.93023 356 Journal of Transportation Technologies dents were occurred in Ethiopia between 2008/09 and 2012/13, which underes-timate its contribution to road accidents. This is may be due to the fact that the police officer did not identify the road factors as the cause of traffic accidents. Moreover, this was not because the road condition in Ethiopia was absolutely safe, but this was due to lack of some aspects of relationship between road and traffic engineering factors and traffic accidents. Contrary to this problem, how-ever, only few studies were carried out in Ethiopia, in this regard, the Berhanu’s dissertation on the effect of road and traffic factors on road safety in the selected main road sites and junctions in the city of Addis Ababa and along Addis Ab-aba-Nazareth (or Adama) two-lane rural road in 2000 could be worth mention-ing. In addition to this, even though dangerous road segments have been identi-fied and ranked on Hawassa-Shashemene-Bulbula two-lane rural highway with total length of 64.5 km, in our previous publication [4], the influence of road section parameters on road safety have not been correlated along this study area even by any other study. Therefore, due attention should be given to identify the broader underlying inter-related factors contributing to the rising magnitude and burden of road traffic accidents in Ethiopia.
The main focus of this study was to quantify the influence of road geometric parameters on road safety for, especially, the identified and ranked dangerous road segments in the previous study. Accordingly, the safety level of each read segment was quantified by using empirical Bayes (EB) method and then corre-lated with road geometric parameters along this study area. Accordingly, it tried to fill the gap of knowledge by using state of the art approach called EB method, which integrate risk factors associating to the influence of road, traffic related factors and historical accident data to quantify the safety level of the road instead of using only historical accidents. Moreover, the estimation of road safety by us-ing EB method considers the random nature of accidents and correct regres-sion-to-the-mean bias. To this end, the findings of this study believed to be use-ful for further implementation of the road safety measures as effective as possible to provide a safer driving environment, to improve roadway design while the concerned authority designs a new road, and a baseline for similar studies. Fur-thermore, it gives some lesson for the client of the road and also any road agen-cies while they plan, design and implement any road safety engineering activities because most road agencies in Ethiopia have used traditional approaches, like frequencies and severities of short term accidents, to analyze the safety of the road.
2. Literature Review
DOI:10.4236/jtts.2019.93023 357 Journal of Transportation Technologies
2.1. Road Geometric Parameters
A study in Sweden by Elvik [5] indicated that the length of the curve, the curve radius, whether spiral transition curves are used, and the super-elevation of the roadway affects the safety along a horizontal curve. Accordingly, for a given curve deflection, crashes are more likely on curves with a smaller radius; spiral transitions decrease crashes; and insufficient super-elevation increases crashes. Other studies indicated that radius of path, curve length of path, number of curves in the path, number of horizontal curves that are very close to each other and interference of horizontal and vertical curves have significant roles in the occurrence of accidents [6][7][8]. Other studiesss also revealed that the crash frequency increased as the horizontal curve radius decreased, the length of the vertical curve increased, and the sharpness of the vertical curve increased [9]. The following section describes the effect on safety of improving the characteris-tics of the road’s horizontal and vertical alignment and their combination, as well as cross-sections characteristics.
According to the cited research findings by Elvik [5], the accident rates on ho-rizontal curves are up to four times higher than tangent sections. Sharp hori-zontal curves tend to have higher accident rates than flatter horihori-zontal curves. Grade sections generally have higher accident rates than level sections; steep grades have higher accident rates than mild grades, and downgrades have higher accident rates than upgrades. Poor sight distances are associated with traffic ac-cidents. The provision of transition curves and super-elevation as per the design standard on horizontal curves and speed consistency in the alignment of the road are vital in order to enhance road safety [3].
2.1.1. Horizontal Curve Elements
DOI: 10.4236/jtts.2019.93023 358 Journal of Transportation Technologies Transition curves (clothoides): A clothoides eliminate the need for abrupt movements in order to negotiate the curve and therefore to enhance safety [13]. Accordingly, transition curves are a requirement only for trunk and link road segments having a design speed of equals to or greater than 80 km/hr for Ethio-pian roads. Elvik [5] reviewed one study in America, by Zegeer et al. 1991, that the effect of constructing transition curves in the form of clothoides reduces the number of accidents by 10% (lower 95% limit 15%, upper 95% limit 7%). On the other hand, a few studies concluded that transition curves were dangerous be-cause of driver underestimation of the severity of the horizontal curvature [14] [15].
Super-elevation: According to several studies, super-elevation is defined as a road’s transverse incline toward the inside of a horizontal curve in order to counteract the centrifugal force and increases the safety performance of highway sections as well as the riding comfort [8][10]. As stated in [11][16], the lowest “safe radius” can be computed by using the maximum allowed super-elevation and a “conservative” value for the side friction for various design speeds. As per the cited studies in [10], it was study found that the number of accidents on wet pavements to be abnormally high in curves with a super-elevation of less than 2%. Other study reported that improving the super-elevation reduces the num-ber of accidents by 5% to 10%.
2.1.2. Vertical Curve Elements
Gradients: Studies indicated that accidents occur more frequently on gra-dients than on level sections [17]. Elvik [5] showed that reducing gradient re-duces the number of accidents. The effect was greater for the steepest gradients and decreases thereafter. Other study indicated that the accident frequency in-creased with gradient and down-gradients have considerably higher crash rates than up-gradients [8]. As Elvik demonstrated, on up-gradients stretches, the ac-cident rate was around 7% lower than for similar down-gradients stretches (lower 95% limit 13%, upper 95% limit 0%).
2.1.3. Horizontal and Vertical Curves
DOI:10.4236/jtts.2019.93023 359 Journal of Transportation Technologies Combination of horizontal and vertical alignment: An inefficient combi-nation of horizontal and vertical alignments may lead to road safety problems, even when the horizontal and the vertical alignment are separately correct and constructed according to the guidelines [10]. In addition, poor coordination of horizontal and vertical alignments can create locations where the available sight distance drops below the required sight distance [21]. In particular, the coinci-dence of a horizontal and a crest vertical curve may, under certain conditions, lead to significant limitation of the available sight distance and prevent the prompt perception of the curve. Similarly, the coincidence of a horizontal and a sag vertical curve may create a false impression of the degree of curvature (i.e. the horizontal curve may seem to have a higher radius than the actual), and may contribute to increased accident rates [22][23]. The result of one study indicated that short horizontal curves at sharp sag vertical curves and short horizontal curves at sharp crest vertical curves have been associated with higher crash fre-quencies [9].
2.1.4. Lane and Shoulder Width
Lane and shoulder width: According to HSM [2], run-off the road and op-posite direction accidents are the primary accident types affected by lane or shoulder width or both. These accident types decrease with both increasing lane width and shoulder width; however, the marginal effect of their increment dimi-nishes as either the base lane width or the base shoulder width increases [8]. Furthermore, HSM indicated that the base lane width is 3.66 m and the base shoulder width equals to 1.83 m.
Berhanu [3] reviewed two studies on two-lane low volume rural roads in USA that 3.0 m lane widths with narrow or no shoulder have higher accident rate than 2.7 m lane width with any shoulder width. As he indicated, this was due to the reason that wide carriageway may encourage lane changing maneuvers and/or higher speeds. In contrast, 3.3 m and 3.6 m lane widths, in general, have significantly lower accident rates than that of 3.0m lane width. He also summa-rized the result of other studies that for 3.0 m lane, a shoulder of 1.5 m or greater appears to affect the accident rate significantly; however, for 3.3 m and 3.6m lanes, shoulders of 0.9m or greater can significantly be effective in accident re-duction.
DOI: 10.4236/jtts.2019.93023 360 Journal of Transportation Technologies maneuvers such as over taking despite of oncoming traffic. Moreover, it has been justified that the higher speed on wider lanes could lead to more accidents.
One study evolved Poisson regression model for traffic accidents on two lane rural highways under mixed traffic conditions showed that shoulder width had negative sign, which indicates that increasing shoulder width decreases the acci-dent frequencies [27]. According to Elvik [5], rural roads with hard shoulders (which are usually 0.3-1 meters wide) have an accident rate which is around 5% - 10% lower than roads without hard shoulders. More three studies reviewed by him indicated that increasing the width of hard shoulder by 0.3 meters appears to reduce the number of injury accidents by about 20%, while increasing the width of hard shoulder by around 1m does not lead to statistically significant changes in the total number of accidents (injury and property damage only ac-cidents).
2.2. Comparison of Before-And-After Studies to Estimate the Safety of the Road
According to Hauer [28], three types of before-and-after study methods exist in order to evaluate the safety improvement of a given road site. In this study, only two of them have been discussed here under: 1) Simple or naive before-and-after study method and 2) the before-and-after study with empirical Bayes (EB) me-thod.
Simple before–and–after study method is based on the assumption that the crash experience before improvement of a given road is a good estimate of what would have occurred during the after period without improvement [29]. This method simply compares the observed crash data (frequencies and rate) between before and after period was among the earliest practice. Despite easy to use, such comparison usually leads to inaccurate and potentially misleading conclusion because the method may be affected by several factors, especially in case when only short-term data, 2-3 years, are available as cited in several literatures [29] [30][31]. One of them is its lack of flexibility to account for the effect of change in traffic volume of crash occurrence. Another well-known shortcoming is its incapability of addressing regression-to-the-mean (RTM) bias. RTM bias would be occurred due to random fluctuation of accident occurrence at a given location [31]. This makes likely that road sites with high number of accidents in any one year may show a decreasing trend in the subsequent year even without treatment of the road site [30]. Therefore, safety estimate of only accident count, especially the short term, would be considered as biased estimate of the safety of the se-lected sites because the accident count regress towards their true long term mean [29].
DOI:10.4236/jtts.2019.93023 361 Journal of Transportation Technologies problem is generally considered as the most serious. The before-and-after study with the Empirical Bayes (EB) method has been developed to adjust for the regression-to-the mean bias, the effect of change in traffic volume and the time trend for the occurrence of accidents [28]. The method was based on the follow-ing three assumptions:
The number of observed accidents at any site follows a Poisson distribution; The means for a population of systems can be approximated by a gamma
distribution; and
Changes from year to year from different factors are similar for all reference sites.
Based on these assumptions, EB method establishes the foundation for the prediction by estimating what the expected frequency of target crashes in the before period was, and on the basis of this foundation, predict how the expected number of crashes would have changed from the before period to the after pe-riod as a result of changes in traffic, weather, and other factors [29]. According-ly, the concept behind the EB method in mitigating the regression-to-the-mean effect is to predict the number of crashes that would have been expected to have occurred during the after period had the treatment not been implemented. This method estimates the safety of a road by using not only the accident count of a given facility but also based on what is known about the safety of similar such types of facilities, to estimate how many expected accidents would have encoun-tered at the treated site had no improvement been made [2][28][32] [33]. To overcome the problems of naïve method, several studies have proposed mod-el-based or state of the art approach in order to estimate the safety of a given road sites and concludes that empirical Bayes (EB) approach as the most consis-tent and reliable method [2][4] [28][30] [31][32] [33]. Despite its reliability, the application of the EB method is not common due to some reasons indicated in several literatures. As indicated in [2][29][30][33][34], this method is more complex than other methods, needs reliable data (accident count and AADT of each specific site in the most recent years and road geometric data), calibrated Safety Performance Function (SPF) to be fitted purely from the local data, and also trained and experienced personal are required in order to properly imple-ment this method.
3. Materials and Methods
3.1. Description of the Study Area
DOI: 10.4236/jtts.2019.93023 362 Journal of Transportation Technologies well as sustained progress in the agricultural and service sectors. In the last few decades, Ethiopian government focused in the expansion of road infrastructure. Accordingly, the average road network annually raised around 8.5%between 1997 and 2015. In the fall of 2015, Ethiopia comprises a road network totaling about 110,414 km. Expansion of improved road network always push motoriza-tion on the road rapidly and that results in a rapidly increase in road traffic ac-cidents.
This study was conducted in the Oromia regional state along Hawas-sa-Bulbula trunk road particularly within West Arsi Zone territory. Of this road stretches only the rural two-lane two-way, which had not undergone any mod-ification during the period (2012/13-2014/15), has been selected for this study. It is one of the highest standard rural two-lane highway functional class in the country and the designated part of Trans African highway, which connects Cairo in Egypt and Cape Town in South Africa.
In this study, a rural highway is defined in HSM [2] as a highway passing through the non-urban environment i.e. passing through the village (population of not more than 5000 inhabitant) and rural non-settlement areas. According to ERA [13] functional classification, the roads under study is categorized in to trunk roads, which is one of the highest standard two lane rural roads in the country.
3.2. Sources of Data
The data used in this study concern rural two-lane roads and come from two sources:
Primary data: obtained by inspecting and measuring road geometry, roadside hazards and delineation, and field reconnaissance survey to observe the charac-teristics of traffic.
Secondary data: expected number of accidents and other related data obtained from published article [4], road as built drawing and average Annual Daily Traf-fic (AADT) collected from Ethiopian Road Authority (ERA).
3.3. Types of Data
Two types of data have been used in this study, namely road geometric parame-ters and expected number of average accidents, in order to attain the stated ob-jective.
3.3.1. Road Data
DOI:10.4236/jtts.2019.93023 363 Journal of Transportation Technologies Horizontal curve elements considered simultaneously on road safety. These
parameters are:
Radius of horizontal curves (R) were categorized into four ranges of radii: 1) R ≤ 450 meters, 2) 450 ≤ R ≤ 750 meters, 3) 750 ≤ R ≤ 1000 meters, and 4) R ≥ 1000 meters,
Super-elevation, and
Length of the curve, which is the sum of circular and transition curves length. Number of horizontal and vertical curves per 1.5 km segment.
Grade of vertical alignments (G) categorized into three ranges of grades (Accordingly, flat road section (G ≤ 3%), mild (3% < G ≤ 6%) and rolling (G > 6), where G = grade of the road in percent).
Combination of horizontal and vertical alignment (particularly the coinci-dence of right horizontal curve and crest vertical curve and left horizontal curve and sag vertical curve).
Cross-sectional elements (lane width, shoulder width and surfacing), and Others pertinent data such as roadside hazard, sight distance, terrains type,
land use, speed characteristics, non-motorized traffic and pedestrian charac-teristics and others were collected through reconnaissance survey and some interview with traffic police officers.
Preparing the data, the road stretch was divided into short sections of 1.5 km in length based on kilometer post and it has been considered as homogeneous road section since it has the same design standard. In total, 43 road sections (to-tal length = 64.5 km) have been considered and these entire road segments were two-lane two-way rural highway.
3.3.2. Traffic Accident Data
Since the expected number of accidents with the empirical Bayes (EB) adjust-ments have been estimated by using road, three years (2012/13-2014/15) traffic accidents and traffic volumes (in terms of AADT) data in our previous publica-tion [4], it has been used for this research as a secondary data.
3.4. Methods
DOI: 10.4236/jtts.2019.93023 364 Journal of Transportation Technologies may not be precise if the average crash frequency was low; and the geometric, traffic control, land use and other site condition may be changed over time. Therefore, the key advantageous of implementing EB method to evaluate the safety of a given road was to increase precision of estimate, to reduces RTM bias, to use information from the site (short-term accident count) and information from other but similar sites (road geometry, traffic control and other important features) [2][28].
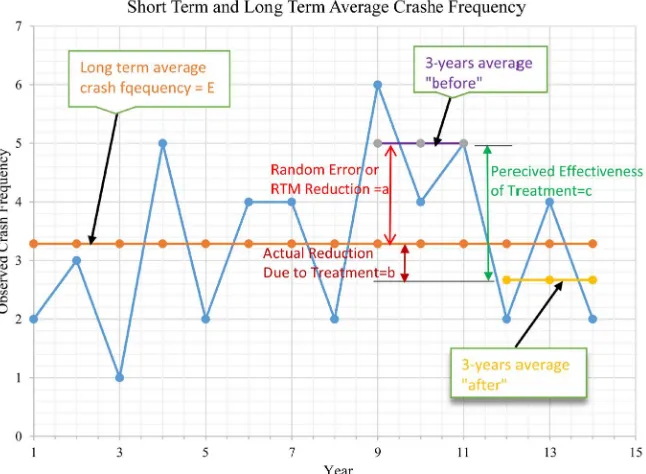
RTM bias would be occurred due to the fact that one is often interested in the safety of a given road sites that either require attention because they seem to have high number of accidents, or merit attention because they have fewer acci-dents than expected [28] [32]. To demonstrate the effect of RTM bias, for in-stance, hypothetical example is illustrated in Figure 1. As the Figure indicated year-to-year fluctuation of observed accidents during consecutive 14-year period for a given site and they range from 1 to 6 in the 3rd and 9th years respectively, with an average of “E” long-term accident counts per year.
[image:11.595.214.537.452.689.2]It can be seen that if someone proposed and implemented a certain counter-measure at the end of 11th year in response to the higher number of 3-years av-erage before accidents, the result would seem that “c” number of accident reduc-tion have been observed when compared with the number of 3-years average af-ter accidents. Even though the treatment may have some effects, parts of acci-dent reduction was due to RTM effects. Accordingly, out of the total reduction of average accident counts, which is equal to “c” as indicates in Figure 1, be-tween 3-years before and after the implementation of countermeasures, around “a” and “b” number of accident reduction were due to RTM effect and actual
DOI:10.4236/jtts.2019.93023 365 Journal of Transportation Technologies reduction due to treatment of the site respectively. As a result, the effectiveness of the treatment would have been overestimated. In general, assuming no safety countermeasures were undertaken, the level of safety may be overestimated or underestimated by an amount equals to short-term (usually 3-years) average minus long-term average accidents. This difference is equal to the amount of random error in the safety estimate. If this random error is significant and posi-tive, one might incorrectly select this location for overestimated countermeasure application. On the other hand, if the random error is negative one might wrongly ignore the location for further countermeasure application [32].
As it has been described in the introduction part, since this study was conducted in the same study area of my previous publication (DOI: 10.4236/jtts.2018.83009) some output results from that article, namely yearly expected average crash frequency with the empirical Bayes EB adjustments, was used as an input of this study. The EB method uses data from the crash history of a treated site, as well as information about the safety of reference sites with similar geometric characteristics. The joint use of the information from treated and reference sites were based on a weighted average of this information [32]. The estimate of the expected number of crashes at the treated site, E(k/K), given the site recorded K crashes, can be estimated by using the following Equations [28]. Furthermore, the detail procedure of how to estimate the EB safety estimate is found in [4].
(
)
( ) (
1)
E k K = ∗w E k + −w ∗K (1)
( )
( )
11
w
Var k
E k
= +
(2)
where, E(k) is the expected number of crashes at reference sites; K is the actual crash count at a treated site; Var(k) is the variance of the expected number of crashes at the reference sites; and w = weight factor, which can also be estimated based on over-dispersion parameter.
The general formula for the accident prediction model, E(k), is composed of three components: 1) base model, 2) accident modification factors, and 3) cali-bration factor as given by [2]. The HSM Safety Performance Function (SPF) for base condition on rural two-lane two-way highway was calibrated for the local condition and also the fitness of SPF with the local data was confirmed in [4] along the same study area of this study. Accordingly, the predicted number of total roadway accidents per year after the application of calibration factor that has been fitted for the local condition and can be estimated by using Equation (3).
( )
(
) ( )
(
)
6 0.321
1.51 AADT 365 10 EXP
AMF1r AMF2r AMFnr
E k = ∗ ∗ L ∗ ∗ − ∗ −
∗ ∗ ∗ ∗ (3)
DOI: 10.4236/jtts.2019.93023 366 Journal of Transportation Technologies (mile); and AMF1r,, AMFnr = accident modification factors for roadway segments. Any differences in geometric and design features from base condition has been modified by AMFs as indicated in [2][4].
The selection of various road section parameters was based on exhaustive li-terature review. Accordingly, in the following section, various road section pa-rameters were examined and assessed, including horizontal and vertical align-ment and their combination, as well as cross-sections characteristics.
4. Results and Discussions
4.1. Observed, Predicted and Expected Number of Accidents for the Ranked Dangerous Segments
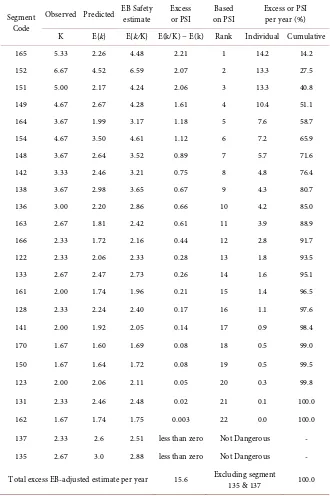
The expected number of accidents (i.e. EB safety estimate), which were esti-mated to be the weighted average of observed and predicted number of acci-dents, for the ranked dangerous road segments are presented in Table 1 [4]. Therefore, in this study to attain the stated objective the safety level of each road segment has been correlated with one or more road geometric parameters at a time.
4.2. Influence of Road Geometric Parameters on Road Safety
Having the identified dangerous road sites or problem locations along the road in the previous study (DOI: 10.4236/jtts.2018.83009), this study established the relationship between the expected number of accidents (i.e. EB safety estimate) and the road characteristics leading to the occurrence of road accidents.
4.2.1. Influence of Horizontal Alignment Elements on Road Safety
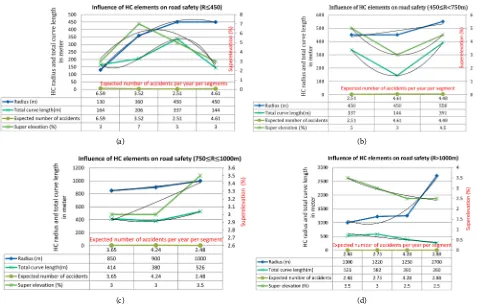
Figures 2(a)-(d) indicate that the influence of horizontal curve (HC) elements such as curve radius, total curve length (which is the sum of circular and transi-tion curve) and super-elevatransi-tion on road safety were considered simultaneously. However, since it is difficult to conduct road safety study under a controlled condition, this paper assumed that when the effect on safety of one road para-meter has been estimated the effects on safety as not additive due to the im-provement of other road parameters. Rather, the contribution of either the joint effect of more than one road parameters or only one road parameter at a time on road safety was computed assuming the other has taken effect.
DOI:10.4236/jtts.2019.93023 367 Journal of Transportation Technologies Table 1. Observed, predicted and expected number of accidents for the ranked dangerous segments.
Segment Code
Observed Predicted EB Safety estimate Excess or PSI on PSI Based Excess or PSI per year (%)
K E{k} E{k/K} E(k/K) − E(k) Rank Individual Cumulative
165 5.33 2.26 4.48 2.21 1 14.2 14.2
152 6.67 4.52 6.59 2.07 2 13.3 27.5
151 5.00 2.17 4.24 2.06 3 13.3 40.8
149 4.67 2.67 4.28 1.61 4 10.4 51.1
164 3.67 1.99 3.17 1.18 5 7.6 58.7
154 4.67 3.50 4.61 1.12 6 7.2 65.9
148 3.67 2.64 3.52 0.89 7 5.7 71.6
142 3.33 2.46 3.21 0.75 8 4.8 76.4
138 3.67 2.98 3.65 0.67 9 4.3 80.7
136 3.00 2.20 2.86 0.66 10 4.2 85.0
163 2.67 1.81 2.42 0.61 11 3.9 88.9
166 2.33 1.72 2.16 0.44 12 2.8 91.7
122 2.33 2.06 2.33 0.28 13 1.8 93.5
133 2.67 2.47 2.73 0.26 14 1.6 95.1
161 2.00 1.74 1.96 0.21 15 1.4 96.5
128 2.33 2.24 2.40 0.17 16 1.1 97.6
141 2.00 1.92 2.05 0.14 17 0.9 98.4
170 1.67 1.60 1.69 0.08 18 0.5 99.0
150 1.67 1.64 1.72 0.08 19 0.5 99.5
123 2.00 2.06 2.11 0.05 20 0.3 99.8
131 2.33 2.46 2.48 0.02 21 0.1 100.0
162 1.67 1.74 1.75 0.003 22 0.0 100.0
137 2.33 2.6 2.51 less than zero Not Dangerous -
135 2.67 3.0 2.88 less than zero Not Dangerous -
Total excess EB-adjusted estimate per year 15.6 Excluding segment 135 & 137 100.0
Source: Abebe, M. T. and Belayneh, M. Z. (2018) Identifying and Ranking Dangerous Road Segments a Case of Hawassa-Shashemene-Bulbula Two-Lane Two-Way Rural Highway, Ethiopia.
1) Radius of the curve up to 450 m.
DOI: 10.4236/jtts.2019.93023 368 Journal of Transportation Technologies (a) (b)
[image:15.595.61.538.69.376.2](c) (d)
Figure 2. (a) Influence of HC radius, total curve length and super-elevation on road safety (R ≤ 450 m); (b) Influence of HC ra-dius, total curve length and super-elevation on road safety (450 ≤ R ≤ 750 m); (c) Influence of HC rara-dius, total curve length and super-elevation on road safety (750 ≤ R ≤ 1000 m); (d) Influence of HC radius, total curve length and super-elevation on road safety (R ≥ 1000 m). Note: (a)-(d) were provided as left vertical axis represent curve radius and total curve length in meters, right vertical axis represents super-elevation in percent and each node along horizontal axis represents expected average frequency of accidents per 1.5 km road segment per year.
a) As shown in Figure 2(a), when all of HC elements such as the radius, total length and super-elevation were increased by 230 m (from 130 to 360), 42 m (from 164 to 206 m) and 4 percentage points (from 3% to 7%) respectively, the frequencies of expected accidents significantly decreased by around87%. This is an indication of improving sharp horizontal curves improve road safety at a greater rate. As noted from an exhaustive literature review by Hauer [18] the number of road accidents increased when the radii of horizontal curves de-creased. This finding is in conformity with findings of previous studies as indi-cated in the literature part.
DOI:10.4236/jtts.2019.93023 369 Journal of Transportation Technologies correlated. This is probably due to the fact that when the length of transition curve increased the curve become flatter and flattening is expected to reduce the number of accidents.
c) In this step, Figure 2(a) shows that at constant radius (R = 450 m), reduc-ing length of the curve by 193 m (from 337 to 144 m) and super-elevation by 2 percentage points (from 5% to 3%), increases substantial amount of accident frequencies and accounted for 83%. This indicates that at a given radius, su-per-elevation and length of horizontal curves were negatively associated with the number of expected accidents within the specified range of radius.
Accordingly, out of 144 m of total length of the shorter curve, circular curve length contributed only 48 m and the remaining 96 m were transition curves length, whereas the longer circular curve contributed 177 m from 377 m of total length (which was the sum of circular and transition curves) and the remaining 200 m was transition curve length. This can be explained by the fact that intro-ducing very short circular curve length for sharper curve (i.e., R ≤ 450 m) HC along a high-speed rural road has a tendency to become a surprise to the drivers because such very short curve length makes the drivers to sense as if only small change in direction or the sharpness of the curve may not be imagined by drivers consequently they cannot reduce their speed accordingly.
Furthermore, increasing transition curve length has two main advantages. Firstly, it is forgiving because it gives more time to reduce the speed. Secondly, it is considered as flattening the curve because when transition curve increased central angle of the curve can also be increased. Therefore, the result indicated that increasing total length of the curve especially the transition part reduces substantial amount of accidents.
In addition to this, it is important to investigate the characteristics of those segments that the curves under investigation were located. The larger curve length HC located within segment 137, which was not included in the list of dangerous segment because it has experienced as much crash as expected from similar such types of roads (Table 1), whereas the shorter curve length HC found along segment 154, which was ranked at 6th places of dangerous segments. This is an indication of the availability of other risk contributing factors within segment 154 in addition to HC elements. Accordingly, in addition to HC ele-ments, narrow culver, three horizontal curves within the segment, and sight dis-tance problem due to inappropriate combination of horizontal and vertical curves were the identified risk contributing road factors along segment 154.
DOI: 10.4236/jtts.2019.93023 370 Journal of Transportation Technologies prediction model in curves located in two-lane suburban roads, indicated that road geometric design variables such as curve radius, curve length, su-per-elevation and others were identified as the contributing factor in the occur-rence of traffic accidents [37]. This indicates that the finding of this paper dis-cussed above is in conformity with findings of previous studies.
2) Radius of the curve in the range of 450 ≤ R ≤ 750 m.
In this phase, as illustrated in Figure 2(b), the safety of the road has been es-timated in two steps.
a) The first step has already discussed in part (1) step (c); therefore, the second step is discussed in the following section.
b) Accordingly, increasing all HC elements such as radius of the curve by 100 m (from 450 to 550 m), length of curve by 247 m (from 144 to 394 m) and su-per-elevation by 1.5 percentage points (from 3 to 4.5%) improves the safety of a road only by 3.0%. At this stage, even though all of the specified HC elements were increased reasonably at a higher rate, the safety of the road improved at a slower rate. This was unexpected result; therefore, further investigation of the characteristics of both segments are required. Accordingly, the smaller radius curve located along segment 154 (which was ranked in 6th position), whereas the larger radius curve found on segment 165 (which was ranked in 1st place).
Moreover, segment 165 has located near to mid-way between the road stretch that connects Hawassa city and Shashemene town with total length of 25 km. This road stretch is characterized as very long tangent and only one sharp hori-zontal curve, which is part of segment 165, is available within this road stretch resulting drivers experience high speed at the tangent section of the road. Fur-thermore, the place where segment 165 located was characterized as high num-ber of non-motorized traffic due to village settlement around the road, sharp curve after long tangent, and inappropriate coordination of horizontal and ver-tical curves in both directions were noted as the most significant characteristics of this hazardous segment. As a result, drivers (especially unfamiliar one) may be surprised and may not be able to negotiate their speed in the tangent section and at the specified curved portion of the road segment. This is also an indica-tion of the chain effect of several road secindica-tion characteristics and traffic related factors make road safety analysis a complex matter.
3) Radius of the curve in the range of 750 ≤ R ≤ 1000 m.
In this phase, the influence of HC elements on road safety was considered in two steps as demonstrated in Figure 2(c).
DOI:10.4236/jtts.2019.93023 371 Journal of Transportation Technologies places). As it has been investigated, in addition to HC elements the result ob-tained in this step was may be due to the effect of other road parameters like lane and shoulder width and number of curves per segment and others along seg-ment 151.
b) Joint increase of radius of curve by 100 m (from 900 to 1000 m), length of curve by 146 m (from 380 to 526 m) and super-elevation by 0.5 percentage points (from 3% to 3.5%) reduce the risk of the road by 71%. Here is also only slight reduction of accidents can be expected as explained in the above para-graph. The result obtained in this step due to the increased values of each HC element was less than the corresponding values in phase-b; however, the per-centage saved amounts of risk was not comparable and exaggerated when it was compared with the results of the previous studies.
Generally, this amount of accident reduction cannot be expected due to the improvement of only the specified HC elements. However, when we see their rank in Table 1 the smaller radius, R = 900 m, curve found along segment 151 (which took the 3rd dangerous place), whereas larger radius, R = 1000 m, curve located within segment 131 (that was ranked in 21st position). This can also be explained by the fact that the effect of the improvement of other road parameters contributed substantial amount of accident reduction when the road section transformed from segment 151 to segment 131. Accordingly, segment 151 was characterized as steep grade, passes through rolling terrain, high number of con-flicts between through vehicles and local traffic because it passes through small town or village, narrow bridge and number of VC per segment.
4) Radius of the curve greater than or equals to 1000 m.
In this phase the influence of HC element on road safety is described in the following three steps as shown in Figure 2(d).
a) Increasing both radius and length of the curve by 220 m (from 1000 to 1220 m) and 56 m (from 526 to 582 m) respectively, but reducing super-elevation by 0.5 percentage points (from 3.5 to 3%) increase the number of accident by 10%. As explained in the literature, due to a few increasing of radius of curve from 1000 m onward a slight increase of accident may be expected. Furthermore, the smaller radius, R = 1000 m, curve found along segment 131 which was ranked in 21st position, whereas the larger radius, R = 1220 m, curve located within seg-ment 133 which was ranked in 14th place. This indicates that the effect of other road parameters like number of VC per segment and lane width were the ex-pected parameters that may have an effect on increasing the number of acci-dents.
DOI: 10.4236/jtts.2019.93023 372 Journal of Transportation Technologies 133 (which consist smaller radius, R = 1220 m, curve) was ranked in 14th place, whereas segment 149 (consist larger radius, R = 1250, curve) was ranked in 4th position. This assures that segment 149 most likely consist of other road para-meters that may have higher risk factor than the characteristics of segment 133. To confirm this, from depth analysis of historical accident data and site in-vestigation, it has been found that more risk indicating road factors such as nar-row bridge and approach road, rolling terrain, and minor junction inside the horizontal curve were observed along segment 149, however, one minor junction outside the curve and mild grade were the observed characteristics of segment 133. Furthermore, traffic police report emphasized that narrow bridge and both approach roads were the most accident-prone location due to sight distance problem and substantial pedestrian movement along segment 149.
c) At constant super-elevation (2.5%), increasing radius of the curve by 1450 m (from 1250 to 2700 m), but reducing curve length by130 m (from 390 to 260 m) improve the safety of the road by 48.0%. The result obtained in this step was also more than the expected value. Despite the fact that increasing the radius of the curve up to 2700 m can be considered as straightening of the curve, this much reduction of accident probably due to the effect of other road parameters. This can be proved that the smaller and the larger radius curves located within segment 149 (ranked at 4th place) and 135 (which was not dangerous segment) respectively. This may be associated with less risk indicating road parameters along segment 135.
4.2.2. Influence of Number of HC Per 1.5 Km Segment Length
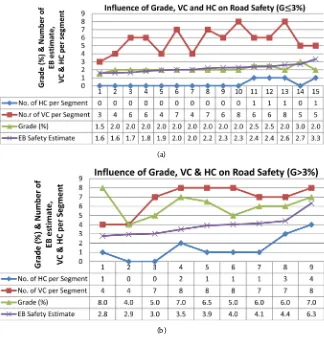
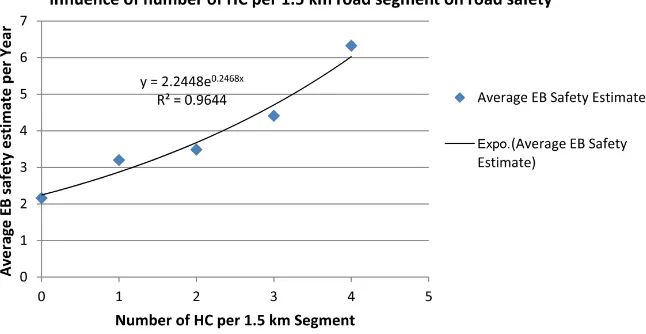
In this paper, it has been tried to estimate the joint effect of more than one road parameter on road safety at a time; however, most of the time it is difficult to differentiate the effect of one road parameter over the other on road safety. For instance, Figure 3(a) and Figure 3(b) are typical example of this problem as the plots have been prepared to estimate the safety of a road due to the joint effect of number of HC and VC per segment and grade of the road (for a grade range of less or equals to 3% and greater than 3% respectively). Even though the Figures, generally, indicate that the expected number of accidents increased with the im-provement of grade, number of HC and VC, it is better to analyze the effect on road safety of each road parameter separately. So that, the effect of the number of HCs per segment on the corresponding average expected frequencies of acci-dents are given in Table 2.
[image:19.595.214.539.676.729.2]The influence of frequencies of HC per segment on road safety were estimated and given in Table 2. The result showed that the highest frequencies of accident exhibited on road segment, which have the highest number of HC (i.e. four
Table 2. Effect of number of HC on road safety.
Number of HC per Segment 0 1 2 3 4
DOI:10.4236/jtts.2019.93023 373 Journal of Transportation Technologies (a)
[image:20.595.211.535.69.411.2](b)
Figure 3. (a) Influence of grade and number of VC and HC per segment on road safety; (b) Influence of grade and number of VC and HC per segment on road safety.
curves per 1.5 km road segment) and the lowest average frequencies of accidents encountered on no curve segment.
DOI: 10.4236/jtts.2019.93023 374 Journal of Transportation Technologies accounted around 43%. The least risk exhibited from one curve to two curves per segment road section and accounted for around 9%.
The following discussion presents the possible reason for each scenario. Ac-cordingly, when the road is straight the driver does not expect sudden sharp curve ahead; therefore, a sharp (i.e. lower radius) curve after a long tangent may increase accident risk due to the fact that significant operating speed variations between tangent and curved section of the road. This is the possible reason why highest percentage increment of accident risk exhibited when a road section changed from no curve to one curve per segment road section. The possible ex-planation for the second highest percentage increment of accident risk was due to the reason that driving task became difficult or driver workload increased when the road section changed from three to four numbers of curves per 1.5 km road segment. When the road section changed from one curve to two curves per segment, on the other hand, the driver experiences or expects there to be addi-tional curves on the road ahead, therefore, they tend to decrease their speed. Consequently, the involvement in accidents increased only by a few percentage. Furthermore, Figure 4 shows that a plot of expected average yearly frequencies of accident (as a dependent y-variable,) verses number of HCs per segment (as an independent x-variable). The plot as indicated by the best-fit regression line shows that exponential function (y = 2.2448 * exp (0.2468x), with R2 = 0.96) was established between the dependent and independent variables under this study area.
4.2.3. Influence of Number of VC per Segment
Table 3 and Figure 5 reveal that when the number of vertical curves (VC) per segment increased the frequencies of accidents also increased except from 5 to 6 numbers of VCs per segment. Furthermore, the rate of increment of frequencies of expected accidents due to consecutive increasing of number of VCs from 3 up to 8 per segment are also shown in Table 3 in similar fashion as that of number of HC per segment. Accordingly, the highest increment of involving in accident risk were observed when the road section transformed from 6 to 7 and 3 to 4 number of VCs per segment and they accounted for around 50 and 42% respec-tively. The probable reasons for these are similar with explanation given in the previous section (i.e., from 3 to 4 VC per segment associated with high speed variation and from 6 to 7 associated with driver workload).
DOI:10.4236/jtts.2019.93023 375 Journal of Transportation Technologies Figure 4. Number of HC against EB safety estimate per year.
Figure 5. Number of VC verses EB safety estimate.
Table 3. Effect of number of VC on road safety.
Number of VC per Segment 3 4 5 6 7 8
Average BE Safety Estimate per Year 1.59 2.26 3.01 2.11 3.16 3.77 Percentage change of EB Safety Estimate 41.98 33.05 -29.92 49.75 19.38
4.2.4. Influence of Grade
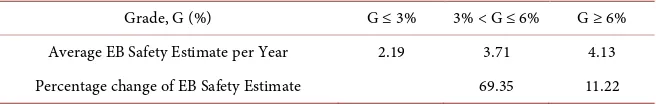
The effect of grade on road safety was considered, as Table 4 illustrates, in three categories of grades. Result from the Table shows that grade of a road was posi-tively correlated with average number of accidents per segments per year. Ac-cordingly, flat road section (i.e. G ≤ 3%) record less frequencies of crashes than mild (3% < G ≤ 6%) and mild gradient record less number of crash when com-pared with steep (G > 6%) gradients. On sections with high gradient, safety problems may occur from speed differences between passenger cars and heavy vehicles (e.g. heavy vehicles idling on upgrade sections), as well as vehicles braking on downhill sections (e.g. increases in braking distances).
DOI: 10.4236/jtts.2019.93023 376 Journal of Transportation Technologies Table 4. Effect of grade on road safety.
Grade, G (%) G ≤ 3% 3% < G ≤ 6% G ≥ 6%
Average EB Safety Estimate per Year 2.19 3.71 4.13
Percentage change of EB Safety Estimate 69.35 11.22
links with mild grade compared with links with steep grade respectively. The probable reason for this result is with the fact that drivers tend to travel at higher speeds on flat grades than on mild and steep grades.
4.2.5. Combination Effect of Horizontal and Vertical Alignments on Road Safety
An inefficient combination of horizontal and vertical alignment may lead to road safety problems, even when the horizontal and the vertical alignment are separately correct and according to the standards. Poor coordination of hori-zontal and vertical alignments can create locations where the available sight dis-tance drops below the required sight disdis-tance [21].
As indicated in the review part, the coincidence of a right horizontal curve and a crest vertical curve may, under certain conditions, lead to significant limi-tation of the available sight distance and prevent the prompt perception of the curve. For instance, segments 165, 152, 154 and 148, were good examples as shown in Table 1, which were ranked in 1st, 2nd, 6th and 7th position respectively consist the specified combination of horizontal and vertical curves.
Similarly, the coincidence of a left horizontal curve and a sag vertical curve may create a false impression of the degree of curvature (i.e. the horizontal curve may seem to have a higher radius than the actual), and may contribute to in-creased accident risk. For instance, segments 165, 152 and 154, were good exam-ples that consists the specified combination of horizontal and vertical curves, were ranked in 1st, 2nd and 6th position respectively as indicated in Table 1.
4.2.6. Influence of Lane and Shoulder Width
Both lane and shoulder width were taken from site measurement at the probable accident-prone location of each segment. Accordingly, Table 5 and Table 6 present at 0.15 m and 0.2 m increment of lane and shoulder widths respectively. Therefore, the width of lane and shoulder used for analysis purpose for each segment was the average width of representative accident-prone location. These accidents prone locations were identified based on in-depth analysis of accident record and some evidence from an interview with the traffic police officers sup-ported such allegation.
DOI:10.4236/jtts.2019.93023 377 Journal of Transportation Technologies Table 5. Influence of lane width on road safety.
Lane width in meter (m) 3.20 3.35 3.50
Average BE Safety Estimate per Year 3.97 3.06 2.40
Percentage change of EB Safety Estimate −22.90 −21.52
The negative sign indicates reduction of expected accidents.
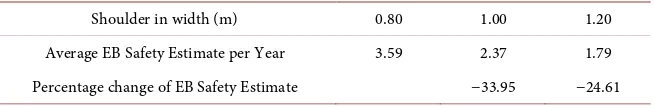
Table 6. Influence of shoulder width on road safety.
Shoulder in width (m) 0.80 1.00 1.20
Average EB Safety Estimate per Year 3.59 2.37 1.79
Percentage change of EB Safety Estimate −33.95 −24.61
The negative sign indicates reduction of expected accidents.
study [3] that the reduction of accident on rural two-lane road as a result of wi-dening lane from 3.00 m up to base width.
The widths of shoulder that have been considered in this study were only the actual existing paved portion because most of the deteriorated and unpaved parts were not properly functioning. Table 6 provides the influence of shoulder width on road safety. Accordingly, widening average shoulder width by 0.2 m, from 0.8 to 1.0 m and from 1.0 to 1.2 m, around 33.95% and 24.61% reduction in accidents were observed respectively. This is an indication that safety of rural two-lane road is too much sensitive to lane and shoulder widths. Since this find-ing is in conformity with the result of several previous studies, adequate shoul-der width has to be provided in orshoul-der to make safe recovery of vehicles when it veer off the road. In general, this study concludes that wider lane and/or shoul-der widths produces fewer accidents. In addition, only a few widening of lane and/or shoulder width would result huge reduction of accidents.
In general, in average 22% and 29% of accident frequency were reduced due to 0.15 m and 0.2 land and shoulder width improvement respectively.
5. Conclusions
The analysis showed that short and sharp (i.e., R ≤ 450 m) horizontal curves were associated with higher crash frequencies. For wider curves (i.e., R > 750 m), the effect of horizontal curve elements on road safety is found to be not consis-tent and hence it may be highly affected by the availability of other risk indicat-ing road parameters rather than horizontal curves elements. Generally, this study found that the frequencies of average accidents decreased as the radius of the curve, transition curve length and super-elevation of horizontal curves joint-ly and/or alone increased.
The numbers of horizontal and vertical curves per 1.5 km road segments were positively correlated with the average accident frequencies. Furthermore, it was also found that the first horizontal curve after a long tangent was the most criti-cal curve and the risk was 1.5 times greater than that of the tangent section.
[image:24.595.213.540.186.239.2]DOI: 10.4236/jtts.2019.93023 378 Journal of Transportation Technologies per segments. Furthermore, an increase of around 69% and 11% in number of accidents identified in this study when the road section transformed from flat to mild grade and from mild to steep grades respectively.
Wider lane and/or shoulder width produces fewer numbers of average acci-dent. In average, 22% and 29% of accident frequencies have been reduced due to 0.15 and 0.2 m land and shoulder width improvement respectively.
Finally, the study concluded that even though traffic police report underesti-mated the influence of road geometry on road safety in Ethiopia, substantial im-provements of expected number of accidents have been quantified when the road section parameters improved (or transformed from less to high risk indi-cating road factors) as indicated in the above sections.
6. Limitation
There exists a limitation in this study because the vehicle factors and human factors were not correlated with expected number of expected accidents. Accor-dingly, the effect of vehicles defect and human errors were considered to be con-stant for this study. Therefore, it is recommended that further research should be conducted to address the issue.
Acknowledgements
The author would like to acknowledge Department of Civil Engineering, Insti-tute of Technology, Hawassa University for their help and encouragement to conduct this research. The author is particularly grateful to Mr. Edilu Shona (Asst. Professor) for his cross assistance and valuable comments through reading the draft manuscript of this paper.
Conflicts of Interest
The author declares no conflicts of interest regarding the publication of this paper.
References
[1] Haddon, W. (1972) A Logistic Framework for Categorizing Highway Safety Phe-nomena and Activity.The Journal of Trauma, 12, 193-207.
https://doi.org/10.1097/00005373-197203000-00002
[2] American Association of State Highway and Transportation Officials (AASSHTO) (2009) Highway Safety Manual. AASSHTO,Washington DC.
[3] Berhanu, G. (2000) Effects of Road and Traffic Factors on Road Safety in Ethiopia. Ph.D. Thesis, NorwegianUniversity of Science and Technology, Trodhium, Norway. [4] Abebe, M.T. and Belayneh, M.Z. (2018) Identifying and Ranking Dangerous Road
Segments A Case of Hawassa-Shashemene-Bulbula Two-Lane Two-Way Rural Highway, Ethiopia. Journal of Transportation Technologies, 8, 151-174.
https://doi.org/10.4236/jtts.2018.83009
DOI:10.4236/jtts.2019.93023 379 Journal of Transportation Technologies
[6] Aram, A. (2010) Effective Safety Factors on Horizontal Curves of Two-Lane High-ways. Journal of Applied Sciences, 10, 2814-2822.
https://doi.org/10.3923/jas.2010.2814.2822
[7] Karimi, A. and Kashi, E. (2018) Investigating the Effect of Geometric Parameters In-fluencing Safety Promotion and Accident Reduction (Case Study: Bojnurd-Golestan National Park Road). Cogent Engineering, 5, Article ID: 1525812.
[8] Hameed, M. (2013) The Influence of Road Geometric Design Elements on Highway Safety. International Journal of Civil Engineering and Technology, 4, 146-162. [9] Bauer, K.M. and Harwood, D.W. (2013) Safety Effects of Horizontal Curve and Grade
Combinations on Rural Two-Lane Highways. Transportation Research Record, 2398, 37-49. https://doi.org/10.3141/2398-05
[10] European Road Safety Observatory (2006) Road Safety Management. http://www.erso.eu/
[11] Hauer, E. (1999) Safety and the Choice of Degree of Curve. Transportation
Re-searchRecord, 1665, 22-27.https://doi.org/10.3141/1665-04
[12] Department of Transportation (2007) Safety Handbook for Secondary Roads, USA. [13] Ethiopian Roads Authority (2013) Geometric Design Manual. Addis Ababa,
Ethi-opia.
[14] Stewart, D. and Chudworty, C.J. (1990) A Remedy for Accidents at Bends. Traffic
EngineeringandControl, 31, 88-93.
[15] Brenac, T. and Annex, I. (1994) Curves on Two-Lane Roads, Safety Effects of Road Design Standards. SWOV, Leidschendam, the Netherlands.
[16] Kanellaidis, G. (1991) Aspects of Highway Super-Elevation Design. ASCE Journal of
Transportation Engineering, 117, No 2.
https://doi.org/10.1061/(ASCE)0733-947X(1991)117:6(624)
[17] Harwood, D.W., Council, F.M., Hauer, E., Hughes, W.E. and Vogt, A. (2000) Pre-diction of the Expected Safety Performance of Rural Two-Lane Highways. Paper No. FHWA-Rd-99-207, Federal Highway Administration, Washington DC. [18] Hauer, E. (2000) Safety of Horizontal Curves, Review of Literature forthe Interactive
Highway Safety Design Model. http://www.roadsafetyresearch.com/
[19] Matthews, L.R.and Barnes, J.W. (1988) Relation between Road Environment and Curve Accidents. Proceedings of 14thARRB Conference, Canberra, 28 August-2 September 1988, 105-120.
[20] Obaidat, M.T. and Ramadan, T.M. (2012) Traffic Accidents at Hazardous Locations of Urban Roads. Jordan Journal of Civil Engineering, 6, 436-447.
[21] Hassan, Y., Sayed, T. and Bidulka, S. (2002) Influence of Vertical Alignment on Ho-rizontal Curve Perception: Phase II, Modelling Perceived Radius. Transportation
Research Record, 1796, 24-34.https://doi.org/10.3141/1796-03
[22] Institution of Highways and Transportation (IHT) (1990) Guidelines for Accident Reduction and Prevention. International Edition, London.
[23] Smith, B. and Lamm, R. (1993) Coordination of Horizontal and Vertical Alignment with Regard to Highway Aesthetics. Transportation Research Record Journal of the
Transportation Research Board, 1445, 73-85.
[24] Kiran, B.N., Kumaraswamy, N. and Sashidhar, C. (2017) A Review of Road Crash Prediction Models for Developed Countries. American Journal of Traffic and
Transportation Engineering, 2, 10-25.
DOI: 10.4236/jtts.2019.93023 380 Journal of Transportation Technologies
and Median Width on Safety. NCHRP Report 633. Transportation Research Board of the National Academies, Washington DC.
[26] Transportation Research Board (1987) Designing Safer Roads, Special Report 214. Transportation Research Board, Washington DC, 319.
[27] Landge, V.S., Jain, S.S. and Parida, M. (2006) Modeling Traffic Accidents on Two Lane Rural Highways under Mixed Traffic Conditions. 87th Annual Meeting of
Transportation Research Board.
[28] Hauer, E. (1997) Observational before-after Studies in Road Safety: Estimating the Effect of Highway and Traffic Engineering Measures on Road Safety. Pergamon, Oxford, 289 p.
[29] Shen, J. and Gan, A. (2003) Development of Crash Reduction Factors: Methods, Problems, and Research Needs. Transportation Research Record: Journal of the
Transportation Research Board, 1840, 50-56. https://doi.org/10.3141/1840-06
[30] Huang, H., Chin, H. and Haque, M. (2009) Empirical Evaluation of Alternative Ap-proaches in Identifying Crash Hot Spots Naive Ranking, Empirical Bayes, and Full Bayes Methods. Transportation Research Record, 2103, 32-41.
https://doi.org/10.3141/2103-05
[31] Xie, K., Ozbay, K., Yang, H. and Yang, D. (2018) A New Methodology for Be-fore-After Safety Assessment Using Survival Analysis and Longitudinal Data. Risk
Analysis, 39, 1342-1357. https://doi.org/10.1111/risa.13251
[32] Hauer, E., Harwood, D.W., Council, F.M. and Griffith, M.S. (2002) Estimating Safety by the Empirical Bayes Method: A Tutorial. Transportation Research Record:
Journal of the Research Board, 1784, 126-131. https://doi.org/10.3141/1784-16
[33] Brimley, B.K. (2011) Calibration of the Highway Safety Manual Safety Performance Function and Development of Jurisdiction Specific Models for Rural Two-Lane Two-Way Roads in Utah. All Theses and Dissertations, 2611.
https://scholarsarchive.byu.edu/etd/2611
[34] Persaud, B., Lyon, C. and Nguyen, T. (1999) Empirical Bayes Procedure for Ranking Sites for Safety Investigation by Potential for Safety Improvement. Transportation
Research Record: Journal of the Research Board, 1665, 7-12.
https://doi.org/10.3141/1665-02
[35] United Nations (2017) World Population Prospects: The 2017 Revision. United Na-tions Department of Economic and Social Affairs, Population Division.
https://Esa.Un.Org
[36] Africa::Ethiopia—The World Factbook-Central Intelligence ...-Cia.
https://www.cia.gov/library/publications/the-world-factbook/geos/print_et.html [37] Saffarzadeh, M. and Shabani, S. (2007) An Accident Forecasting Model for