http://www.scirp.org/journal/jamp ISSN Online: 2327-4379
ISSN Print: 2327-4352
DOI: 10.4236/jamp.2019.77103 Jul. 22, 2019 1519 Journal of Applied Mathematics and Physics
Why Quantitative Variables Should Not Be
Recoded as Categorical
*
Antônio Fernandes, Caio Malaquias, Dalson Figueiredo, Enivaldo da Rocha, Rodrigo Lins
Department of Political Science, Federal University of Pernambuco (UFPE), Recife, Brazil
Abstract
The transformation of quantitative variables into categories is a common practice in both experimental and observational studies. The typical proce-dure is to create groups by splitting the original variable distribution at some cut point on the scale of measurement (e.g. mean, median, mode). Allegedly, dichotomization improves causal inference by simplifying statistical analyses. In this article, we address some of the adverse consequences of recoding quantitative variables into categories. In particular, we provide evidence that categorization usually leads to inefficient and biased estimates. We believe that considerable progress in our understanding of data analysis can occur if scholars follow the recommendations presented in this article. The recodifi-cation of quantitative variables as categorical is a poor methodological strate-gy, and scientists must stay away from it.
Keywords
Dichotomization, Inefficiency, Bias
1. Introduction
Imagine a political scientist wants to estimate the effect of income, as measured by a continuous yearly revenue, on partisanship. Before performing data analys-es, she decides to split income into three levels: low, medium, and high. Similar-ly, suppose a physicist wants to examine the effect of age on the likelihood of
*Authors are listed in alphabetical order. This work was partially supported by FACEPE, Capes, and CNPq. We thank the Berkeley Initiative for Transparency in the Social Sciences (BITSS) and the Project Teaching Integrity in Empirical Research (TIER) for financial support. We thank the Politi-cal Science Research Methods Group from the Federal University of Pernambuco for generous feedback. Also, we thank Justin Esarey and Umberto Mignozzetti for helpful comments. Replication materials are available at: https://osf.io/7tsgx/.
How to cite this paper: Fernandes, A., Malaquias, C., Figueiredo, D., da Rocha, E. and Lins, R. (2019) Why Quantitative Va-riables Should Not Be Recoded as Categor-ical. Journal of Applied Mathematics and Physics, 7, 1519-1530.
https://doi.org/10.4236/jamp.2019.77103
Received: May 13, 2019 Accepted: July 19, 2019 Published: July 22, 2019
Copyright © 2019 by author(s) and Scientific Research Publishing Inc. This work is licensed under the Creative Commons Attribution International License (CC BY 4.0).
DOI: 10.4236/jamp.2019.77103 1520 Journal of Applied Mathematics and Physics developing coronary heart diseases. Before running the model, she recodes age into four groups. In this article, we address some of the adverse consequences of dichotomizing quantitative variables. Technically, categorization always implies a loss of information, and it usually leads to misleading results [1][2][3][4]. To make our case, we reproduce data from [5] and [6]. Besides, we employ basic simulation to show how dichotomization generates inefficiency and bias. To in-crease transparency [7][8][9], we report all computational scripts used to gen-erate statistical analyses.
Our target audience is graduate students in the early stages of training and scholars with a minimum mathematical background. For this reason, we mini-mized algebraic applications to facilitate the understanding of the original con-tent. In particular, the paper fills a gap in the political methodology literature. We reviewed 24 articles on dichotomization published in 20 journals from 1983 to 2017, and none of them was available in political science journals (see Ap-pendix Table A1). As long as the categorization of quantitative variables is a common practice not only in the Social Sciences but also in the Health Sciences [10][11], we believe that considerable progress in our understanding of data anal-ysis can occur if scholars follow the recommendations presented in this article.
The remainder of the paper is structured as follows. Following section reviews the literature on categorization. The second section replicates data from different studies to show how the transformation of quantitative variables into categories may lead to wrong conclusions. The third section uses basic simulation to high-light the shortcomings of dichotomization, focusing on both bias and efficiency. The final section concludes.
2. What Is the Problem?
Information loss, Inefficiency, Bias, concisely, these are the main problems gen-erated by the categorization of quantitative variables [12]. Despite its widespread use, the scholarly literature has accumulated systematic evidence on why scho-lars should avoid dichotomization. The discretization reduces measurement ac-curacy, underestimates the magnitude of the coefficients of bivariate relation-ships, and lowers statistical power [2][13]. Also, the artificial transformation of quantitative measures into groups may lead to biased coefficients and unreliable standard errors in multivariate models [13][14].
DOI: 10.4236/jamp.2019.77103 1521 Journal of Applied Mathematics and Physics Table 1. Literature against dichotomization
Author
(year) Warning
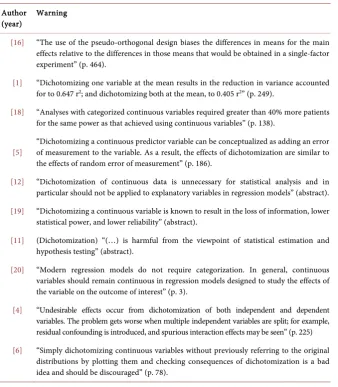
[16] “The use of the pseudo-orthogonal design biases the differences in means for the main effects relative to the differences in those means that would be obtained in a single-factor experiment” (p. 464).
[1] “Dichotomizing one variable at the mean results in the reduction in variance accounted for to 0.647 r2; and dichotomizing both at the mean, to 0.405 r2” (p. 249).
[18] “Analyses with categorized continuous variables required greater than 40% more patients for the same power as that achieved using continuous variables” (p. 138).
[5] “Dichotomizing a continuous predictor variable can be conceptualized as adding an error of measurement to the variable. As a result, the effects of dichotomization are similar to the effects of random error of measurement” (p. 186).
[12] “Dichotomization of continuous data is unnecessary for statistical analysis and in particular should not be applied to explanatory variables in regression models” (abstract). [19] “Dichotomizing a continuous variable is known to result in the loss of information, lower
statistical power, and lower reliability” (abstract).
[11] (Dichotomization) “(…) is harmful from the viewpoint of statistical estimation and hypothesis testing” (abstract).
[20] “Modern regression models do not require categorization. In general, continuous variables should remain continuous in regression models designed to study the effects of the variable on the outcome of interest” (p. 3).
[4] “Undesirable effects occur from dichotomization of both independent and dependent variables. The problem gets worse when multiple independent variables are split; for example, residual confounding is introduced, and spurious interaction effects may be seen” (p. 225) [6] “Simply dichotomizing continuous variables without previously referring to the original
distributions by plotting them and checking consequences of dichotomization is a bad idea and should be discouraged” (p. 78).
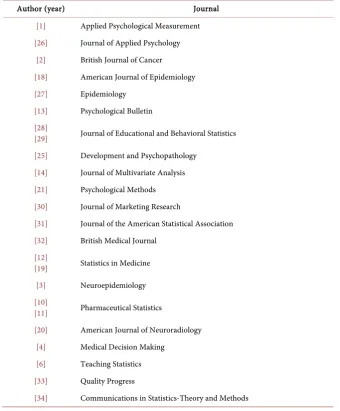
Note: We reviewed 24 papers published in 20 journals from 1983 to 2017.
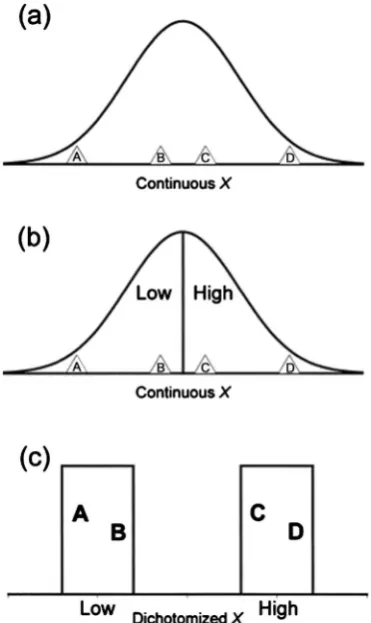
Another criticism against dichotomization comes from measurement litera-ture [1][5]1. According to [1], “dichotomizing adds errors of discreteness. That is, the amount of unmeasured true scores variance for the cases at each of the points of the dichotomy is necessarily greater than it would be for cases at each of the multiple points in the original scale” (p. 249). Simirlaly, [5] argue that the categorization of quantitative variables into groups is equivalent to add mea-surement error to the variable. Therefore, dichotomization increases the differ-ence between true scores and measured values, which is likely to produce unre-liable estimates. Figure 1 shows the relationship between dichotomization and measurement error2.
1In this paper we adopt the definition of measurement proposed by [22]: “measurement consists of rules for assigning symbols to objects so as to (1) represent quantities of attributes numerically (scaling) or (2) define whether the objects fall in the same or different categories with respect with a given attribute (classification)” (p. 1).
DOI: 10.4236/jamp.2019.77103 1522 Journal of Applied Mathematics and Physics Note: image from [21]. Figure 1 exemplifies a typical problem in dichotomization. A horizontal line depicts variable X, which has a sufficient number of cases, the closer the cases are from one another, the more similar they are. Letters A, B, C, and D (shown inside a triangle) represent four different cases. Case A is distant to case B as well as C is to D. Both cases B and C are nearer to each other, meaning they are more similar (a). If some arbitrary cut point between B and C is chosen (b) to transform the continuous variable X into a dichotomized one (c), the similar cases B and C will end up in two separated groups while more different pairs will be on the same group.
Figure 1. Measurement of individual differences before and after dichotomization.
B and C have similar scores when X is measured continuously. However, the dichotomization leads to an inefficient aggregation of A and B vis-a-vis C and D. Comparatively, the least useless procedure is to split a normal variable at its mean, which reduces the variance of the original variables by a 20% on average. However, it is doubtful to find perfect normal distributions in practice. There-fore, depending on the shape of the distribution, categorization will lead to more significant information loss [1][19]. In short, the categorization of quantitative variables will always generate information loss, which in turn will reduce esti-mates efficiency. In some cases, in addition to inefficiency, dichotomization can lead to biased estimates, as we will show in the next section.
3. Replication
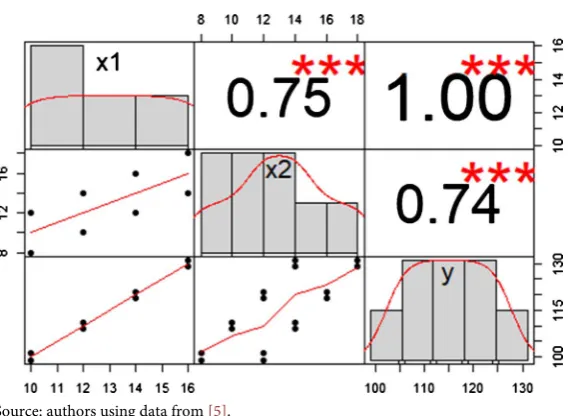
DOI: 10.4236/jamp.2019.77103 1523 Journal of Applied Mathematics and Physics Source: authors using data from [5].
Figure 2. Correlation among X1, X2, and Y.
the number of errors made in a cognitive laboratory (X1), the speed of response during the task (X2), and the score on a standardized ability test (Y). Figure 2 shows the Pearson correlation coefficient among those variables.
To explore the impact of categorization, [5] dichotomized both independent variables at their respective medians (13). Then, they estimate a 2 × 2 ANOVA, which revealed an effect of X1 and X2 over the mean of Y. According to [5], “the bivariate dichotomization of X1, and X2 has led to a situation in which the esti-mated effects of X1 and X2 on Y are biased” (p. 183). A simple linear regression on the effect of X2 on Y vanishes after we control for X1. In short, these results indicate that categorization may lead to misleading results.
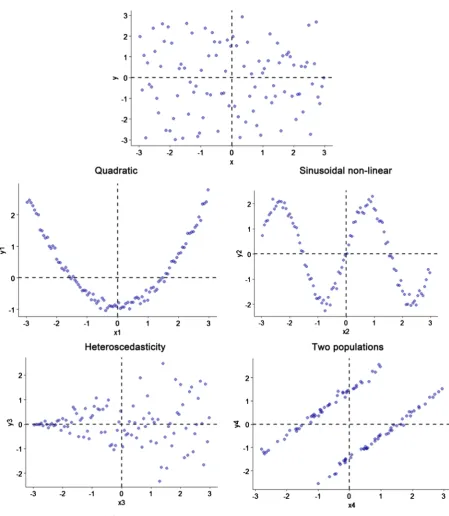
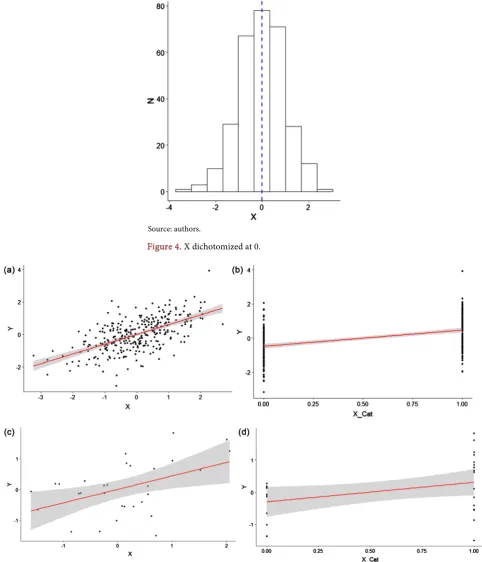
The second example comes from [6]. He simulated five different scatterplots that yield an identical fourfold table when X and Y are dichotomized at cut point 0, misleadingly suggesting no association between the variables. Figure 3 repli-cates data from [6].
Dichotomization leads us to overlook the true nature of the relationship be-tween X and Y. According to [6], “simply dichotomizing continuous variables without previously referring to the original distributions by plotting them and checking consequences of dichotomization is a bad idea and should be discou-raged” (p. 3). These two examples show how dichotomization can lead scholars to wrong inferences.
4. Simulation
DOI: 10.4236/jamp.2019.77103 1524 Journal of Applied Mathematics and Physics Figure 5 shows the correlation between X and Y and X categorized and Y for all cases (n = 300) and for a small sample of observations (n = 30).
The true correlation coefficient is 0.600. By dichotomizing X at its mean, we observe a linear association of 0.475, which represents a 20.83% difference from the known parameter. For a small sample size (n = 30), the Pearson correlation using the original variables is 0.465, which is closer to the true parameter value compared to the estimate from the dichotomized model. In short, regardless of the
[image:6.595.86.536.178.695.2]Source: authors using data from [6].
DOI: 10.4236/jamp.2019.77103 1525 Journal of Applied Mathematics and Physics Source: authors.
Figure 4. X dichotomized at 0.
Source: authors.
Figure 5. Correlation between X and Y (n = 300) and (n = 30). (a) r = 0.600; (b) r = 0.475; (c) r = 0.465; (d) r = 0.357.
sample size, dichotomization will lead to information loss, which decreases esti-mates efficiency. Table 2 shows the estimates of two linear regression models.
DOI: 10.4236/jamp.2019.77103 1526 Journal of Applied Mathematics and Physics is twice as large compared to the model using the original variables. For a biva-riate linear regression, the coefficient of determination is calculated by the square of Pearson correlation coefficient (0.6), which is 36%. In the dichoto-mized model, we observe an r2 close to 23%, which underestimate the goodness of fit of the model. For n equals to 30, the categorization of the independent va-riable leads to the incorrect retention of the null hypothesis at 5% level (p-value = 0.052). Although our simulation deals with only two variables, the same rea-soning applies to multiple linear regression, which is widely used in empirical research in both Human and Natural sciences [23].
Now let’s consider a slightly more complicated case. We simulate the follow-ing model:
1 2
100 0.20 0.40
Y = + ∗X − ∗X +ε (1)
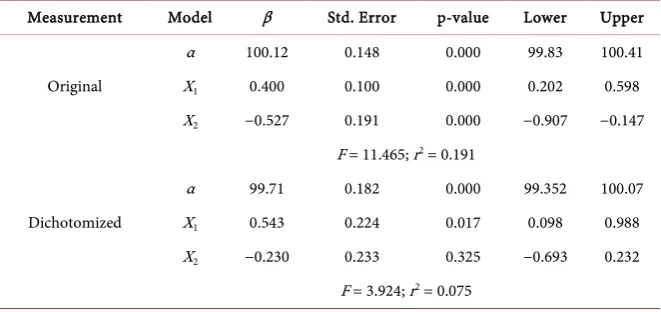
where X1 follows a normal distribution (0, 1), X2 follows an exponential distribu-tion (λ = 2) and ε has average value equals to zero and standard deviadistribu-tion equals to 1 for a population of 100 observations. Table 3 compares the results of a li-near regression using original variables to a model when both independent va-riables are dichotomized at their means.
[image:8.595.207.541.378.503.2]The dichotomized model displays a lower r2 and F statistic, suggesting poor
Table 2. How dichotomization leads to inefficiency.
Sample size
300 30
Level of measurement of X (Std. Error) Βeta t r2 Βeta
(Std. Error) t r2
Original (0.046) 0.600 12.95 0.360 (0.157) 0.437 2.78 0.216
Dichotomized (0.102) 0.948 9.31 0.225 (0.300) 0.609 2.03 0.128
Note: we estimated two linear regression models. The first one was estimated with both variables at their original level of measurement (continuous). The second model used X dichotomized at its mean (0).
Table 3. Linear regression (original x dichotomized variables).
Measurement Model β Std. Error p-value Lower Upper
Original
α 100.12 0.148 0.000 99.83 100.41
X1 0.400 0.100 0.000 0.202 0.598
X2 −0.527 0.191 0.000 −0.907 −0.147
F = 11.465; r2 = 0.191
Dichotomized
α 99.71 0.182 0.000 99.352 100.07
X1 0.543 0.224 0.017 0.098 0.988
X2 −0.230 0.233 0.325 −0.693 0.232
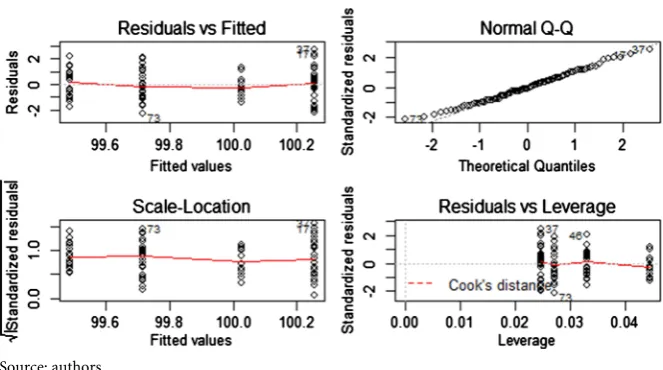
[image:8.595.208.539.557.713.2]DOI: 10.4236/jamp.2019.77103 1527 Journal of Applied Mathematics and Physics Source: authors.
Figure 6. Residual diagnostics.
goodness of fit. When variables are used at their original level of measurement, regression coefficients are unbiased estimates of the population parameters. However, when both variables are dichotomized at their means, X2 is no longer statistically significant which will lead us to retain the null hypothesis of no ef-fect incorrectly. For public policy, the conclusion would be to cut resources. In medical research, the inference would be that the treatment has no impact on health. Figure 6 depicts the residual diagnostics from the dichotomized model.
5. Conclusions
Despite criticisms from the scholarly community, dichotomization still is a common practice in empirical research. Unfortunately, many researchers cate-gorize quantitative variables before running data analyses. This is true from Bi-ology to PsychBi-ology, from Medical research to SociBi-ology. Before statistical soft-ware and computers development, categorization played an essential role in science by simplifying mathematical modeling. It is not the case anymore. Since we have more appropriate tools to deal with reality, there is no reason to trans-form quantitative measures into categories. More than 30 years ago, [24] argued that “scientific questions are better decided by empirical evidence than by me-thodological default” (p. 833).
DOI: 10.4236/jamp.2019.77103 1528 Journal of Applied Mathematics and Physics of information which has detrimental effects on the reliability of statistical esti-mates.
In sum, the recodification of quantitative variables as categorical is a poor methodological strategy, and scholars must stay away from it. Dichotomization undoubtedly simplifies data analysis, but the costs are too higher to bear. Today, categorization is neither appropriate nor justifiable. Continuous variables are as good as they are. Let’s be cool about it and leave quantitative variables alone.
Conflicts of Interest
The authors declare no conflicts of interest regarding the publication of this pa-per.
References
[1] Cohen, J. (1983) The Cost of Dichotomization. Applied Psychological Measure-ment, 7, 249-253.https://doi.org/10.1177/014662168300700301
[2] Altman, D. (1991) Categorising Continuous Variables. British Journal of Cancer, 64, 975.https://doi.org/10.1136/bmj.332.7549.1080
[3] Walraven, C. and Van and Hart, G. 2008) Leave Me Alone—Why Continuous Va-riables Should Be Analyzed as Such. Neuroepidemiology, 30, 138-139.
https://doi.org/10.1159/000126908
[4] Dawson, N.V. and Weiss, R. (2012) Dichotomizing Continuous Variables in Statis-tical Analysis. Medical Decision Making, 32, 225-226.
https://doi.org/10.1177/0272989X12437605
[5] Maxwell, S.E. and Delaney, H.D. (1993) Bivariate Median Splits and Spurius Statis-tical Significance. Psychological Bulletin, 113, 181-190.
https://doi.org/10.1037//0033-2909.113.1.181
[6] Kuss, O. (2013) The Danger of Dichotomizing Continuous Variables: A Visualiza-tion. Teaching Statistics, 35, 78-79. https://doi.org/10.1111/test.12006
[7] Paranhos, R., Figueiredo Filho, D.B., da Rocha, E.C. and do Carmo, E.F. (2013) A importância da replicabilidade na ciência política: O caso do SIGOBR. Revista Política Hoje, 22, 213-229.
[8] Janz, N. (2016) Bringing the Gold Standard into the Classroom: Replication in Uni-versity Teaching. International Studies Perspectives, 17, 392-407.
[9] Figueiredo, D., Lins, R., Domingos, A., Janz, N. and Silva, L. (2019) Seven Reasons Why: A User’s Guide to Reproducibility and Transparency. Brazilian Political Science Review, 13.
[10] Lewis, J.A. (2004) In Defence of the Dichotomy. Pharmaceutical Statistics, 3, 77-79. https://doi.org/10.1002/pst.107
[11] Fedorov, V., Mannino, F. and Zhang, R. (2009) Consequences of Dichotomization. Pharmaceutical Statistics, 8, 50-61.https://doi.org/10.1002/pst.331
[12] Royston, P., Altman, D.G. and Sauerbrei, W. (2006) Dichotomizing Continuous Predictors in Multiple Regression: A Bad Idea. Statistics in Medicine, 25, 127-141. https://doi.org/10.1002/sim.2331
[13] Delaney, H., Maxwell, S.E. and Delaney, H.D. (1993) Bivariate Median Splits and Spurious Statistical Significance. Psychological Bulletin, 113, 181-190.
DOI: 10.4236/jamp.2019.77103 1529 Journal of Applied Mathematics and Physics [14] Taylor, J.M.G. and Yu, M. (2002) Bias and Efficiency Loss Due to Categorizing an
Explanatory Variable. Journal of Multivariate Analysis, 83, 248-263. https://doi.org/10.1006/jmva.2001.2045
[15] Peters, C.C. and Van Voorthis, W.R. (1940) Statistical Procedures and Their Ma-thematical Bases. McGraw-Hill, New York.
[16] Humphreys, L.G. and Fleishman, A. (1974) Pseudo-Orthogonal and Other Analysis of Variance Designs Involving Individual-Differences Variables. Journal of Educa-tional Psychology, 66, 464-472.https://doi.org/10.1037/h0036539
[17] Cohen, J. and Cohen, P. (1983) Applied Multiple Regression/Correlation Analysis for the Behavioral Sciences. Earlbaum, Hillsdale.
[18] Zhao, L.P. and Kolonel, L.N. (1992) Efficiency Loss from Categorizing Quantitative Exposures into Qualitative Exposures in Case-Control Studies. American Journal of Epidemiology, 136, 464-474.https://doi.org/10.1093/oxfordjournals.aje.a116520 [19] Chen, H., Cohen, P. and Chen, S. (2007) Biased Odds Ratios from Dichotomization
of Age. Statistics in Medicine, 26, 3487-3497.https://doi.org/10.1002/sim.2737 [20] Naggara, O., et al. (2011) Analysis by Categorizing or Dichotomizing Continuous
Variables Is Inadvisable : An Example from the Natural History of Unruptured Aneurysms. American Journal of Neuroradiology, 32, 437-440.
https://doi.org/10.3174/ajnr.A2425
[21] Maccallum, R.C., et al. (2002) On the Practice of Dichotomization of Quantitative Variables. Psychological Methods, 7, 19-40.
https://doi.org/10.1037//1082-989X.7.1.19
[22] Nunnally, J.C., Bernstein, I.H. and Berge, J.M.T. (1994) Psychometric Theory. Vol. 226, McGraw-Hill, New York.
[23] Krueger, J. and Lewis-Beck, M. (2008) Is OLS Dead? The Political Methodologist, 15, 2-4.
[24] Friedrich, R.J. (1982) In Defense of Multiplicative Terms in Multiple Regression Equations. American Journal of Political Science, 26, 797-833.
https://doi.org/10.2307/2110973
[25] Farrington, D.P. and Loeber, R. (2000) Some Benefits of Dichotomization in Psy-chiatric and Criminological Research. Criminal Behaviour and Mental Health, 10, 100-122.https://doi.org/10.1002/cbm.349
[26] Schmidt, F. (2010) Detecting and Correcting the Lies That Data Tell. Perspectives on Psychological Science, 5, 233-242.https://doi.org/10.1177/1745691610369339 [27] Ragland, D.R. (1992)) Dichotomizing Continuous Outcome Variables: Dependence
of the Magnitude of Association and Statistical Power on the Cutpoint. Epidemiol-ogy, 3, 434-440.https://doi.org/10.1097/00001648-199209000-00009
[28] Vargha, A., Rudas, T., Delaney, H.D. and Maxwell, S.E. (1996)) Dichotomization, Partial Correlation, and Conditional Independence. Journal of Educational and Be-havioral Statistics, 21, 264-282.https://doi.org/10.3102/10769986021003264 [29] Rousson, V. (2014) Measuring an Effect Size from Dichotomized Data: Contrasted
Results Whether Using a Correlation or an Odds Ratio. Journal of Educational and Behavioral Statistics, 39, 144-163.https://doi.org/10.3102/1076998614524597 [30] Irwin, J.R. and McClelland, G.H. (2003) Negative Consequences of Dichotomizing
Continuous Predictor Variables. Journal of Marketing Research, 40, 366-371. https://doi.org/10.1509/jmkr.40.3.366.19237
DOI: 10.4236/jamp.2019.77103 1530 Journal of Applied Mathematics and Physics on the Efficiency of Testing for an Interaction Effect in Exponential Family Models. Journal of the American Statistical Association, 99, 822-831.
https://doi.org/10.1198/016214504000001169
[32] Altman, D.G. and Royston, P. (2006) The Cost of Dichotomising Continuous Va-riables. BMJ, 332, 1080.https://doi.org/10.1136/bmj.332.7549.1080
[33] Seaman, J.E. and Allen, I.E. (2014) Don’t Be Discrete. Quality Progress, 47, 41. [34] Nelson, S.P., Ramakrishnan, V., Nietert, P.J., Kamen, D.L., Ramos, P.S. and Wolf,
B.J. (2017) An Evaluation of Common Methods for Dichotomization of Continuous Variables to Discriminate Disease Status. Communications in Statistics—Theory and Methods, 46, 10823-10834.https://doi.org/10.1080/03610926.2016.1248783
[image:12.595.204.545.302.714.2]Appendix
Table A1. Literature review per area.
Author (year) Journal
[1] Applied Psychological Measurement
[26] Journal of Applied Psychology
[2] British Journal of Cancer
[18] American Journal of Epidemiology [27] Epidemiology
[13] Psychological Bulletin [28]
[29] Journal of Educational and Behavioral Statistics [25] Development and Psychopathology
[14] Journal of Multivariate Analysis [21] Psychological Methods [30] Journal of Marketing Research
[31] Journal of the American Statistical Association [32] British Medical Journal
[12]
[19] Statistics in Medicine
[3] Neuroepidemiology
[10]
[11] Pharmaceutical Statistics
[20] American Journal of Neuroradiology
[4] Medical Decision Making
[6] Teaching Statistics
[33] Quality Progress