Adolescent Māori Mental H
ealth:
Emerging Risk Factors
A thesis submitted in partial fulfilment
of the requirements for the degree of
Master of Science in Child and Family Psychology,
University of Canterbury,
by Whitney (Mihiroa) Gillies
He Mihi
“Ehara taku toa i te toa takitahi, engari he toa takitini”
E mihi atu te uri whakaheke nei nō te iwi o Ngāi Tahu me te hapū o Ngāti Wheke, nō Ngāti Kāhungunu me te hapū o Ngāti Kurukuru, nō ngā iwi Kōtirana o MacMillan me Macpherson.
E ngā Tūpuna, e ngā mate, ahakoa kua wehe atu koutou ki tua o te tatau pounamu, ka mihi tonu, ka tangi tonu mātou ki a koutou. Nā koutou tā mātou ara i whakangāwari, e kore koutou e warewaretia. Moe mai rā, okioki mai rā.
Huri atu ki ngā kanohi ora, tokohia kē mai ngā tāngata i akiaki, i whāngai i ahau i te takahītanga o te huarahi mātauranga nei. Nei rā ngā whakamihi ki a koutou ngā kahikatea teitei, e noho ana ō koutou rarau kōtui hei whāriki taupuhipuhi i te ao hurihuri nei. Ahakoa nā tōku ringa tēnei tuhinga whakapae, mō koutou te mana o te tohu.
Nei rā te reo mihi ki ōku kaiārahi, ki a Tākuta Myron Friesen kōrua ko Tākuta Sonja
Macfarlane. Ko kōrua tahi te poutokomanawa o te whare rangahau nei. Nā kōrua ahau i akiaki kia oti pai i tēnei kaupapa. Ka nui te mihi ki a kōrua i āwhina mai ki ahau i tēnei mahi.
Rere tonu ngā kupu mihi ki te Ngāi Tahu Research Centre me te Rōpū Mātai Hinengaro o Aotearoa. Kua whakakākahutia e koutou te manu nei kia rere pai ai.
E mihi ana ahau ki te rangatira o te Christchurch Health and Development Study, ki a Toihuarewa David Fergusson, tōku kaiārahi i te ao mātai tahumaero - Ahakoa he rerekē ō whakaaro ki ōku i ētahi wā, kāore e kore he tohunga koe o tēnei tūmomo rangahau, nō reira nei rā te mihi maioha ki a koe. Ki a Toihuarewa Joe Boden, te kaitatauranga o ngā
kaitatauranga, tino waimarie ahau ko koe tōku kaiako i ngā tikanga o tēnā taniwha mataku. Tēnā koe i te nui o te tautoko me te manaakitanga i te roanga ake o tēnei hīkoitanga.
Me pēhea aku mihi atu ki taku hoa rangatira, ko Geordie Dann. E ngākau nui ana koe ki tāku mahi, ki taku ao Māori, ki ōku wāwata hoki. Tēnā koe te toka tū moana, e kore e mutu ngā mihi aroha ki a koe.
Anei te mihi ki a koutou ngā tauira o tā tātou akoranga mātai hinengaro, koutou ko aku hoa rangahau o Te Rū Rangahau. Tēnā koutou. Ko tātou tēnā e whakapau kaha ana mō te roanga o ngā tau e rua kua hipa kia tūtuki pai i tēnei wāhanga o tō tātou haerenga i te ao mātauranga. Me mōhio koutou, ahakoa he iti te kupu, he nui tonu te whakaaro.
Nei āku mihi e rere ana ki ōku mātua, koutou ko Nanny Bev. E mōhio ana ahau kei ōku tahataha koutou e whakakaha ana i ahau kia mahi ahau i āku mahi katoa ahakoa ngā piki me ngā heke. E kore e mimiti te puna aroha.
Acknowledgements
I would like to thank my supervisors, Dr. Myron Friesen and Dr. Sonja Macfarlane for their remarkable support and advice throughout the year. Thank you both for all the time and valuable input you have given me.
In addition to this I would like to thank the Ngāi Tahu Research Centre, The New Zealand Psychological Society, Te Rū Rangahau Māori Research Laboratory and The Christchurch Health and Development Study for their support and advice. I would particularly like to thank Professor David Fergusson and Associate Professor Joseph Boden for helping me to develop my knowledge of research methodology and statistics.
To my husband Geordie, thank you for your unwavering support and for always managing to make me laugh.
I also wish to thank my parents for supporting me in everything that I do, and Nanny Bev Gillies for always being happy to have a chat, and for showing me that perseverance can get you through hard times.
Table of Contents
Abstract……….1
1. Introduction ... 2
1.1 Māori Mental Health ... 3
1.2 Adolescent Mental Health ... 8
1.3 Mental Health of Māori Adolescents ... 9
1.4 Lifecourse Developmental Theory ... 12
1.5 Risk Factors Associated with Poor Mental Health ... 13
1.5.1 Low Socio-Economic Status ... 14
1.5.2 Low Socio-Economic Status During Childhood and Adolescence ... 15
1.5.3 Childhood Adversity ... 17
1.5.4 Deviant Peer Affiliation... 21
1.6 Exposure to Risk Factors for Psychopathology Amongst New Zealand Māori ... 22
1.6.1 New Zealand Ethnic Differences in Exposure to Low SES ... 22
1.6.2 New Zealand Ethnic Differences in Exposure to Childhood Adversity ... 23
1.6.3 New Zealand Ethnic Differences in Deviant Peer Affiliation ... 23
1.7 Summary ... 24
1.8 Limitations of Current Research ... 25
1.9 The Current Study ... 26
2. Methods: ... 28
2.1 Data Source: ... 28
2.2 Characteristics of the Sample ... 28
2.3 Procedure: ... 32
2.4 Measures:... 33
2.4.1 Mental Health Outcomes, Ages 15 and 16 ... 33
2.4.2 Life-Course Covariates ... 52
2.4.3 Deviant Peer Affiliations: ... 56
2.5 Statistical Analysis. ... 56
2.6 Generalised Estimating Equation Model: Properties and Use ... 59
3. Results ... 61
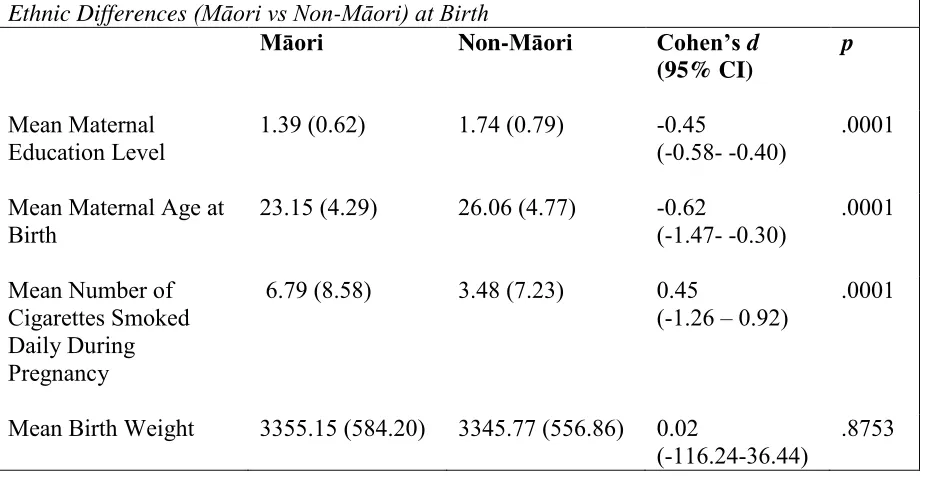
3.1 Differences in Ethnic Groups at Birth ... 61
3.2 Ethnic Differences in Rates of Psychiatric Disorder and Suicidal Ideation ages 15, 16 and 18 ... 61
3.3 Adjustments for Socioeconomic Disadvantage ... 66
3.4 Adjustments for Family Adversity ... 71
3.5 Peer Affiliations ... 79
3.6 Cross-validation of Findings Using a Measure of Ethnicity Obtained at Age 21 ... 83
4. Discussion ... 88
4.1 Ethnic Differences In the Prevalence of Psychiatric Disorders During Adolescence ... 88
4.2 Controlling for Ethnic Differences in Exposure to Socio-Economic Disadvantage During Childhood ... 89
4.3 Controlling for Ethnic Differences in Exposure to Childhood Adversity ... 91
4.4 Controlling for Ethnic Differences in Deviant Peer Affiliation ... 93
4.5 Social Policy, Clinical, and Research Implications ... 95
4.6 Strengths and Limitations ... 98
List of Tables
Table 1: Te Rau Hinengaro: Prioritised Ethnicity and 12 Month Prevalence of any Disorder
and Serious Disorder During 2003-2004 ... 4
Table 2: Te Rau Hinengaro: Hazard Ratios for Estimated Projected Lifetime Risk for Disorder Groups, by Age Group (Birth Cohort), Sex and Ethnicity (Unadjusted and Adjusted for the Influence of Age group, Sex and Socioeconomic Correlates) During 2003-2004 ... 5
Table 3: Unadjusted Prevalence and Adjusted Rate Ratios of Diagnosed Common Mental Disorder in the Adult Population Aged 15 Years and Over (Depression, Bipolar Disorder, Anxiety Disorder), New Zealand Health Survey 2011/12 and 2012/13 ... 6
Table 4: Unadjusted Prevalence and Adjusted Rate Ratios of Psychological Distress (High or Very High Probability of Anxiety Or Depressive Disorder on K10 Scale) in the Adult Population Aged 15 Years and Over, New Zealand Health Survey 2011/12 and 2012/137 Table 5: 12 Month Prevalence of Psychiatric Disorders by Ethnicity in the CHDS at Ages 15 and 18 Years ... 10
Table 6: Prevalence of Psychiatric Disorders by Ethnicity in the DMHDS at Age 18 Years 11 Table 7: Percentage of Cohort Members Reporting Māori Ethnicity (n=169) at Ages 21 and 25 by Self-Reported Iwi Affiliation by Region... 29
Table 8: Reasons for Losses of Follow Up at Age 14 ... 31
Table 9: Reasons for Losses of Follow Up at Age 18 ... 32
Table 10: Ethnic Differences (Māori vs Non-Māori) at Birth ... 61
Table 11: Ethnic Differences (Māori vs Non-Māori) in the Prevalence of Mental Disorder Amongst Adolescents Aged 15-18 ... 64
Table 12: Ethnic Differences (Māori vs non-Māori) in the Prevalence of Mental Disorder Amongst Adolescents Aged 15-18 by Category of Mental Disorder ... 66
Table 13: Ethnic differences (Māori vs non-Māori) in Socio-economic Indicators ... 67
Table 14: Regression Parameters for the GEE Model Adjusting for Socio-economic Variables ... 68
Table 15: Ethnic Differences (Māori vs. Non-Māori) for Internalising and Externalising Disorders Averaged Across 15-18 Years, Adjusted for Socio-economic Indicators ... 70
Table 16: Regression Model Adjusting for Significant and Marginally Significant Socio-Economic Variables and an Omnibus Family Adversity Score ... 72
Table 17: Ethnic Differences (Māori vs. Non-Māori) for Externalising Disorders and any Mental Disorder Averaged Across 15-18 Years, Adjusted for Significant and Marginally Significant Socio-economic Indicators and an Omnibus Family Adversity Score ... 74
Table 18: Ethnic Differences (Māori vs Non-Māori) in Childhood Adversity Indicators ... 75
Table 23:Ethnic Differences (Māori vs. Non-Māori) for Externalising Disorders Averaged Across 15-18 years, Adjusted for Significant and Marginally Significant Socio-Economic Indicators, Significant Childhood Adversity Indicators and Deviant Peer Affiliation
... 82 Table 24: Regression Parameters and Odds Ratios for GEE Models 1 Through 6, using
1
Abstract
In New Zealand, a number of studies have documented that New Zealand Māori are at
increased risk for a range of adverse developmental outcomes compared to non-Māori. Social scientists have offered a range of explanations for these ethnic differences, but often lack the necessary data to adequately test these explanations. This study used data from a long-term longitudinal study of a birth-cohort of New Zealand adolescents (N = 983) to examine the associations between ethnicity (New Zealand Māori versus non-Māori), prevalence rates of psychiatric disorder (both internalizing and externalizing) and suicidal ideation at age 15, 16, and 18 years. The study also investigated if any differences in mental health outcomes between the two groups were explained by a range of life-course experiences, including childhood socio-economic disadvantage, childhood family adversity, and adolescent deviant peer affiliation. Parents reported on children’s ethnicity at 14 years of age, and psychiatric disorder was measured in adolescence through both self-reports and parent reports.
Generalised estimating equation (GEE) models were fitted to repeated measures data to gauge the strength of the associations between Māori ethnicity and psychiatric disorders during adolescence. These GEE models were then extended in a series of adjustments to control for childhood socio-economic disadvantage, childhood family adversity, and
2 1. Introduction
The mental health of New Zealanders who identify as Māori has become an increasing concern over the past few decades, with one scholar claiming that ‘poor mental health is the most serious health problem facing Māori’ (Durie, 1997, p. 2). Prevalence rates of mental disorder amongst Māori are significantly higher than those of non-Māori, with Māori being over-represented in New Zealand’s mental health indices (Te Puni Kokiri, 1996; Te Rōpū Rangahau Hauora a Eru Pōmare, 2007). Mental health trends amongst Māori adolescents show similar patterns, with available research indicating that Māori adolescents have higher rates than their non-Māori counterparts in many mental disorders including depression, anxiety, conduct disorder, suicidal ideation / suicide attempts, and alcohol and illicit substance abuse (Fergusson, Poulton, et al., 2003).
In addition to these higher rates of psychiatric disorder, research has also suggested that Māori are more likely to be socioeconomically disadvantaged in childhood (Marie, Fergusson, & Boden, 2014), and are more likely to have experienced childhood adversity than their non-Māori counterparts (Marie, Fergusson & Boden, 2009). As low socio-economic status (SES) in childhood and childhood adversity have both been shown to be associated with poor mental health outcomes (Kessler, McLaughlin, et al., 2010; McLaughlin et al., 2011), questions have arisen as to whether the observed ethnic differences in rates of mental disorder could partially be explained by the higher rates of exposure amongst Māori to these risk factors. Whilst deviant peer affiliation is also known to be associated with maladjustment and psychopathology in adolescence (Boden, Fergusson, & Horwood, 2010; Buehler, 2006; Fergusson, Wanner, Vitaro, Horwood, & Swain-Campbell, 2003), no research has yet explored whether there are ethnic differences in deviant peer affiliation and whether this too may be contributing to higher rates of mental disorder and maladjustment amongst Māori adolescents.
3
1.1 Māori Mental Health
Routinely collected hospitalisation data reveals that prior to 1970, Māori had lower rates of admission to psychiatric hospitals than non-Māori (Pomare & de Boer, 1988; Woodward, 2004). However, following the rapid migration of Māori away from their marae to urban centres throughout the 1950’s and 1960’s, Māori were increasingly isolated from their traditional homes, extended families and cultural practices (Durie, 2001; Harpham, 1994). It is theorised that this process of urbanisation and the policies of assimilation held by the New Zealand governments of the time may have contributed towards an increased vulnerability in Māori to mental disorders (Durie, 1998; Kingi, 2005), with Māori rates of psychiatric
hospitalisation increasing throughout the 1980s and 1990s (Bridgeman & Dyall, 1996; Edmonds, Williams, & Walsh, 2000; Pomare, Keefe-Ormsby, & Ormsby, 1995; Te Puni Kōkiri, 1993), until Māori were comparatively overrepresented in inpatient populations. These patterns have continued, with analysis of more recent data revealing comparatively high rates of contact amongst Māori with both inpatient and community mental health sectors (Gaines, Bower, & Buckingham, 2003; New Zealand Health Information Service, 2004)
Research on the mental health of Māori within a community setting shows similar trends, with The Mental Health and General Practice Investigation showing that Māori (especially Māori women) present to primary care with higher rates of all common mental disorders in comparison to non-Māori (including anxiety, depression and substance abuse)(Bushnell & MaGPIe Research Group, 2005; MaGPIe Research Group, 2003a). These outcomes were consistent even when differences in socioeconomic status and age were accounted for (Bushnell & MaGPIe Research Group, 2005; MaGPIe Research Group, 2003b).
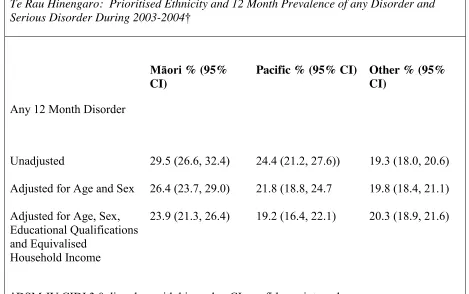
This disproportionately high representation of Māori with mental disorders is also evident in the Te Rau Hinengaro: The New Zealand Mental Health Survey, which used the Composite International Diagnostic Interview (CIDI 3.0) to gather data between October
4 Table 1:
Te Rau Hinengaro: Prioritised Ethnicity and 12 Month Prevalence of any Disorder and Serious DisorderDuring2003-2004†
Māori % (95% CI)
Pacific % (95% CI) Other % (95% CI)
Any 12 Month Disorder
Unadjusted 29.5 (26.6, 32.4) 24.4 (21.2, 27.6)) 19.3 (18.0, 20.6)
Adjusted for Age and Sex 26.4 (23.7, 29.0) 21.8 (18.8, 24.7 19.8 (18.4, 21.1)
Adjusted for Age, Sex, Educational Qualifications and Equivalised
Household Income
23.9 (21.3, 26.4) 19.2 (16.4, 22.1) 20.3 (18.9, 21.6)
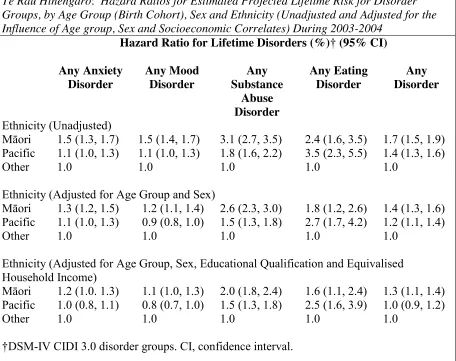
5 Table 2:
Te Rau Hinengaro: Hazard Ratios for Estimated Projected Lifetime Risk for Disorder Groups, by Age Group (Birth Cohort), Sex and Ethnicity (Unadjusted and Adjusted for the Influence of Age group, Sex and Socioeconomic Correlates) During 2003-2004
Hazard Ratio for Lifetime Disorders (%)† (95% CI)
Any Anxiety Disorder
Any Mood Disorder
Any Substance
Abuse Disorder
Any Eating Disorder
Any Disorder
Ethnicity (Unadjusted)
Māori 1.5 (1.3, 1.7) 1.5 (1.4, 1.7) 3.1 (2.7, 3.5) 2.4 (1.6, 3.5) 1.7 (1.5, 1.9) Pacific 1.1 (1.0, 1.3) 1.1 (1.0, 1.3) 1.8 (1.6, 2.2) 3.5 (2.3, 5.5) 1.4 (1.3, 1.6)
Other 1.0 1.0 1.0 1.0 1.0
Ethnicity (Adjusted for Age Group and Sex)
Māori 1.3 (1.2, 1.5) 1.2 (1.1, 1.4) 2.6 (2.3, 3.0) 1.8 (1.2, 2.6) 1.4 (1.3, 1.6) Pacific 1.1 (1.0, 1.3) 0.9 (0.8, 1.0) 1.5 (1.3, 1.8) 2.7 (1.7, 4.2) 1.2 (1.1, 1.4)
Other 1.0 1.0 1.0 1.0 1.0
Ethnicity (Adjusted for Age Group, Sex, Educational Qualification and Equivalised Household Income)
Māori 1.2 (1.0. 1.3) 1.1 (1.0, 1.3) 2.0 (1.8, 2.4) 1.6 (1.1, 2.4) 1.3 (1.1, 1.4) Pacific 1.0 (0.8, 1.1) 0.8 (0.7, 1.0) 1.5 (1.3, 1.8) 2.5 (1.6, 3.9) 1.0 (0.9, 1.2)
Other 1.0 1.0 1.0 1.0 1.0
†DSM-IV CIDI 3.0 disorder groups. CI, confidence interval.
When the Te Rau Hinengaro results are analysed using lifetime adjusted risk ratios, as seen in Table 3, the hazard ratios for life-time disorder indicate that Māori experience an
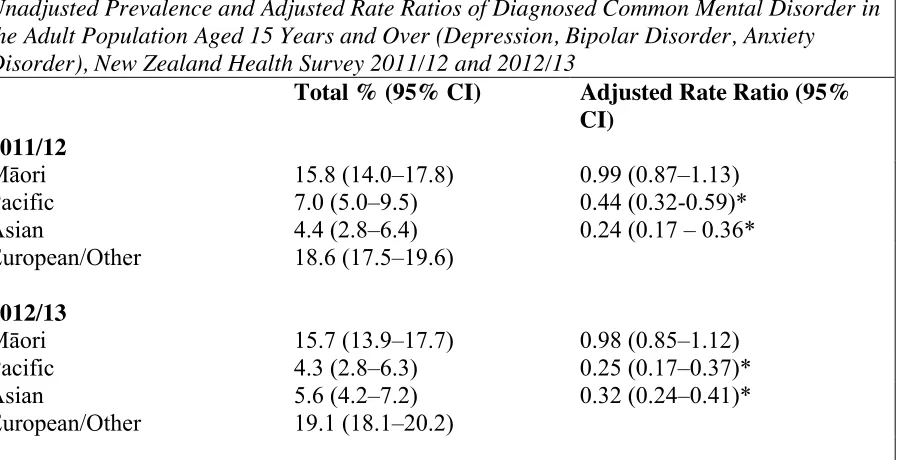
6 Table 3:
Unadjusted Prevalence and Adjusted Rate Ratios of Diagnosed Common Mental Disorder in the Adult Population Aged 15 Years and Over (Depression, Bipolar Disorder, Anxiety Disorder), New Zealand Health Survey 2011/12 and 2012/13
Total % (95% CI) Adjusted Rate Ratio (95%
CI) 2011/12
Māori 15.8 (14.0–17.8) 0.99 (0.87–1.13)
Pacific 7.0 (5.0–9.5) 0.44 (0.32-0.59)*
Asian 4.4 (2.8–6.4) 0.24 (0.17 – 0.36*
European/Other 18.6 (17.5–19.6)
2012/13
Māori 15.7 (13.9–17.7) 0.98 (0.85–1.12)
Pacific 4.3 (2.8–6.3) 0.25 (0.17–0.37)*
Asian 5.6 (4.2–7.2) 0.32 (0.24–0.41)*
European/Other 19.1 (18.1–20.2)
A rate ratio less than 1 means the outcome is less likely in the group of interest than in the reference group. A rate ratio greater than 1 means the outcome is more likely in the group of interest. Rate ratios adjust for factors such as age, sex and ethnic group. Statistically
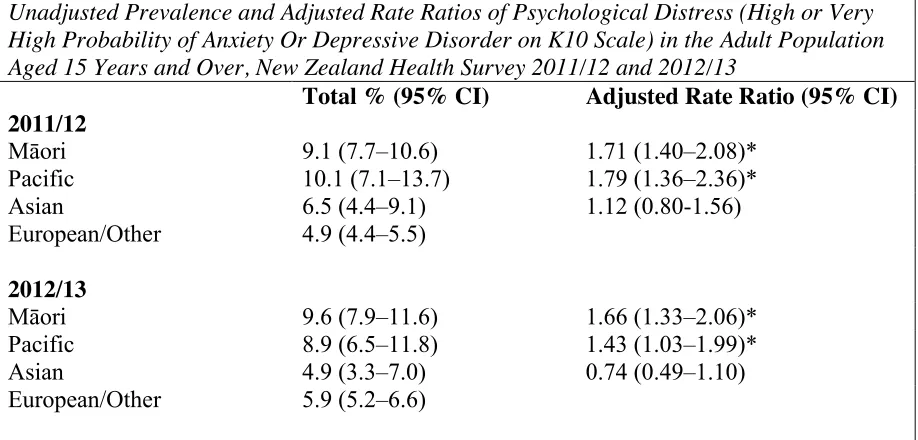
7 Table 4:
Unadjusted Prevalence and Adjusted Rate Ratios of Psychological Distress (High or Very High Probability of Anxiety Or Depressive Disorder on K10 Scale) in the Adult Population Aged 15 Years and Over, New Zealand Health Survey 2011/12 and 2012/13
Total % (95% CI) Adjusted Rate Ratio (95% CI) 2011/12
Māori 9.1 (7.7–10.6) 1.71 (1.40–2.08)*
Pacific 10.1 (7.1–13.7) 1.79 (1.36–2.36)*
Asian 6.5 (4.4–9.1) 1.12 (0.80-1.56)
European/Other 4.9 (4.4–5.5)
2012/13
Māori 9.6 (7.9–11.6) 1.66 (1.33–2.06)*
Pacific 8.9 (6.5–11.8) 1.43 (1.03–1.99)*
Asian 4.9 (3.3–7.0) 0.74 (0.49–1.10)
European/Other 5.9 (5.2–6.6)
A rate ratio less than 1 means the outcome is less likely in the group of interest than in the reference group. A rate ratio greater than 1 means the outcome is more likely in the group of interest. Rate ratios adjust for factors such as age, sex and ethnic group. Statistically
significant rate ratios are noted with an asterisk (*).
This anomaly could be due to the definition of ‘common mental disorders’ used in the New Zealand Health Survey, which included only the internalising disorders of major depression, anxiety disorder and bipolar disorders. This definition excludes all externalising disorders, substance abuse disorders and suicidality, which may have impacted on the findings. The findings of reducing rates of disorder amongst Māori and similar rates of disorder amongst Māori and non-Māori may also be a consequence of the survey’s reliance on the individual’s self-report of ‘diagnosis by a doctor’ (Ministry of Health, 2012). This reliance on the
8 experience psychological distress than non-Māori (as measured by the Kessler Psychological Distress Scale (K10) (Kessler et al., 2002). This finding is supportive of the suggestion that Māori with mental disorders may be less likely to seek help for and/or may face more barriers to accessing mental health services (Ministry of Health, 2012).
1.2 Adolescent Mental Health
Identification and treatment of mental disorders in adolescence is needed in order to minimise the negative impacts of mental disorders later in life (Copeland, Shanahan, Costello, & Angold, 2009; Newman et al., 1996). The body of literature regarding the prevalence of mental disorders in New Zealand adolescents is growing, with available research indicating a substantial proportion of New Zealand adolescents experiencing mental health problems. Studies indicate that the 12 month prevalence rates of disorder amongst adolescents (using DSM-III and DSM_III_R criteria) range from 18.2% to 25.9% at age 15 (Fergusson & Horwood, 2001; McGee et al., 1990), increasing to 36.6% to 42% at age 18 (Feehan, McGee, Raja, & Williams, 1994; Fergusson & Horwood, 2001). More recent school based surveys (2012) investigated aspects of the mental and emotional health of adolescents attending secondary schools in New Zealand. The results indicate that 9% to 16% of students reported clinically significant depression symptoms (based on the Reynolds Adolescent Depression Scale – Short Form (RADS-SF) (Clark et al., 2013; Milfont et al., 2008; Reynolds & Mazza, 1998). Suicidality was also investigated, with 10% to 21% of students having seriously thought about suicide in the previous 12 months and 2% to 6% of students having attempted suicide during the last year (Clark et al., 2013). Furthermore, questions around substance abuse behaviours revealed that 23% of students reported binge drinking in the last four weeks, and 13% were currently using marijuana (Clark et al., 2013).
9 to the longer time period under examination. In addition to this, the use of DSM criteria for psychiatric disorders as used by Feehan et al. (1994) and Fergusson and Horwood (2001) generally appears to yield higher prevalence rates than the Rutter interview schedules, questionnaires, or classification procedures (Roberts et al., 1998; Rutter, Tizard, & Whitmore, 1970), which were used in a majority of the studies reviewed by Roberts et al. (1998).
1.3 Mental Health of Māori Adolescents
The body of research examining the mental health of Māori adolescents is also expanding, with available research indicating that there is a similar pattern of Māori overrepresentation in New Zealand’s adolescent mental health indices as observed the adult Māori population. Trends in inpatient statistics are similar to those in adult populations, with van Kessel, Myers, Stanley, and Reed (2012) finding that over a 10-year period admissions to a regional child and adolescent psychiatric inpatient unit by those of Māori descent increased. They also found that there was an over-representation of young Māori being admitted to the unit relative to the catchment population.
Patterns of adolescent Māori mental health in a community setting also indicate that Māori youth have a higher prevalence of mental disorder symptoms than their Pākehā / NZ European counterparts. The Youth’07 Survey of Health and Wellbeing of New Zealand Secondary School Students found that Māori females (16.4%) were significantly more likely to report depressive symptoms than Pākehā/NZ European females (12.7%), and that Māori were more likely to report engaging in binge drinking (50.9% vs 35.6% respectively), and weekly marijuana use (10.2% vs 3.7%)(Clark et al., 2008). Māori students were also more likely to have made a suicide attempt, (4.4% - 9.6%) compared to Pākehā/NZ European students (2.4% - 5.1%) (Clark et al., 2008). This increased prevalence of suicidality in Māori youth is supported by Beautrais and Fergusson (2006), who found Māori youth aged 15 to 24 were 2-3 times more likely to die by suicide than non-Māori youth.
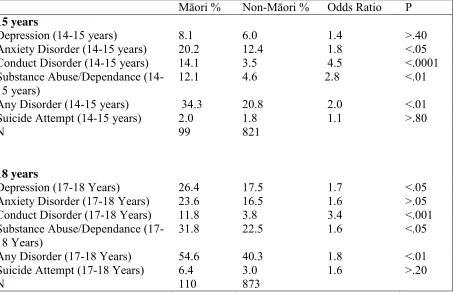
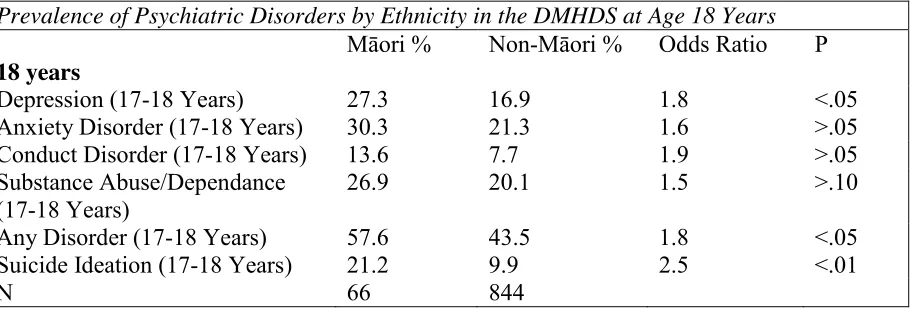
Large longtitudinal cohort studies have also found that Māori adolescents have a higher prevalence of mental disorder than non-Māori, with both the Christchurch Health and Develpment Study (CHDS, Table 5) and the Dunedin Multidisciplinary Health and
10 conduct disorder, substance abuse or dependence, and any mental disorder. The exceptions were depression and suicide attempt at age 14-15 for which there was no significant ethnic differences in prevalence rates. Findings from the CHDS also found that Māori had higher odds of depression, conduct disorder, substance abuse and any mental disorder at ages 17-18, while the DMHDS found that Māori aged 17-18 had higher odds of depression, suicidal ideation and any mental disorder (Fergusson, Poulton, et al., 2003). The differences in results between the DMHDS and the CHDS is suprising given that the methodology used is similar. However, the differences in findings may reflect the differences in Māori sample sizes, with the DMHDS relying on a Māori sample that was roughly 40% smaller than the CHDS sample. Despite some differences in results, the research reviewed above collectively indicates that Māori youth are at a higher risk of experiencing mental health problems than non-Māori New Zealand adolescents, pointing to a need for further research into the mechanisms and factors influencing these higher prevalence rates.
Table 5:
12 Month Prevalence of Psychiatric Disorders by Ethnicity in the CHDS at Ages 15 and 18 Years
Māori % Non-Māori % Odds Ratio P
15 years
Depression (14-15 years) 8.1 6.0 1.4 >.40
Anxiety Disorder (14-15 years) 20.2 12.4 1.8 <.05
Conduct Disorder (14-15 years) 14.1 3.5 4.5 <.0001
Substance Abuse/Dependance
(14-15 years) 12.1 4.6 2.8 <.01
Any Disorder (14-15 years) 34.3 20.8 2.0 <.01
Suicide Attempt (14-15 years) 2.0 1.8 1.1 >.80
N 99 821
18 years
Depression (17-18 Years) 26.4 17.5 1.7 <.05
Anxiety Disorder (17-18 Years) 23.6 16.5 1.6 >.05
Conduct Disorder (17-18 Years) 11.8 3.8 3.4 <.001
Substance Abuse/Dependance
(17-18 Years) 31.8 22.5 1.6 <.05
Any Disorder (17-18 Years) 54.6 40.3 1.8 <.01
Suicide Attempt (17-18 Years) 6.4 3.0 1.6 >.20
N 110 873
11 Table 6:
Prevalence of Psychiatric Disorders by Ethnicity in the DMHDS at Age 18 Years
Māori % Non-Māori % Odds Ratio P
18 years
Depression (17-18 Years) 27.3 16.9 1.8 <.05
Anxiety Disorder (17-18 Years) 30.3 21.3 1.6 >.05
Conduct Disorder (17-18 Years) 13.6 7.7 1.9 >.05
Substance Abuse/Dependance (17-18 Years)
26.9 20.1 1.5 >.10
Any Disorder (17-18 Years) 57.6 43.5 1.8 <.05
Suicide Ideation (17-18 Years) 21.2 9.9 2.5 <.01
12
1.4 Life-course Developmental Theory
Developmental life course theory emerged in the 1960s. and integrates knowledge and theory from several disciplines including sociology, anthropology, social history, demography and psychology. The life course refers most broadly to a theoretical orientation that encourages the study of changing lives in changing contexts, and stems from a sociological view of human development, integrating role theory, and theories of aging (Noguchi & Yoshioka, 2009). Building on advances since the 1960’s, life-course theory has developed to examine the human life course by observing developmental processes and how these interact with ongoing changes in society. The premise behind this is that age situates people in particular birth cohorts and social structures. Particular events that occur or social policies in place during the lives of a given cohort can intersect with their development to influence their life course (examples of such events or policies might include the abolition of slavery, women gaining the right to vote, or intra- and inter-country conflict and war).
Life course theory is defined by four key principles: (1) The principle of historical time and place – our lives are embedded in and shaped by historical context. (2) The principle of human agency – individuals help shape their development through their own choices and actions, yet within the constraints of historical and social circumstance. (3) The principle of linked lives – our lives are intertwined through social relationships. (4) The principle of timing – the meaning and impact of a life transition is contingent on when it occurs (Elder, 1998). In addition to these principles, life course theory operates on the premise that human development and ageing are a lifelong processes and are more fully understood from a lifespan perspective. This suggests that any change in an individual’s life course has consequences for their developmental trajectory. The childhood years of development therefore have formative implications for subsequent trajectories and healthy adaptations in later life (Elder, 1998).
13 exposure early in the life course, particularly during a sensitive period, is associated with a certain health outcome after a period of time. (2) Accumulation – in which exposure to disadvantageous experiences and environments accumulate, increasing the risk of a certain
health outcome. (3) Pathways or “chains of risk” – in which exposures in the early life
course are associated with later health outcomes through a “chain” or series of intervening
risks (Kuh et al., 2003). These models of the life course are not necessarily mutually exclusive and any health outcome may have a number of models applied (Power & Hertzman, 1997). A life course development perspective has also been applied to mental health outcomes and psychopathology (Bell, 2014; Shanahan, 2010), with efforts being made to identify early risk factors or pathways that may contribute to the development of poor mental health or psychiatric disorder throughout the life course. Longitudinal birth cohort studies are generally well suited to these types of investigations as data is collected at regular intervals from birth onwards throughout the life course, enabling researchers to identify early risk factors, pathways, and trajectories that lead to the outcome of interest (Costello &
Angold, 2007).
As discussed previously, New Zealand Māori appear to have higher prevalence rates of psychiatric disorder than their non-Māori counter parts, with this trend extending to
adolescent populations. When considered from a developmental life course perspective, these ethnic differences in rates of mental disorder could be linked to ethnic differences in
exposure to early risk factors for psychopathology, with Māori potentially having higher rates of exposure to early risk factors for psychopathology than non-Māori. The potential for ethnic differences in exposure to early risk factors for psychopathology warrants further investigation, as findings may have important implications for public health, especially regarding reduction in ethnic inequalities in mental health and the value of early intervention.
1.5 Risk Factors Associated with Poor Mental Health
A risk factor is any characteristic at the biological, family, or community (including peers and culture) level that is associated with an increased likelihood that an individual will develop a negative outcome such as disease or psychological disorder (Cicchetti, 1989; Cicchetti & Cohen, 2006). In the context of this study risk factors refer to factors that
increase an individual’s risk of developing suicidal ideation or psychiatric disorder.
14 ensure that a specific outcome, such as psychopathology, will inevitably occur. Rather, the presence of a risk factor suggests an increased probability or chance that the negative outcome might develop (Cicchetti, 1989; Cicchetti & Cohen, 2006).
The following paragraphs will identify risk factors known to be associated with poor mental health and psychiatric disorder, and will review literature regarding the associations between exposure to these factors during childhood and mental health outcomes during adolescence. Ethnic differences in exposure to these adverse factors will also be examined.
1.5.1 Low Socio-Economic Status
Socio-economic status (SES) generally refers to an individual’s or family’s economic and social position in relation to others and may be derived from a number of measures including income, education level and occupation (Kahl & Davis, 1955). SES is generally broken up into three categories (high SES, middle SES and low SES) to describe the level of socio-economic status an individual or family has. High SES is associated with high income, high educational qualifications, and highly trained or qualified occupations that generally have a higher degree of autonomy or responsibility, while low SES is associated with low income, a lack of educational qualifications and occupations that are less well paid, do not require much training or qualifications and generally have a lower level of autonomy (Ganzeboom, De Graaf, & Treiman, 1992).
Research has indicated that low SES is associated with a number of adverse health outcomes, including that of poor mental health (Graham, 2007; Gu, Xu, Yang, & Li, 2010). Research has shown low SES to be associated with increased rates of a number of mental health problems including both internalising disorders and externalising disorders (Compton, Conway, Stinson, Colliver, & Grant, 2005; Lorant et al., 2003; Miech, Caspi, Moffitt, Wright, & Silva, 1999; Redonnet, Chollet, Fombonne, Bowes, & Melchior, 2012; Regier, Narrow, & Rae, 1990; Thomas, Stinson, Grant, & Compton, 2007; Van Oers, Bongers, Van de Goor, & Garretsen, 1999). These associations between socio-economic disadvantage and psychiatric disorder are supported by findings from a seven year longitudinal study
15 provided evidence for links between adverse socio-economic conditions and psychological distress in a New Zealand context. Foulds et al. (2014) examined the relationship between living standard and psychological distress using a community sample of 8,465 New Zealand adults and found that higher levels of psychological distress were more prevalent in those with a lower standard of living, with the prevalence of high psychological distress increasing steeply with decreasing living standards. Specifically, 24.3% of those in the most deprived decile experienced high psychological distress, compared to only 0.8% in the least deprived decile (Foulds et al., 2014).
Poor socio-economic status has also been shown to be a risk factor for externalising problems, with socio-economic disadvantage predicting later externalising problems,
including antisocial behaviour, violent behaviour and criminal offending (Farrington, 2003). This was shown in the Cambridge Study in Delinquent Development, a prospective
longitudinal survey of the development of offending and antisocial behaviour in 411 South London boys, mostly born in 1953 and followed up by personal interviews from age 8 to age 46 (Farrington, 2003). Findings indicated that low family income, large family size and low socio-economic status were important childhood predictors of later violent behaviour, chronic offending, and antisocial personality at ages 21 and 32 (Farrington, 2000; Farrington & West, 1993).
1.5.2 Low Socio-Economic Status During Childhood and Adolescence
The association between socio-economic adversity and poor mental health outcomes has also been found in child and adolescent populations (Drakopoulos, Lakioti, & Theodossiou, 2011; McLaughlin et al., 2011). Children from low SES families are more likely to exhibit anti-social behaviour (Evans & Cassells, 2014; Piotrowska, Stride, Croft, & Rowe, 2015), with both oppositional defiant disorder and conduct disorder being more prevalent amongst youths from families of low SES (Lahey, Waldman, & McBurnett, 1999). Low family SES has also been associated with a higher risk of anxiety disorders, disruptive disorders, and personality disorders in youth (Gilman, Kawachi, Fitzmaurice, & Buka, 2002; Johnson, Cohen,
Dohrenwend, Link, & Brook, 1999; McLaughlin et al., 2011; Najman et al., 2010; Nikulina, Widom, & Czaja, 2011). A number of studies have also suggested that family SES is
associated with depression amongst children and adolescents (Goodman, Huang, Wade, & Kahn, 2003; Johnson et al., 1999; Kubik, Lytle, Birnbaum, Murray, & Perry, 2003;
16 some studies have found associations between low SES and adolescent alcohol and substance use (Droomers, Schrijvers, Casswell, & Mackenbach, 2003; Lowry, Kann, Collins, & Kolbe, 1996; Stoolmiller et al., 1997), others studies have found that high SES adolescents have higher rates of substance and alcohol use (Hanson & Chen, 2007b; Humensky, 2010). Others still have found no significant relationship between SES and alcohol and substance use (Hanson & Chen, 2007a; Tuinstra, Groothoff, van den Heuvel, & Post, 1998).
Two large reviews of relevant literature have further supported these associations between early socio-economic disadvantage and poor mental health outcomes in children and adolescents. A review by Reiss (2013) found that, of the 55 published studies reviewed, 52 suggest an inverse relationship between socioeconomic status and poor mental health outcomes in children and adolescents, with children and adolescents from low SES families being two to three times more likely to develop mental health problems than those from high SES families. In addition to this, Reiss (2013) found that that persistent low SES over time was strongly related to higher rates of mental health problems, and that a decrease in SES was linked to increasing mental health problems. A meta-analysis conducted by Letourneau, Duffett-Leger, Levac, Watson, and Young-Morris (2013) also found links between low SES and children and adolescents’ internalising and externalising problems. However, while the results of the Letourneau et al. (2013) meta-analysis did meet significance (p<.01 for
aggression, p<.05 for internalising behaviours), the findings were of a very small magnitude.
This is surprising given the research linking low SES to adverse child and adolescent developmental outcomes (Bornstein & Bradley, 2003; Keating & Hertzman, 1999). It is possible that the magnitude of the Letourneau et al. (2013) findings may have been affected by the comparatively small number of studies that met the inclusion criteria for their meta-analyses (only 7 articles were included in the externalising meta-analysis and 5 were included in the internalising meta-analysis), with the authors themselves noting that their strict
selection criteria resulted in the exclusion of a large number of articles and has limited the ability to generalise their findings over time.
The above research reveals that low SES is a risk factor for poor mental health during all life stages, with socioeconomic disadvantage being associated with a number of psychiatric disorders in childhood, adolescence and adulthood. Studies have also revealed that
17 poverty and later mental health outcomes has been proposed to impact upon an individual’s life course in a number of different ways. It has been suggested that stressful socioeconomic environments can produce parental stress and behaviour that impacts upon children’s
developmental outcomes (McLoyd & Wilson, 1990; McMahon & Peters, 2002), while others argue that lower SES affects child development through the inability of parents to provide the tangible material resources needed to support healthy development (Bradley & Corwyn, 2002). Still others believe it is a combination of these factors, suggesting that parents in stressful economic situations find it difficult to provide the tangible or intangible resources required for children’s successful development (Elder, Conger, Foster, & Ardelt, 1992; Lempers, Clark-Lempers, & Simons, 1989; Letourneau et al., 2013). Exclusion and social isolation, which contribute to the prevalence of externalising and internalising behaviours (Gazelle & Ladd, 2003; Heberle, Krill, Briggs-Gowan, & Carter, 2014; Rubin & Mills, 1988), have also been linked with low SES (Stewart et al., 2009), and research suggests that such “relational poverty,” (i.e., a relatively small social support network), can have an adverse impact on children’s behaviour and development (Kalff et al., 2001; Perry & Szalavitz, 2007; Perry & Szalavitz, 2010). It has also been proposed that low SES may impact on child development through its links with parental poor mental health (Petterson & Albers, 2001), which is associated with poor caregiver–child attachment and uninvolved, inconsistent and unsupportive parenting styles (Crittenden, 2008; Meadows, McLanahan, &
Brooks‐Gunn, 2007).Whilst these various pathways all refer to different mechanisms by
which adverse socio-economic conditions may affect child development and the development of mental disorders; regardless of the exact mechanism at play, the general consensus is that exposure to adverse socio-economic conditions during childhood can influence the
developmental life course of children in a negative way, increasing risks of poor mental health during and throughout life.
1.5.3 Childhood Adversity
Childhood adversity refers to stressful or traumatic experiences that occur during childhood, and is also referred to in research as adverse childhood experiences (ACEs) (Babiss, 2012; Kalmakis & Chandler, 2014). Childhood adversity has been operationally defined in a
number of different ways by researchers. This includes types of maltreatment such as neglect, emotional abuse, physical abuse and sexual abuse (Fergusson, Horwood, & Lynskey, 1994; Pietrek, Elbert, Weierstall, Müller, & Rockstroh, 2013). Previous research has also
18 abuse, and parental psychopathology (Benjet, Borges, Méndez, Fleiz, & Medina-Mora, 2011; Fergusson et al., 1994; Schilling, Aseltine, & Gore, 2008). Factors that contribute to family instability or dysfunction have also been considered by researchers to be forms of childhood adversity, including family conflict or violence, divorce, number of changes in parental figure, and parental or interpersonal loss (Fergusson & Horwood, 2003; McLaughlin et al., 2012; Rosenman & Rodgers, 2004).
There are numerous studies that support the association between childhood adversity and poor mental health outcomes, with a range of evidence available regarding associations between various childhood adversities and later maladjustment and psychopathology. Childhood adversities that have been linked to later maladjustment and psychiatric disorder include emotional abuse (Chapman et al., 2004; Pietrek et al., 2013; Sareen, Fleisher, Cox, Hassard, & Stein, 2005), parental physical abuse (Kendler et al., 2000; Sareen et al., 2005; Sugaya et al., 2012; Yager, 2012), parental sexual abuse (Kendler et al., 2000; Mullen, Martin, Anderson, Romans, & Herbison, 1993; Sareen et al., 2005), parental alcohol abuse (Serec et al., 2012), parental substance abuse (Johnson & Leff, 1999; Osborne & Berger, 2009a), poor parenting (Jorm, Dear, Rodgers, & Christensen, 2003; Levitan, Rector, Sheldon, & Goering, 2003), divorce (Amato & Keith, 1991; Chase-Lansdale, Cherlin, & Kiernan, 1995; Cherlin, Chase-Lansdale, & McRae, 1998; Pryor & Rodgers, 2001), the number of changes in parental figures (Capaldi & Patterson, 1991), parental loss (Agid et al., 1999; Bifulco, Harris, & Brown, 1992), and parental psychopathology (Sareen et al., 2005).
While these childhood adversities each appear to be individually associated with later
maladjustment and psychiatric disorder, studies have shown that a dose response relationship is present for the number of adversities reported and the risk for later psychopathology, with cumulative child adversity (where an individual is exposed to increasing numbers of child adversity factors) appearing to result in an increased risk of developing later
19 birth cohort of 1265 children born in 1977. Horwood and Fergusson (1998) found very strong tendencies for risks of disorder to increase with increasing childhood adversity. Their
research revealed that, of those with the highest childhood adversity scores, 94% met criteria for at least one psychiatric disorder, and over 70% met criteria for two or more disorders. In comparison, of those with the lowest adversity scores, less than 30% of met criteria for any psychiatric disorder and less than 10% for multiple disorders (Horwood & Fergusson, 1998). These findings are consistent with a developmental lifecourse perspective, particularly with the model of accumulation – in which exposure to disadvantageous experiences and
environments accumulate, increases the risk of a certain health outcome, with adverse childhood experiences appearing to accumulate and increase the risk of psychiatric disorder in later life.
In addition to this cumulative effect, childhood adversities are often highly clustered, with considerable overlap, implying that those who have experienced one childhood adversity are likely to have been exposed to multiple childhood adversities (Agho, Stevens, Jacobs, & Raphael, 2012; Dong et al., 2004; Ney, Fung, & Wickett, 1994). This clustering of childhood adversities may have implications for studies that investigate the influence of single childhood family adversities on later mental health outcomes. Specifically, the effect of a single childhood adversity may be overestimated, as rather than representing the impact of a single childhood adversity, later outcomes may instead be due to the cumulative effect of multiple clustered adversities, or the influence of one or more correlated adversities that was not included in the study (Agho et al., 2012). This indicates that the investigation of multiple rather than single childhood adversities is necessary in order to avoid overestimating the influence of a single particular childhood adversity (Finkelhor, Ormrod, & Turner, 2007; Kessler, Davis, & Kendler, 1997; Mullen, Martin, Anderson, Romans, & Herbison, 1996). Findings have also indicated that childhood adversities are often nonspecific in their associations with various psychiatric disorders (Arata, Langhinrichsen-Rohling, Bowers, & O’Brien, 2007; Collishaw et al., 2007; Kessler et al., 1997). It is therefore beneficial to investigate multiple psychiatric outcomes so that overly narrow interpretations can be avoided.
20 childhood adversities are associated with mental disorder at all life-course stages, including childhood, adolescence, young adulthood and later adulthood (Kessler, Angermeyer, et al., 2010; McLaughlin et al., 2010). A 45-year longitudinal study by Clark, Caldwell, Power, and Stansfeld (2010) adds further support to the associations between childhood adversity and later psychiatric disorder. Clark et al. (2010) analysed data from 9377 cohort members of the 1958 British birth cohort and found that after adjusting for socio-economic position,
childhood adversities were associated with psychopathology during adolescence (16 years, odds ratio (OR) of 5.56), early adulthood (23 years, OR 3.96), and mid-life (45 years, OR 3.68).
Available research focusing exclusively on adolescence has indicated that there is an
association between childhood adversity and psychopathology, with significant associations having been found between childhood adversities and rates of both psychiatric disorder and adjustment problems during adolescence (Fergusson & Lynskey, 1995). Findings by Dunn et al. (2011) add further support to this association, with adolescents classed as having severe childhood adversity experiencing much higher odds of adolescent psychopathology
compared to those who experienced low childhood adversity (ORs of 8 for disruptive behaviour disorders, 4.8 for depression and 2.0 for anxiety disorders). However these results may have been influenced by the fact that data regarding childhood adversities was collected predominantly from mothers, which may have resulted in the over- or under-reporting of some indicators (Fisher, Bunn, Jacobs, Moran, & Bifulco, 2011), and the misclassification of individuals’ childhood adversity levels (low, moderate or severe).
Further research indicates that exposure to childhood adversity may explain a sizeable proportion of psychiatric disorder onset during adolescence. For example, in a study by McLaughlin et al. (2012), childhood adversities were found to be strongly associated with the onset of psychiatric disorders amongst adolescents, with population-attributable risk
proportions indicating that in a predictive sense childhood adversities explain 28.2% of all psychiatric disorders, 15.7% of fear disorders (phobias and panic disorders), 32.2% of distress disorders (separation anxiety disorder, generalised anxiety disorder, posttraumatic stress disorder (PTSD), and major depressive disorder or dysthymia), 34.4% of substance use disorders and 40.7% of behavioural disorders (CD, oppositional defiant disorder, and
21 life course acting in a cumulative fashion to increase an individual’s risk of psychopathology during adolescence and across the life-course.
1.5.4 Deviant Peer Affiliation
Deviant peer affiliation generally refers to the affiliation of an individual with friends that engage in delinquent or deviant behaviour (Snyder, Dishion, & Patterson, 1986). In previous research behaviour that has been considered delinquent or deviant has included: using drugs, drinking alcohol, smoking cigarettes, stealing, violent behaviour, criminal offending and truanting (Fergusson & Horwood, 1999; Heinze, Toro, & Urberg, 2004; Reedy & Saunders, 2013; Snyder et al., 1986). Two general processes regarding the associations between deviant peer affiliations and delinquent and antisocial behaviour have been proposed. First, the association could reflect a cause and effect linkage in which through higher exposure to delinquent peers, individuals are set on a life-course that has an increased involvement in crime and substance abuse, and this higher exposure leads to a higher likelihood of an individual developing deviant behaviour through socialisation processes (Fergusson, Swain-Campbell, & Horwood, 2002). An alternative explanation is that the association is non-causal and arises because of the selective processes in which children experience disadvantaged, dysfunctional, or disturbed backgrounds, which shifts their life course trajectory onto a path that has an increased likelihood of affiliation with delinquent peers (Fergusson & Horwood, 1999).
Irrespective of causality, affiliation with deviant peer groups is a common characteristic of adolescents at risk of alcohol and substance abuse (Fahnhorst & Winters, 2005; Fergusson et al., 2002; Gauffin, Vinnerljung, Fridell, Hesse, & Hjern, 2013), delinquency (including property crime and violent crime) (Fergusson et al., 2002; Haynie & Osgood, 2005; Keijsers et al., 2012), and other externalising behaviours (Barrera et al., 2002; Buehler, 2006;
Dekovic, 1999; Fergusson et al., 2002; Keijsers et al., 2012). Deviant peer affiliation in adolescence has also been associated with adolescent depressive symptoms and internalising problems (Barrera et al., 2002; Dekovic, 1999; Fergusson, Wanner, et al., 2003), and higher levels of conduct disorder and oppositional defiant disorder (Boden et al., 2010).
22 to delinquent peers was the most frequently reported significant risk factor for adolescent delinquency (cited in 13 of 28 studies), and adolescent problem drinking (reported in 15 of 30 studies). The authors also found that attachment to delinquent peers was a significant risk factor in studies that concurrently investigated risk factors for both adolescent delinquency and adolescent problem drinking (cited in five of six studies).
1.6 Exposure to Risk Factors for Psychopathology Amongst New Zealand Māori
The research reviewed above documents clear links between early socioeconomic disadvantage, childhood adversity and psychopathology later in life; while deviant peer affiliation during adolescence has also been associated with adolescent maladjustment including substance abuse, depression, and antisocial and delinquent behaviours. The following paragraphs will explore whether there are ethnic differences in exposure to these indicators in a New Zealand context, with a focus on New Zealand Māori.
1.6.1 New Zealand Ethnic Differences in Exposure to Low SES
Available research indicates that in New Zealand, Māori are more likely to experience socio-economic disadvantage than non-Māori. Salmond and Crampton (2000) have indicated that a large proportion of Māori live in poverty, with Māori being under-represented in the top income quintiles and over-represented in the lower income quintiles. In addition to this, a study by Carter and Imlach Gunasekara (2012) using longitudinal data has found that low income rates were more prevalent amongst Māori respondents, and that Māori were more likely to have low income throughout the duration of the study, with 10.8% of Māori consistently having a low income across the study (2002-2010) compared to 5.3% NZ
European and 7.7% of other ethnicities. In addition to income, Carter and Imlach Gunasekara (2012) also measured material signs of deprivation and found that approximately three times more Māori than NZ European were in deprivation throughout the study.
23 standards throughout childhood, including rates of poverty (Marie et al., 2014; Perry, 2014), with Perry (2014) finding that approximately 16% of NZ European/Pākeha children were found to be living in poor households, compared to 34% of Māori children. Ethnic differences on other socio-economic indicators also reveal that Māori children are more likely to be born to women of a younger maternal age (Cotterell & von Randow, 2008; Cribb, 2009), are more likely to live in sole parent families than non-Māori (Cotterell & von Randow, 2008; Cribb, 2009; Kiro, von Randow, & Sporle, 2010; Ministry of Justice, 2010), and are more likely to live with parents who have no formal educational qualifications (Ministry of Justice, 2010). Collectively, this research indicates that Māori are significantly more likely than non-Māori to be socioeconomically disadvantaged, with these socio-economic ethnic inequalities beginning in childhood and appearing to maintain throughout the life-course.
1.6.2 New Zealand Ethnic Differences in Exposure to Childhood Adversity
Available research indicates that Māori are also more likely to experience childhood adversity than their non-Māori counterparts. Wynd (2013) found that Māori were
consistently over-represented in substantiated cases of child abuse, with data suggesting that Māori children were more than twice as likely to suffer child abuse as NZ European children. Dannette Marie, D. M. Fergusson, and Joseph M. Boden (2009) also investigated ethnic differences in child abuse and found that while Māori children were more likely to report harsh or abusive levels of physical punishment (14.0% of Māori, as compared with 5.5% of non-Māori), there were no significant ethnic differences in rates of childhood sexual abuse. Ethnic inequalities also appear to be present in other forms of childhood adversity, with Marie et al. (2009) finding that Māori were significantly more likely than non-Māori to be exposed to parental alcohol abuse (23.8% of Māori vs 10.7% of non-Māori), parental illicit drug use (38.7% of Māori vs 22.2% of non-Māori) and parental criminal offending (29.5% of Māori vs 11.2% of non-Māori). The same study also found that Māori have significantly greater levels of exposure to inter-parental violence during childhood, and on average had a significantly higher number of changes in parental figures. Marie et al. (2009) concluded that overall Māori were significantly more likely to experience poor family functioning (as measured by the above indicators) than non-Māori.
1.6.3 New Zealand Ethnic Differences in Deviant Peer Affiliation
24 Māori and non-Māori adolescents. However, ethnic differences in deviant peer affiliation have been recorded by studies conducted in the USA, with these studies indicating that African - American youth (the ethnic minority) have higher levels of deviant peer affiliation than European – Americans (the ethnic majority) (Deutsch, Crockett, Wolff, & Russell, 2012; Haggerty, Skinner, McGlynn-Wright, Catalano, & Crutchfield, 2013).
Māori adolescents have been shown to have significantly higher rates of externalising
disorders compared to their European New Zealand/Pākeha peers, including conduct disorder and substance abuse (Fergusson, Poulton, et al., 2003), both of which are associated with deviant peer affiliation. This known association between externalising disorders and deviant peer affiliation suggests that, as Māori have higher rates of externalising disorders, they may also have higher rates of deviant peer affiliation. This link is speculative however and further research is required to investigate whether this is the case.
1.7 Summary
Research has quite clearly established statistically significant and stable associations between exposure to socio-economic disadvantage during childhood and poor mental health outcomes during adolescence. There is also mounting evidence that there are higher rates of
psychological disorder amongst adolescents who have been exposed to childhood adversity. Based on the findings of the research reviewed above, developmental life-course theory would propose that socio-economic disadvantage and childhood adversity may be early risk factors that place individuals on a pathway that is more likely to lead to psychological disorder in adolescence. As Māori have higher recorded rates of exposure to both of these early risk factors (childhood socio-economic disadvantage and childhood adversity), developmental life-course theory would indicate that Māori are placed on a life-course that has a higher risk of psychopathology during adolescence. Indeed, available data on
prevalence rates of psychiatric disorder in New Zealand has revealed that Māori adolescents have higher prevalence rates of psychiatric disorder than their non-Māori counterparts. Further study is required to determine the magnitude of the effect of these risk factors.
25 between Māori ethnicity and adolescent psychopathology. Overall, the link between Māori ethnicity and high rates of mental disorder during adolescence represents an important, yet under-researched issue that requires further attention. While some early risk factors for adolescent psychopathology have been identified, further research is needed to ascertain their role in mediating the link between Māori ethnicity and adolescent psychopathology. Further research is also required to identify if ethnic differences exist in other known risk factors for adolescent maladjustment, such as deviant peer affiliation, and to investigate whether these too mediate the link between Māori ethnicity and poor mental health outcomes in
adolescence.
1.8 Limitations of Current Research
While research into risk factors for psychopathology in adolescent populations has clarified the links between childhood experiences of adversity, socioeconomic disadvantage and later mental health outcomes, some methodological problems exist that prevent firm conclusions being made regarding causality. Many of the studies reviewed above used cross-sectional designs, with retrospective reporting of childhood socio-economic conditions and childhood adversities. These methods can result in recall bias (Maughan & Rutter, 1997), and also prevent researchers from drawing firm conclusions regarding causality as it is difficult to ascertain temporal priority.
Another issue that arises in investigating SES and childhood adversity is that different studies have used different measures to ascertain different levels of childhood SES. For example, studies can focus on relatively specific indicators of SES (for example family income), or a range of forms of SES such as family income, parent occupation and level of the parent’s highest educational qualification. Similarly there is a wide variety of indicators of childhood adversity that may be used to assess childhood adversity, with the particular indicators used differing between studies, making it difficult to ascertain if researchers are measuring the same associations.
26
1.9 The Current Study
Against this general background, the current study has used longitudinal data collected from birth to age 21 years as part of the Christchurch Health and Development Study (CHDS) to examine the relationships between ethnicity, measured when cohort members were 14 years old, and mental disorder in later adolescence (15-18 years). In particular, this study examined whether the ethnic differences in rates of mental disorder during adolescence can be
accounted for by the higher rates of exposure amongst Māori to early and concurrent risk factors for maladjustment and psychopathology. In order to achieve this, this study examined the extent to which associations between ethnicity and mental health were maintained after controlling for early socioeconomic factors, childhood adversity, and deviant peer affiliation in adolescence.
More specifically, the issues addressed in the present investigation can be divided into four primary aims:
(i) To examine the linkages between Māori ethnicity and rates of mental disorder during adolescence (ages 15-18 years)
(ii)To examine the extent to which any associations between Māori ethnicity and risks of mental disorders during adolescence are maintained after controlling for
childhood socio-economic disadvantage
(iii)To examine the extent to which any remaining associations between Māori ethnicity and risk of mental disorders during adolescence are maintained after controlling for childhood adversity
(iv)To examine the extent to which any remaining associations between Māori ethnicity and risks of disorder during adolescence are maintained after controlling for deviant peer affiliation during adolescence
These aims required four stages of analysis and exploration:
i) Prevalence rates of mental disorder amongst Māori during adolescence (ages 15-18) were compared to those of non-Māori. It was hypothesised that Māori adolescents would have higher prevalence rates of mental disorder than their non-Māori counterparts.
27 background. It was hypothesised that this would further reduce the magnitude of the ethnic differences in prevalence rate of mental disorder during adolescence.
iii) The exposure of Māori to childhood adversity was then compared to that of non-Māori. It was hypothesised that Māori would have experienced more childhood adversity than non-Māori. The results from stage two were then adjusted to control for childhood adversity. It was hypothesised that this would further reduce the magnitude of the ethnic differences in prevalence rate of mental disorder during adolescence.
iv) The level of affiliation with deviant peers amongst Māori was then compared to that of non-Māori. It was hypothesised that Māori would have greater affiliation with deviant peers than non-Māori. The results from stage three were then adjusted to control for deviant peer affiliation. It was hypothesised that this would further reduce the magnitude of the ethnic differences in prevalence rate of mental disorder during adolescence.
Overall these analyses aimed to identify whether ethnic differences in adolescent mental health rates may be partially or fully explained by ethnic differences in exposure to known risk factors for maladjustment and psychopathology during adolescence (including
28
2. Methods:
2.1 Data Source:The Christchurch Health and Development Study (CHDS) is a prospective longitudinal study of a birth cohort of 1,265 Christchurch (NZ) born children who have been studied from birth to age 25 years. The sample for this study was recruited over a 4-month period during 1977 by contacting mothers of all live-born children giving birth in public and private maternity hospitals within the Christchurch urban region. Of the 1,310 mothers giving birth during this time, 97% agreed to participate.
These children and their families have now been studied at birth, 4 months, 1 year, at annual intervals to age 16, and again at ages 18, 21 and 25 years. The study has collected a wide range of data on the health, development, and adjustment of the cohort throughout this period. The CHDS has been approved by the Canterbury (New Zealand) Regional Ethics Committee, and all aspects of the data collection have been subject to the informed consent of the participants.
2.2 Characteristics of the Sample
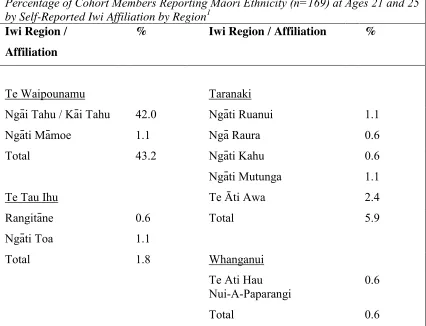
29 Although there was insufficient data to describe the tribal affiliation (iwi) of the Māori cohort at age 14, at ages 21 and 25, cohort members who self-identified their ethnicity as either Māori or as Māori / other were asked to identify their iwi (tribal affiliation). The iwi
[image:35.595.67.493.437.763.2]affiliation of Māori cohort members at ages 21 and 25 are shown in Table 7 below and can be used as a loose estimate of the iwi affiliation of the Māori members of this cohort. The iwi described in the table are organised into a number of iwi regions using the classification from Statistics New Zealand (Statistics New Zealand, 2000). This classifies NZ into 11 iwi regions representing broad groupings of affiliated iwi. Table 7 shows the percentages of the sample (n=169) reporting each iwi. Note that percentages in the table sum to more than 100% since some respondents reported more than one iwi affiliation, with 57.3% reporting one iwi affiliation, 14.2% reporting two iwi affiliations and 2.3% reporting three iwi affiliations by age 25. As might be expected, the largest iwi grouping was from Te Waipounamu, with 42% of the sample reporting an affiliation with Ngāi Tahu/ Kāi Tahu. Sample members also reported affiliations with a broad range of North Island Iwi, with the most frequent of these being Ngā Puhi (11.8%) and Te Arawa (6.5%)
Table 7:
Percentage of Cohort Members Reporting Māori Ethnicity (n=169) at Ages 21 and 25 by Self-Reported Iwi Affiliation by Region1
Iwi Region /
Affiliation
% Iwi Region / Affiliation %
Te Waipounamu
Taranaki
Ngāi Tahu / Kāi Tahu 42.0 Ngāti Ruanui 1.1
Ngāti Māmoe 1.1 Ngā Raura 0.6
Total 43.2 Ngāti Kahu 0.6
Ngāti Mutunga 1.1
Te Tau Ihu Te Āti Awa 2.4
Rangitāne 0.6 Total 5.9
Ngāti Toa 1.1
Total 1.8 Whanganui
Te Ati Hau
Nui-A-Paparangi
0.6
30
Percentage of Cohort Members Reporting Māori Ethnicity (n=169) at Ages 21 and 25 by Self-Reported Iwi Affiliation by Region1
Iwi Region /
Affiliation
% Iwi Region / Affiliation %
Takitimu
Ngāti Kahungunu 4.1
Waikato Total 4.1
Ngāti Paoa 0.6
Ngāti Maniapoto 2.4 Mataatua
Tainui 3.6 Ngāti Awa 1.1
Ngāti Hauā 1.8 Ngāi Tūhoe 0.6
Ngāti Raukawa 1.1 Te Whakatōhea 0.6
Total 8.9 Total 2.3
Rangitikei Tairawhiti
Ngāti Hauiti 0.6 Ngāti Porou 4.7
Total 0.6 Ngāti Tāmanuhiri 0.6
Total 5.3
Arawa
Te Arawa 6.5 Tai Tokerau
Ngāti Tūwharetoa 4.1 Te Aupouri 0.6
Ngāti Whakaue 0.6 Ngā Puhi 11.8
Ngāti Pikiao 1.1 Te Rarawa 0.6
Tūhourangi 0.6 Total 14.2
Ngāti Rangiwewehi 0.6
Total 13.0 No Iwi Affiliation Stated 26.0
31 At the time that the ethnicity data used in this study was gathered (when participants were age 14), the sample for which ethnicity data was available consisted of 995 participants. This sample represented 78.7% of the original cohort and 87.9% of the cohort still alive and resident in New Zealand. Table 8 divides the 270 participants lost to follow-up by the age of 14 years into reasons for non-participation.
Table 8:
Reasons for Losses to Follow-up at Age 14
Reason Number Percentage of
Losses
(i) Subject No Longer in NZ 136 50.4
(ii) Refusal to Participate 117 43.3
(iii) Died by Age 14 17 6.3
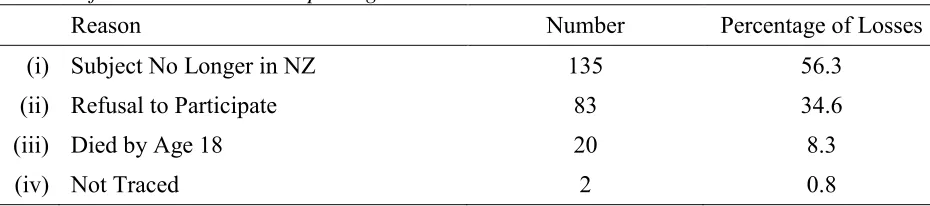
32 Table 9:
Reasons for Losses to Follow-up at Age 18
Reason Number Percentage of Losses
(i) Subject No Longer in NZ 135 56.3
(ii) Refusal to Participate 83 34.6
(iii) Died by Age 18 20 8.3
(iv) Not Traced 2 0.8
A number of analyses have been conducted to examine the impact of selective sample attrition on design validity and to investigate the degree to which sample losses were non-random (Fergusson, Horwood, & Lloyd, 1991). These studies have indicated that there are small detectable tendencies for those lost to follow-up to come from a socially disadvantaged background characterised by single parenthood, limited maternal education, and low-socio-economic status. However, non-random sample losses have been taken into account through statistical corrections that have consistently shown the effects of selective sample attrition on the validity and conclusions of the study is negligible (Fergusson, 2001).
2.3 Procedure:
Data collection in the CHDS has been collected from several sources and is based on a multiple informant model. The main sources of data comprise of:
Parental interviews. These were conducted with the child's mother, or in cases of
single-parent families with a male single-parent, the child's father, at the child's home. The duration of interviews was generally one to two hours, with topics consisting of a range of issues pertinent to the child's stage of development.
Teacher reports. From the age of 6 to 12 years, teacher reports on child social adjustment
and academic achievement were acquired by providing all class teachers of CHDS children with a set of standardised questionnaires. Compliance was high with completed questionnaires being available for 98% of children in any given year.