M 0 M
E
N TR E D I S T R I B U T I 0 N
I N
P
R E
S TR E
S SE
D C 0 N CR E
TE
CONTINUOUS
BEAMS
A thesis presented for the
degree of Ph.D. in Civil Engineering
in the University of Canter'bu.ry1 Christchurch, New Zealand1
by
A B S T R A C T
This thesis is concerned with the redistribution properties of continuous prestressed concrete structuresr in particular, symmetrical two=span prismatic beams symmetrically loaded with one point load
per span.
The behaviour of these beams is studied both theoretically and experimentally up to the stage of first crushing of the concrete. A compatibility approach is used to predict the theoretical moment~load
and load-deflection behaviour, and very good agreement between theoretical curves and the experimental values was found.
The utilization of a compatibility approach was made possible by the formulation of accurate moment~curvature relationships for pre-stressed concrete sections. A theory is advanced that considers variations of curvature between cracks caused by concrete tension.
The experimental studies also included tests on single span pre= stressed concrete beams in order to compare the experimental and
i i i
A C K N 0 W L E D
GM E N T S
Grateful acknowledgment is made to the following~
Professor H.J. Hopkins9 Head of the Civil Engineering Department9
under whose overall guidance this study was madeo
Dr. R. Park and Mr. F.P.S. Lu9 supervisors for this study9 for
their interest9 guidance and assistance.
The Technica~-Staff --- -- ----,..,, of the Civil Engineering Department9 including
Mr. H.T. Watson9 )pr their assistance in the experimental programme.
The staff of the Mobil Computer Laboratory9 for punching cards.
The typists9 Hrs. V. Perfect9 Mrs. P. Gosney9 and Miss E. Philpot')
and to the following for financial aid~
The New Zealand Portland Cement Association. The Ministry of Works.
CONTENTS
Page
1 ,. INTRODUCTION AND SCOPE OF RESEARCH 1
1=1 Introduction. 1
1=2 Redistribution Theories. 2
1=3 Previous experimental work in the field. 6
1=4 Scope of investigation.
7
1=5 Computer facilities.
9
2o APPROXIMATE ANALYSIS OF TWO=SPAN PRESTRESSED CONCRETE BEAMS
UTILIZING GUYON'S MOMENT-CURVATURE RELATIONSHIP 10
Summary 10
2=1 Guyon's moment=curvature relationshipo 10
2=2 Compatibility equation. 12
2=3 Generalised two-span case. 14
2=3-1 Failure modes. 16
2=3=2 Lengths of plastic hinges. 18
2-3=3 Compatibility equation in terms of average curvatures. 19
2-3=4 Average curvature ratioso 21
2=4 Computer programmes. 22
2=5 Computer results. 23
2=6 Discussion of computer results. 24
3o MOMENT-CURVATURE RELATIONSHIPS FOR PRESTRESSED CONCRETE SECTIONS
Summary
3=1 Initial conditions.
3=2
Stress-strain relationships.3=3
Stress conditions just prior to cracking.3=4
Stress conditions just after formation of cracks.3=4=1
Conditions at a crack.3=4=2
Bond length and crack spacing.3=4=3
Stress distribution at a distance 1 from a crack.3=5
Average curvature at moment M.3=6
Solution of the basic equations.3=6=1
Steel stress~strain curve.3=6=2
Concrete stress-strain curve.3=6=3
Variation of bond stress between cracks. 3=6~4 Concrete tension distribution.3=6=5
Conditions just prior to cracking. equations3=3
and3=4.
Solution of
v
29
31
31
33
35
37
37 38 38 4244
3=6=6
Conditions at a crack. Solution of equations3=5
and3-6.
46
3=6=7
Conditions between cracks. Solution of equations 3=9~ and3-10.
3=7
Removal of section shape as a variable.3=8
Sequence of calculations.3=9
Computer programme.4
CRACK SPACING Summaryh -•=)
5o MOMENT REDISTRIBUTION IN TWO-SPAN PRESTRESSED CONCRETE
BEAMS SYMMETRICALLY LOADED WITH ONE POINT LOAD PER SPAN 65
Summary 65
5=1 Generalised compatibility equation. 5=2 Assumptions.
5=3 Ultimate load.
5=4 Moment-load relationships. 5=5 Deflection.
5=6 Corrections to moment-curvature curves for non= concordancy of cable.
5=7 Computer programme for redistribution~ deflection~
and moment-load relationships. 5=8 Method of analysis.
6. TESTS ON SINGLE-SPAN AND TWO-SPAN BEAMS 6=1 General.
65 68
69
7'1
72
73
75 77
80 80
6=1=1 Prestressing system. 80
6=1=2 MK series beams. 82
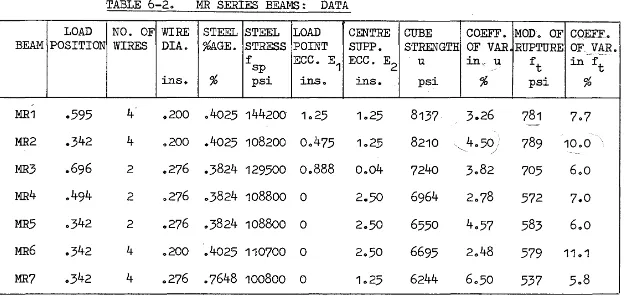
6=1=3 MR series beams. 85
6=1=4 Curing9 materials9 equipment9 and testing procedure. 87
6=1=5 Definition of failure. 87
6=2 MK series results.
88
6=2=1 Failure. 88
6-2=2 Curvature. 92
6=2=3 Moment=curvature curves. 101
6=2=5
Special cases.6=2=6
Maximum compressive strain.6=2=7
Photographs of beams tested in this series.6=2=8
Conclusions.6=3
MR series results.6=3=1
Crushing and failure.6=3=2
Distribution of curvature along the beams.6=3=3
Deflection profiles.6=3=4
Comparison between theory and experiment.6=3=5
Photographs of beams tested in this series.6=3=6
Conclusions.7.
CONCLUSIONS7=1
Theory.7=2
Comparison of theory with experiment.8.
REFERENCESAPPENDIX A. COMPUTER PROGRAMMES~ SOURCE PROGRAMMES AND BLOCK DIAGRAMS.
Symbols used in Source Programmes. Programme 1o
Programme 2. Programme 3~ Programme
4.
Programme5.
Programme
6.
APPENDIX B. MATERIALS, EQUIPMENT AND TESTING PROCEDURE. 1 0 Materials
1-1 Concrete 1-2 Steel
2. Equipment for beam manufacture. 2-1 Stressing load cells.
2-2 MK series beam mould. 2-3 MR series beam mould.
3. Testing equipment and procedure. 3-1 Stress transfer.
3-2 MK series beams - measurements. 3-3 MR series beams - measurements.
APPENDIX C. General Beam MK3 Beam MK4 Beam MK5A Beam MK5B Beam MK6 Beam MK7 Beam MK8 Beam MR1 Beam MR2 Beam MR3 Beam MR4
TABULATED BEAM RESULTS.
APPENDIX C (Continued)
Beam MR5
Beam MR6
Beam MR7
ix
c44
C49
L I S T
OF FIGURES Figure2-1 Moment~curvature curve according to Guyon. 2-2 Idealized Deflection Profile.
2-3
Depth of Compression vs M/Z2-4 Moment Configurations at Failure.
Page 11 12
15
182-5
2-63-1
Variation of Moment M' over Hinge. 21
Efficiency against Load Point k and Section Strength Ratio X 26 Concrete Strains at Initial Conditions.
3-2
Conditions Prior to Cracking.3-3
Conditions Distance1
From a Crack.3-4
Concrete Stress-Strai~ Curve.3-5
Bond Stress Distribution between Adjacent Cracks. 4-1 Crack Spacing. fs varies4-2 Crack Spacing. As/bd varies.
4-3
Crack Spacing. fc' varies.4-4
Crack Spacing. fc' varies.4-5
Crack Spacing. fc9 varies.4-6
Crack Spacing. ft varies.5-1
Rotation of a Beam between Two Supports.5=2
Rotation of a Beam at Internal Support j.5=3
Beam Split up into Segments.5-4
Deflection Profile of Beam.5=5
Secondary Moments.5=6
Segment Positions for Computer Analysis. 6-1 Pretension Bed with MR Series Mould.xi 6=2 Effect of Testing Duration on Shape of Concrete
Stress-Strain Curve" 89
6=3 MK3. Curvature Distribution Along Constant Moment Zone. 93 6=4 MK4. Curvature Distribution Along Constant Moment Zone. 94 6-5 MK5A. Curvature Distribution Along Constant Moment Zone. 95 6-6 MK5B. Curvature Distribution Along Constant Moment Zone. 96 6=7 MK6" Curvature Distribution Along Constant Moment Zone. 97
6~8 MK7. Curvature Distribution Along Constant Moment Zone" 98 6-9 MK8" Curvature Distribution Along Constant Moment Zone. 99
6='10 MK3. Moment-Curvature Relationships. 102
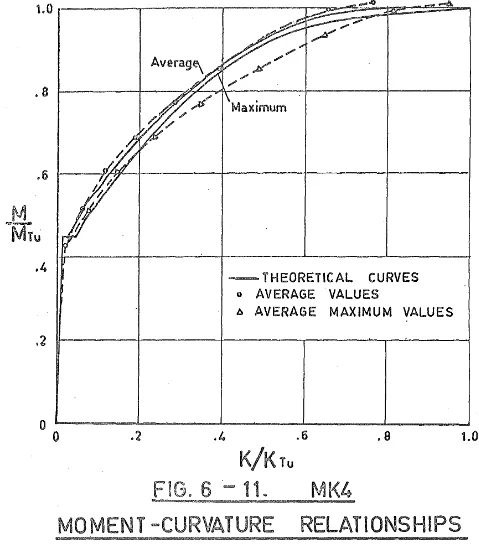
6-11 MK4. Moment=Curv~ture Relationships. 103
6-12 MK5A. Moment-Curvature Relationships. 104
6-13 MK5B. Moment-Curvature Relationships. fc'=5540 psi. 105 6-14 MK5B. Moment=Curvature Relationships. fc1=664o psi. 106
6=15 MK6. Moment-Curvature Relationships. 107
6-16 MK7. Moment-Curvature Relationships. 108
6-17 MK8. Moment-Curvature Relationships. 109
6-18 Vertical Stresses Between Adjacent Cracks. 113
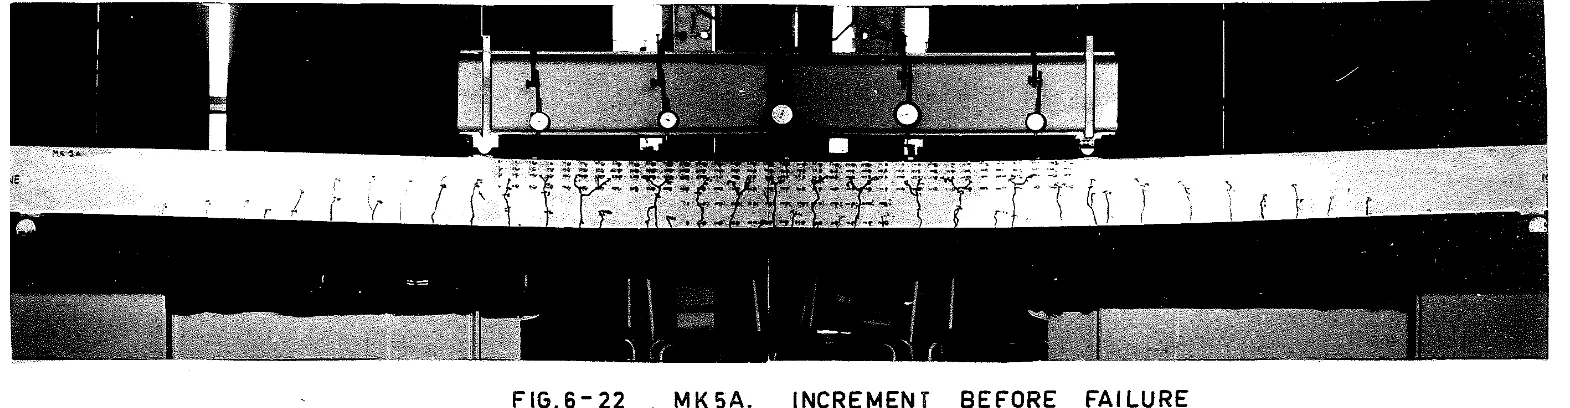
6=19 Typical Distribution of Strains Midway between Cracks. 115 6-20 MK3. Increment before Failure.
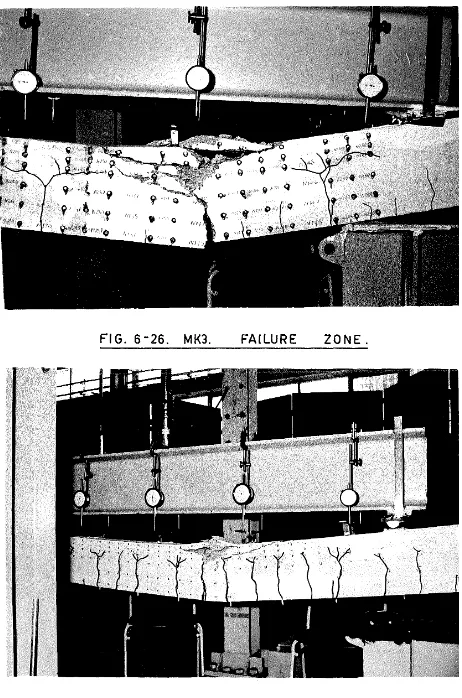
6-21 MK4. Increment before Failure. 6-22 MK5A. Increment before Failure. 6=23 MK5B. Increment before Failure" 6-24 MK7" Increment before Failure. 6-25 MK8. Increment before Failure. 6=26 MK3. Failure Zone.
6-27
MK5B~Failure Zone
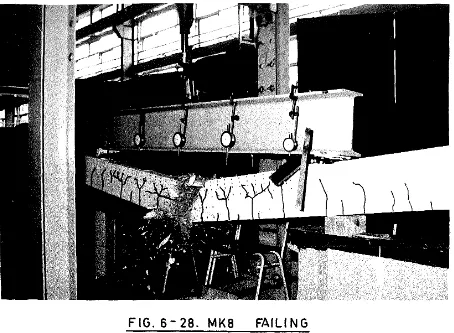
6-28 MK8,
Failing.
6-29 MK8,
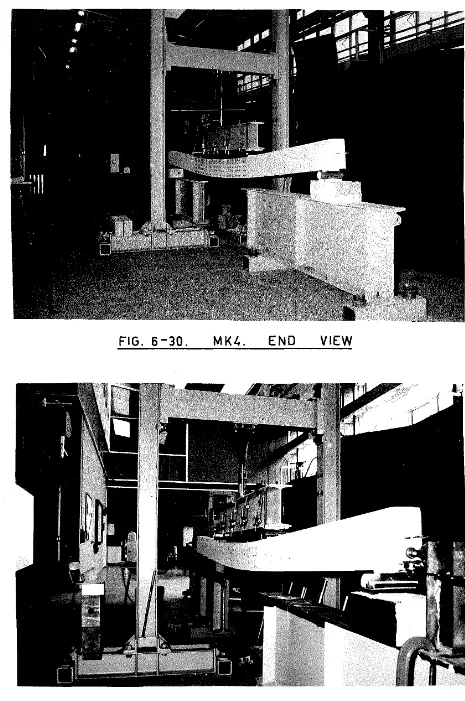
6-30 MK4,
6-31 MK8,
6-32 MR4,
6-33 MR5,
6-34 MR1,
6-35 MR2.
6=36 MR3.
6-37 MR4.
6=38 MR5.
6-39 MR6.
6-40 MR7.
6-41 MR1.
6-42 MR2.
6=43 MR3.
6-44 MR4.
6-45 MR5.
6-46 MR6.
6-47 MR7.
6-48 MR1.
6-49 MR2.
6-50 MR3.
6-51 MR4.
6-52 MR5.
Failure Zone.
End View. End View.
Effect of Loading Pad.
Eff.ect of Loading Pad.
Curvature Distribution.
Curvature Distribution.
Curvature Distribution.
Curvature Distribution.
Curvature Distribution.
Curvature Distribution.
Curvature Distribution.
Deflection Profile.
Deflection Profile.
Deflection Profile.
Deflection Profile.
Deflection Profile.
Deflection Profile.
Deflection Profile.
Moment-Load Curves.
Moment=Load Curves.
Moment-Load Curves.
Moment-Load Curves.
Moment-Load Curves.
6=53 MR6.
6~54 MR7. 6=55 MR1. 6=56 MR2. 6=57 MR3. 6-58 MR4.
6~59 MR5.
6=60 MR6.
6~61 MR7. 6-62 MR1. 6-63 MR2. 6=64 MR3. 6=65 MR4. 6=66 MR5. 6-67 MR6. 6-68 MR7. 6-69 MR3. 6=70 MR4. 6-71 MR5. 6-72 MR6. 6=73 MR7. 6=74 MR6.
Moment-Load Curves. Moment-Load Curves.
Load=Deflection Curves for Load Points. Load=Deflection Curves for Load Points. Load=Deflection Curves for Load Points. Load-Deflection Curves for Load Points. Load-Deflection Curves for Load Points. Load-Deflection Curves for Load Points. Load=Deflection Curves for Load Points. Increment before Failure.
Increment before Failure. Increment before Failure. Increment before Failure. Increment before Failure. Increment before Failure. Increment before Failure. Centre Support.
West Load Point.
Centre Support after Failure at East Load Point. East Load Point.
East Load Point.
Branching of Cracks at East Load Point. Two increments before Failure.
6=75 MR4. View along Beam. 6=76 MR6. View along Beam.
B=1 Steel Stress-Strain Curves.
B-2 Stirrups.
B-3 5-Ton Stressing Cell.
B-4 Assembled Cells in Position. B-5 Harping Frame for MK Beams. B-6 Harping Frame for MR Beams.
B-7 Horizontal Adjustment. MK Beams. B=8 End Support. MR Beams.
B-9 Test Set=up for Single-Span Beams. B-10 Test Set-up for Two~Span Beams.
B5 B7 B8 B11 B11 B17 B17 B24 B25 C=1 MK3.
C-2 MK3. C-3 MK4.
Position of Eight-Inch Gauge Lengths and Dial Gauges. C3
Position of Two-Inch Gauge Lengths. C3
Position of Eight-Inch Gauge Lengths and Dial Gauges. C6
C-4 MK4. Position of Two-Inch Gauge Lengths. C6
C=5 MK5A. Position of Two-Inch Gauge Lengths and Dial Gauges. 89 C-6 MK5B. Position of Two-Inch Gauge Lengths and Dial Gauges. C·12 C-7 MK6. Position of Two-Inch Gauge Lengths and Dial Gauges. C15 C=8 MK7. Position of Two-Inch Gauge Lengths and Dial Gauges •. C18 C=9 MK8. Position of Two-Inch Gauge Lengths and Dial Gauges. C21
C-10~ C=11. MR1. Position of Gauge Lengths and Dial Gauges. C24
L I S T 0 F T A B L E S
MK Series Beams
6=2
MR Series Beamsg Data6=3
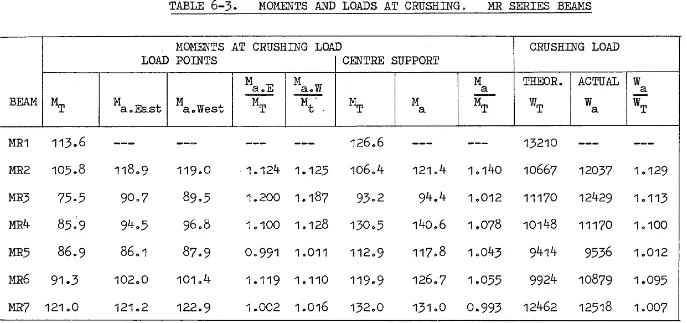
Moments and Loads at Crushing. MR Series Beams.6-4
Moments and Loads at Failure. MR Series Beams.XV
a
As
An
bBn
c
cD
d e e c e cq' e p esi
e
s
eel
I N D E X
0 FN 0 T A T I 0 N •
ratio between average curvatures at support and load sections; length of first major segment in two-span beam analysis.
total steel cross-sectional area. characteristic steel stress.
total rotation of load hinge.
ratio between average curvatures at load and support sections; section width; length of second major segment in two-span analysis.
slope of line joining points n and n+1 on steel stress-strain curve.
half rotation of support hinge. concrete compressive force.
length of third major segment in two-span beam analysis. diameter of prestressing wire.
positions for calculation of deflection in two-span beam analysis.
effective depth of section. concrete compressive strain.
concrete compressive strain at extreme compressed fibre. value of e distance q, or 1, from a crack.
c
initial steel strain after transfer.
increase in steel strain from e to bring concrete p
strain at level of steel to zero. steel strain above e +e .•
xvii
e
sc value of e just before cracking. s
e sq' esl value of e distance q, or 1, from a crack. s
et concrete tensile strain at modulus of rupture. e1 eccentricity of prestressing tendon at load point. e2 eccentricity of prestressing tendon at centre support.
e,,E2 , €3 characteristic concrete strains.
Eo concrete strain at maximum stress.
E:ll concrete strain at crushing.
1n
steel strain corresponding to An.f concrete stress.
c
fc1 cylinder strength of concrete.
f steel stress.
s
fsA steel stress at crack just after formation of crack. f .
sB steel stress just prior to cracking. f
sp steel stress corresponding to e p •
ft modulus of rupture of concrete.
r¢
total surface area of prestressing steel per unit length.g average crack spacing.
K curvature.
Kult curvature at failure.
K actual curvature.
a
KT theoretical curvature.
KTult theoretical ultimate curvature.
K reduced curvature relative to ultimate.
r
Ko<
K(}
L lB lo< 1~ M Ma Mer Ml Mr Ms MT MTult Mult p QCQs
R rs
s T t TCTS
depth from extreme fibre to neutral axis. average curvature over 1« •
average curvature over 1~
span length. bond length.
length of load section plastic hinge. length of support section plastic hinge. moment.
actual moment. cracking moment. load point moment.
reduced moment relative to ultimate. centre support moment.
theoretical moment.
theoretical ultimate moment. ultimate moment.
steel area as a percentage of the effective section area(bd concrete stress-strain function.
steel stress-strain function.
ratio of effective depth of steel to section depth. radius of curvature.
support section.
fraction of ultimate moment reached at load section at failure.
bond stress.
Tm
Ts
Tu
e.
1w
w
Wu
X
X
y-x
z
xix
maximum bond stress. average bond stress.
ultimate tensile stress in the wires. rotation of beam at support i.
load section.
fraction of ultimate moment reached at load section at failure.
actual ultimate load.
ratio between load section and support section ultimate moments.
length variable.
deflection of beam distance x from the free end.
CHAPTER ONE
INTRODUCTION AND SCOPE OF RESEARCH
1=1
INTRODUCTION
Redistribution of moments in statically indeterminate structures resisting high loads occurs because of the inelastic behaviour of materials at high stresseso This is especially true of materials like steel that exhibit a plastic range in which strain increases virtually independently of stresso To a lesser extent it is also true of concrete~ which is never either fully elastic or fully plastic! the deviation from elastic behaviour being small at low stresses and large at high stresseso
Plastic theory for both steel and concrete continuous structures relies on this redistribution of moments to allow the development of the ultimate moment capacity in the structure at a number of critical sections; the number being sufficient to cause the structure to
become an unstable mechanism~ resulting in failureo
Although this theory is well established for steel structures9
there is room for doubt about its general applicability to continuous concrete structures9 especially those reinforced with prestressing
steelo The reason for this doubt lies in the comparatively low ultimate compressive strain of the concrete~ and in the shape of the moment-curvature curve9 which, for prestressed concrete9 may be far
to form a mechanism reach their ultimate moment capacityQ When this happens, the load factor is less than that calculated by the plastic theory.
Experime~tal studies performed in the latter part of the 1950's to investigate this behaviour produced contradictory results. In. some beams, as in those tested by Morice and Lewis (1)* and Guyon (2) 1 redistribution was found to be complete, while in other beams, including t.hose tested. by Lin (3) 1 and Macchi ( 4), the distribution of moments at failure was apparently far from fully plastic.
This led to the formulation in the late 1950's of various theories attempting to explain the different redistributiGm properties of
different types of prestressed concrete structures. The three most important theories, although being similar in basis, differ in the method of application, and in the approximation made.
1-2 REDISTRIBUTION THEORIES
(a)
GUYON'S METHOD
In addition to satisfying the normal statical requirements of a structure, a compatibility condition must be satisfied. The
compatibility requirement for a continuous beam is, in effect, that under any value of loading less than that required to cause failure, the resulting ~eflections perpendicular to the axis of the beam and in the plane of loading must be zero at the supports. From this condition, certain geometrical relationships between the rotations at adjacent hinges can be estabUshed. These relationships must be
Consequently, if the moment-c~rvature behaviour of all sections of the beam is known, then for an assumed moment configuration, the deflected shape can be found. If the deflection at all the supports is not zero, then compatibility is not satisfied, and the assumed moment configuration is impossible.
Guyon (2), uses this requirement to predict the moments at failure at the critical sections of several prestressed concrete beams. 1rhe practical difficulties involved in establishing the
moment-curvature relationship for all sections of the beams is
avoided by neglecting elastic curvatures as being small in relation to the plastic curvatures, and by assuming a constant shape for the moment-curvature curve when the ultimate moment and ultimate
curvature are adopted as units.
(b) MACCHI'S METHOD
Macchi,
(4),
suggested a method for calculating theredistribution of moments in a structure at any load above that required to cause cracking.
First, the positions of the plastic hinges is assumed to be known. The moments induced in the structure by a unit rotation at each of the hinges is calculated by the theory of coactions. An
equation is then obtained, for simple structures, giving the sum
To use the theory, a moment configuration is assumed. The inelastic rotation at each hinge is found from a moment-curvature curve calculated for the critical sections, and approximated by three straight lines. Substituting these rotations in the compatibility requirement mentioned above gives the difference between the elastic and actual moments. If this is not the same as the difference between the elastic and assumed moments, then the assumed moment configuration is wrong, and a new moment configuration is chosen. Successive
adjustments will eventually yield the correct moment configuration.
This method assumes that the displacements of the beam can be represented with sufficient accuracy by elastic portions connected by hinges at which the inelastic rotations act. The absolute value of the flexural rigidity is required in the calculation of the moments induced by inelastic rotations at the hinges.
(c)
BAKER'S METHOD
Prof. A.L.L. Baker
(5),
developed a design method for checking the redistribution capabilities of continuous structures. The method is a general one, applicable to both conventionally reinforced and prestressed structures.A structure that is n times statically indeterminate is made
the assumed configuration of hinges is correct. If this con~ition
is not satisfied, either the choice of hinge positions, or the values for ultimate moment assumed must be changed, and the rotations
recalculated.
The rotations, as found above, of the n plastic hinges then have to be checked to ensure that they are not too large for the physical conditions of each hinge. In Baker's initial work, a safe allowable rotation equal to a curvature of ec acting over a hinge length equal
nd
to the effective depth d was assumed, where e was a safe limit!ing
c
strain and nd was the neutral axis depth at failure.
With further research, the restriction on the allowable hinge
length of making it equal to the effective depth was found to be unduly conservative, and in later publications
(6)
9 an expression for thehinge length was proposed in which the effects of concrete strength, type of steel, presence of axial load, and distance from the critical section to the point of contraflexure were taken into account. With different values of these variables, the equivalent length of the pla~t
hinge could vary from o.4d to 2.4d on each side of the critical section
(d) DISCUSSION OF THE METHODS
Baker's method is, at best, an approximate method for d~~igning
continuous structures for ultimate load conditions. In general
The absolute value of the flexural rigidity must be known for the
analysis. Tests so far performed have not indicated that the equation, presented for the calculation of this variable-are particularly accurat Deflections calculated by the method could be expected to be greatly in error, and not always on the safe side. The method cannot be used wit any degree of accuracy at loads less than ultimate.
Although the approximations made are drastic~ they are possibly of sufficient accuracy for a simplified design method.
Macchi's method, though capable of predicting behaviour at loads less than ultimate load, relies on an accurate determination of the flexural rigidity of the beam~ and on the assumption that this is constant throughout the beam. Also, approximations about the distribution of rotation at the hinges must be made before the compatibility requirements are set up.
Although Guyon makes several approximations in applying a pure compatibility approach to his analysis, the basic method is the most general, and makes the fewest approximations of the three methods discussed here. Because of these points, a compatibility approach was used in this study, and an attempt was made to make as few
simplifying assumptions as possible.
1-3 PREVIOUS EXPERIMENTAL WORK IN THE FIELD
Experimental studies o~ the redistribution properties of continuou prestressed concrete structures have been carried out by Morice and Lewis (1) 9 laGrange
(7)
9 Lin (3)~ Macchi(4),
Hawkins(8),
Guyon (2) 9failure, and surprisingly little interest has been shown in the region between cracking and failure.
Comments on the experimental work referred to above will not be included here as two of the references,
(7)
and(8)
include excellent summaries on this topic. However, comparisons with previous work will be made in the section discussing the results of the present investigation.1-4 SCOPE OF INVESTIGATION
The main aim of this study is to investigate the behaviour between cracking and failure of prestressed concrete beams. The scope covered can conveniently be divided into five major sections.
(a) PRELIMINARY INVESTIGATION
Guyon's theory (2) is accepted together with most of his approximations. This is used as the basis for a preliminary investigation into the redistribution characteristics of a large number of symmetrical two-span beams, with different loading positions and different section strengths.
(b) THEORETICAL MOMENT=CURVATURE CURVES
8.
are long and unwieldly~ the problem is coded for computer analysis.
(c)
THEORETICAL BEHAVIOUR OF TWO-SPAN BEAMS
An attempt is made to apply the moment-curvature curves developed in (b) to the analysis of symmetrical two span prestressed concrete
'
beams sy'mmetrically loaded with one point load per span. A
compatibility approach is used9 and the moments at any load are found
by a trial and error processo The method developed provides a means of calculating moment-load9 and load~deflection behaviour up to first
crushing in the beams.
Again the equations involved are complex9 and an attempt is made
to express the conditions in a manner suitable for computer solution.
(d) EXPERIMENTAL MOMEN'r=CURVATURE CURVES
An experimental study of moment=curvature relationships is reported. The object of this section of the study is to compare actual moment-curvature relationships with the theoretical
relationships developed in (b) above. To this end9 tests are
reported of seven single span beams tested in this study.
(e)
EXPERIMENTAL BEHAVIOUR OF TWO-SPAN BEAMS
An attempt at experimental verification of the theory developed in (c) above is reported. Although the method of analysis is
general9 it is specifically developed for two-span beams9 and the
The theoretical investigations described in Sections (a), (b), and (c) above all require computer analyses. These were carried out on the University of Canterbury's IBM 1620 Electronic Digital Computer which had a 40K storageo This is a relatively slow
computer by present standards, and some of the analyses took several hours to complete.
10.
CHAPTER TWO
APPROXIMATE ANALYSIS OF TWO-SPAN PRESTRESSED CONCRETE BEAMS UTILIZING
GUYON'S MOMENT-CURVATURE RELATIONSHIP
SUMMARY
Guyon's compatibility approach is utilized as a preliminary investigation to find the effect of certain variables on the moment redistribution in two span prestressed concrete beams symmetrically loaded with one point load on each span. The beam is assumed to be a pretensioned beam with harped tendons giving a linear variation of eccentricity between the supports and load points. The
eccentricity at the end of the beam is assumed to be zero.
2-1. GUYON'S MOMENT-CURVATURE RELATIONSHIP
In his treatise on prestressed concrete, (2), Guyon develops a generalised moment-curvature relationship for prestressed concrete sections. His method of analysis is to assume a simplified elasto-plastic stress-strain curve for the concrete, and to choose three critical values of the concrete compressive strain. Points on the moment-curvature curve corresponding to when these strains develop in the extreme compressed fibre are then calculated.
of strain used are:
"failure" strain E'
1
strain at maximum stress t::
2
The values
and several researchers, for example
(7)
~nd (11) have noted that asection does not normally fail at first crushing. However, this invest-igation does not consider any behaviour after first crushing has occurred.
E
2 is assumed to be • 002, a~d there fore
e-
3 = • 001 oA number of moment-curvature curves for different sections were calculated, and are tabulated in his treatise
(2).
The main variable used wasw ...
As.Tubd. fc 1
where Tu is the ultimate tensile stress in the wires, As is the area of steel, b is the section width, d is the effective depth of the steel, and fc1 is the cylinder strength.
The range of w used was .1 ~ w~
4.
Guyon found that for the region • 2 ~ w ~ 1. 2 9 "the shape of the
moment-curvature diagram is approximately constant if the ultimate
•
moment and the ultimate curvature are adopted as units11 •
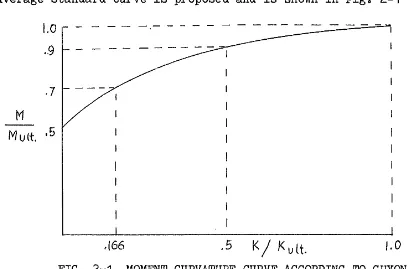
An average standard c~rve is proposed and is shovm in Fig. 2-1
M
1.0
-.. 9Mutt. ·5
.166
-. 5
KI
J< u lt . 1.0 [image:30.595.111.520.518.787.2]12. This curve can be represented by the polynomial
where Kr
=
K and Mr=
M and is assumed to hold for allKult Mult
beams of normal dimensions. For values of w >1.2, Guyon recommends that the curve be recalculated for the individual case.
The curve shown in Fig. 2-1'is assumed in this preliminary invest-igation to be the correct moment~curvature curve for all sections.
2-2 COMPA~LITY EQUATION
To establish the compatibility equation for a two span beam at ultimate load, the approximation is made that the centres of rotation of the plastic l:J.inges are at the load points and the centre support as in Fig. 2~2.
L-~
A
c
D
FIG. 2~2 IDEALIZED DEFLECTION PROFILE
This assumption has been made by other researchers in the field, for example, (2), (4), and (10), and is discussed in greater detail in Chapter
5.
curvatures.
From geometrical consideration in Fig. 2-2,
AD
=
o<.kL = ~ L'
a.-~ L \ - kcX o o o o o o o o o 2-1
Equation 2=1, which gives the ratio between the rotations of the load hinge and the support hinge, is the compatibility equation for a two span beam subjected to symmetrical point loads.
The magnitudes of o< and ~ can be found if the relationship between moment and curvature is known for all sections of the beam. By integrating the curvature over the length of a hinge, the rotation of the hinge may be found. Thus, if a certain moment yonfiguration at failure is assumed, with one or more sections reaching ultimate moment, and with either partial or complete redistribution of moments, then a knowledge of the complete moment-curvature relationships for all sections of the beam will enable a check to be made as to whether or not compatibility is satisfied.
14.
distribution of moments at failure~ to the required degree of accuracy.
2~3 GENERALISED TWO=SPAN CASE
The compatibility requirements for a two span prestressed concrete beam9 symmetrically loaded with one point load on each span will now
be put into generalised equations in a form suitable for computer analysis. The tendon profile will be assumed to be a series of
straight lines with changes of slope at the load points and supports~ and zero eccentricity at ends and points of contraflexure.
To use Guyon's moment=curvature curve9 it is necessary to know
the ultimate curvature at all sections of the beam. If the effective depth of the steel is the only variable from section to section of the beam9 and if a constant ultimate compressive strain is assumed~ then
it suffices to know how the depth from the extreme compressed fibre to the neutral axis varies with effective depth.
For a number of sections in which the only variable was the effective depth of the steel9 the ultimate moment and the depth to
the neutral axis were calculated using Hognestad1s equations (12).
A graph of the variation of depth of the compression zone against
•
the ultimate moment was plotted in an undimensional form by dividing the ultimate moments M by the ultimate moment for zero eccentricity9
Z9 and expressing the depth of compression as a fraction of the
.
~++~~~+,,~~~~-++4~~tt~~rrtt~~~rrrttt~-r~-tt~u~~~-+-~~~~~ .. i ...
16. various negative eccentricities.
To plot the graph shown in Fig. 2=3 it was necessary to assume values for the prestress and for the concrete strength. The values
chosen were: fcq
=
5000 p.s.i.~ steel percentage= .007, average prestress=
1000 p.s.i. The steel stress=strain curve used was atypical one for .27611 dia. wire with an ultimate strength of 110 t.s.i. The most important part of the graph lies between 1.0::; M/Z~ 2.0. It can be seen "that the variation of neutral axis depth between these limits is not great, and it may reasonably be assumed that the variation will be similar for other material properties than assumed above.
The curve has been approximated by three straight lines, as shown, this being considered sufficiently accurate for the purpose required.
2~3=1 FAILURE MODES
Figs. 2=4a and 2=4b show the two possible types of moment con= figuration at failure. Full moment capacity at the centre support together with less than full moment capacity at the load section is shown in Fig. 2=4a, and full moment capacity at the load section together with less than full moment capacity at the centre support
sectio~ is shown in Fig. 2=4b. In these figures~ the moments9 includ=
ing the ultimate moments of all sections9 are expressed as fractions of
the ultimate moment of the support section
s.
figures are:Other variables in the
Mult = Envelope of the ultimate moment of resistance of the sections (Assumed to be linear as a reasonable approximation for
L
kL
ApptiQd
psi
1.0Load W
J
T
~---r--...a...-~-~-iz
-L
App.
momtu'at .
(~)
FULL MOMENT CAPACITY AT
CENTRE SUPPORT
L
kL
Load
.s
M.u(~( b)
FULL MOMENT CAPACITY AT LOAD SECTION
Support -sect;on
IS
•
Beam
i
tt .
z
~ultimate moment of the sections with zero cable.eccentricity. 1o<=tx
1+1o<2
=
plastic hinge length of the load hingew.
1@
=
plastic hinge length on one side of the support section S.w, and 2, represent the fraction of full moment capacity realised at sections
W
andS
respectively, at the ultimate load of the structure.2~3=2
LENGTHS OF PLASTIC HINGES
It is to be noted that Guyon assumes that any region where the bending moment is greater than 0.5Mult is a plastic region, and that deformations between the plastic regions are negligible.
(a) s
=
1.09 w ~.1.0Consideration of the geometry of Fig. 2=4a gives the following relationships for the lengths of the plastic regions.
X(2w=1)kL
10(- ----~
1-
X(2w~·1)+Z
X2(2w=1)(1=k)L
1c(2= ---~=
x
2(2w-1)+X(1+Z)+ZX(2w-1)(X2(2w=1)+XZ+k(X+Z))L
0 0 0 0 0 0 0 0 2=-2
(1-k)L
1.(3
=
X(2w=1)+Z(1+X)+1
0 0 0 0 0 0 0 0 2~3
(b) S.<S 1.0, W
=
1.0XkL 10(1
=
X+Z
X2(1-k)L 1o<2
=
2X +X(2s+Z-1)+Z
X(X2+X(k(2s-1)+Z)+kZ)L ':to<
=
3
2 2 0 0 0 0 0 0 0 • 2 ...
4
.
'X +X (2s+2Z-1)+XZ(2s+Z)+Z (2s-1)(1-k)L
1~
=
0 0 0 0 0 0 02-5
(2s-1)+X(1+Z)+Z
2-3-3 COMPATIBILITY EQUATION IN TERMS OF AVERAGE CURVATURES
Now from equation 2=1, the compatibility equation is
~
=
ko<.By defining
&x,
and ~ as the average curvatures over the lengthst~and 1~ respectively, then o(r::. 1o< .l{o(
Substitutin~ in equation 2-1,
1f.3.K(3
=
k.1o<.Ko<(a)
s =
1.0, w ~ 1.0Kcx'
let b
=
K~
Equation 2-6 becomes
Substitute from equations
2-2
and2-3,
X(2w-1)(X2(2w-1)+XZ+k(X+Z))L.k.b
0 0 0 0 0 0 0 2.,...6
(1-k)L
=
20. Rearranging,
k2XbD(2w-1)(X+Z)+k(X2(2w-1)(X(2w-1)+Z)Db+C)-C
=
0 •••••• 2-7a wherec
D
=
X(2w-1)+Z(1+X)+1(b) s~1.0, w
=
1.0let a
=LfL
K« Equation 2-6 becomes1o<.k
=
~.aSubstituting from equations 2-4 and 2-5,
X(X2+X(k(2s=1)+Z)+kZ)L.k
x
3
+X2(2s+2Z-1)+XZ(2s+Z)+Z2 Rearranging,where
A= (2s-1)+X(1+Z)+Z
3
2 2B
=
X +X (2s+2Z=1)+XZ(2s+Z)+Z0 0 0 0 0 0 2-7b 0 0 0 0 0 0 2-7c
(2s-1)(1-k)L.a (2s-1 )+X( 1+Z)+Z
0 0 0 0 0 2-8b
0 0 0 0 0 2-8c
Equations 2-7 and 2-8 are quadratics in k. A knowledge of how the average curvature ratios a and b vary with s (or w), and Z9 makes
it possible to calculate k, the position of the load point that will cause an assumed failure moment configuration.
moments under a specific loading arrangement, but the calculation
of sufficient values of k for different assumed failure moments enables the required value to be found by interpolation.
2-3-4 AVERAGE CURVATURE RATIOS
To calculate the variation of the average curvature ratios a and b, with s (or w), and
z,
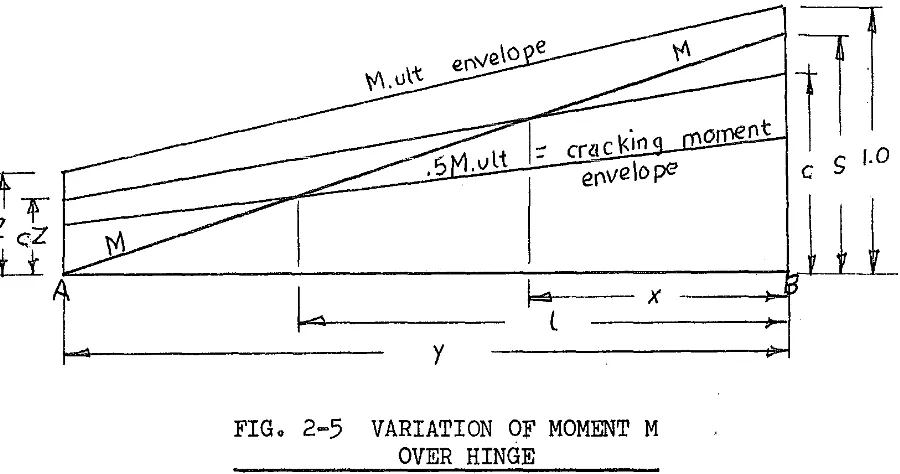
consider the variation of moment over atypical hinge as shown in Fig. 2~5
o~nt
1Tl
-=========~::~==~~::~ii~~~sc~ra~c~~~ifco~~~~~
::
eov•loP"
c
s
/.0~~---:--~1
~:=l=aa--- X ----~L
y
FIG. 2-5 VARIATION OF MOMENT M
OVER HINGE
Line M is the actual moment line, varying from a value of s at section
B,
the section of maximum moment, (that is, the load point or the centre support), to zero at sectionA,
the point of contraflexure or the end of the beam.The interaction of the two lines M and c.Mult is given by
For intersection,
M
= ::::s-sx y
c-c(1-Z) ~ y
[image:40.595.94.544.279.516.2]22
X
=
s-c(1-Z) (s-c)y••••• 2-9
The averag~ curvature over thehinge length 1 can be found by splitting the hinge length up into a number of sections of length,
~' finding the curvature at the centre of each section, and averaging. For a given value of s (or w), the procedure is
1. Put c = 1.0, and x = 0.
2. If c.:?s, reduce c incrementally until c< s.
3.
Calculate x from equation2-9,
and the increase in x from the previous value = ~x.4.
Calculate Mult/Z at the middle of the length increment.5.
From Fig.2-3,
calculate the depth of compression corres-ponding to Mult/Z, and calculate the ultimate curvature corresponding to Mult"6.
Find the actual curvature LlK, for the moment M at the middle of the length increment using Guyon's moment-curvature curve.7.
Reduce c by.05,
and recalculate steps3
to6.
8.
Repeat this process until o=
0.5
9.
The average curvature is then given byK
= avIf this process is carried out for both halves of the load hinge, and for the support hinge, the value of a or b, as required, may be calculated.
2=4 COMPUTER PROGRAMS
curvatures for a range of Z and s being calculated by Program 1, and supplied in array form as data for Program 2. Program 2 solved equations 2-7 and 2-8 for a range of Z and X with both s
=
1.0 and w varying, and w=
1.0 and s varying. For specific values of s, w,z,
and X, the average curvatures were picked out of the array in storage, and the required values of a, or b were calculated.For Program 1, the range of values used was
0.3
~z
~1.50.55~s ~ 1.0
For Program 2, the range of values used was
0.3
~z
~1.5
0.3
~X ~1.5
0. 3
~Z/X
~1 • 5
with w
=
1.0 ando.6
~ s~ 1.o
and, s
=
1.0
and0.6
~ w~1.0
Programs 1 and 2, written as source programs in Fortran without Format, and drawn up as block diagrams, are given in Appendix A.
2-5 COMPUTER RESULTS
24
redistribution of moments.
Examination of these results showed that both the efficiency and the value of the moment failing to reach full ultimate strength were very insensitive to the variable
z.
Averaging the values for a specific value of X with Z varying, enabled a graph to be drawn relating the load point position k, the efficiency, and the ratio of the ultimate section strengthsX.
Errors induced by removingZ
as a variable were always less than0.5%.
The resulting graph is shown in Fig. 2~6. As well as the
efficiency curves, isomomental curves for the support moment and the load moment have been included. Interpolation between the efficiency curves for constant
X,
and between the isomomentals, provides theefficiency and the moments at failure of any symmetrical two ,span prestressed concrete beams symmetrically loaded with one point load per span, at variable load position.
2-6
DISCUSSION OF COMPUTER RESULTSInspection of Fig.
2-6
reveals quite low efficiencies in some cases, especially whenX
and k are near the extremities of their ranges. It would seem unwise, however, to place much importance on the values fork<0.25,
andk>0.75,
as shear interaction, shear fail-ure, or bond failure would be likely to affect the results.effects are not considered in this study.
These
of 2o0 would in reality only have a load factor of 1.6o
Fig. 2~6 gives a general idea of the redistribution characteristics of most two span prestressed concrete beams, symmetrically loaded with one point load per span. However, the basic assumption made, that re-garding the shape of the moment-curvature curve, is rather questionable.
Guyon (2) comments that this theoretical curve may differ radically from conditions in an actual test beam, largely due to the discontinuity of cracking. The analysis leading up to the moment-curvature curve shown in Fig. 2-1 assumes that the stress conditions at any section in a beam are equivalent to those were the section cracked in the tension zone. Thus the beam is assumed to have no tension strength, and to have cracks at infinitely small spacing.
The effect of having cracks at finite spacing would be to allow the steel stress to be reduced by bond between the cracks, and to
cause the concrete tension to build up. The curvature between cracks would thus be less than the curvature at a crack, and therefore the average curvature would be less than the theoretical curvature used by Guyon.
----·!· ..
-I :/}·-l-;--1 ----/- ·-- -}--: --
---~---r--- ~---··--;---!-~
--!----·,i: I I /
v
Cf, 11 fl r / 1 'Sf · · o ·-
-___
_:__~ -~
- l _,! • 'I ---j,,-Y-"':_-1-- . --1---:-~
. ~·" r/;. J / I : / ; ! • ;
1 I ' I.' U
1 ~~
V ".
:
I . :f---+--_:___J_ " .. -- ! !
I
llf'4!/iJJ:'
:
- ! · I I ;•::.!
: l
----+---,J'--1----
f·:
-,! ~ ·;;
:
!
o;
.,
;
!
~;_-f---. - - . - - ~----+---:.-1-~
I
--~- ~ -'1
i ['AJ~31;) 1::1~
! ~
'
-__l_ ! .- :: -·· ••
l ••
:·I
!l ·-
I :" :.
::! '
I : !I!!; ~ .. ! ., . . . . j I .. I :· j' ... !
. I
I
I
ti ..
I. . · .]
CHAPTER THREE
MOMENT-PURVATURE RELATIONSHIPS FOR PRESTRESSED CONCRETE
SECTIONS.
SUMMARY
By considering the change in stress conditions between cracks, moment-curvature relationships for prestressed concrete sections in constant moment zones are developed. The relationship at a crack is obtained, and the effect of bond between the steel and the concrete is inveetigated, leading to the formulation of a method for finding the average moment=curvature relationship for a length of prestressed concrete subjected to constant memento The method of analysis is formulated in such a way as to facilitate coding the problem for computer analysis.
3=1
INITIAL CONDITIONS
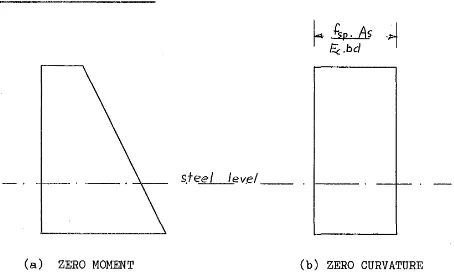
s,Tee/ lev.el _ _
(a)
ZERO
MOMENT
(b) ZERO CURVATURE
[image:46.595.90.544.490.764.2]28
In the analysis of reinforced concrete sections, the initial conditions of concrete and steel strain are tacitly understood to be defined at zero applied moment. For a prestressed concrete section, zero steel strain does not correspond to zero concrete strain, and neither correspond to zero applied moment. Consequently the initial conditions need careful definition.
(a)
CONCRETE STRAINThe initial concrete strain is the strain corresponding to zero stress in the concrete. It should be noted that this is not the concrete strain before transfer, but differs from this value by an
amount equal to the shrinkage and creep of the concrete between transfei and testing.
(b). STEEL STRAIN
The initial steel strain e is defined as the strain in the steel. p
after transfer, when the beam is subjected to zero curvature. See Fig. 3~1 above. This corresponds to the steel strain before transfer diminished by the average losses due to concrete compression, creep, and shrinkage,after transfer. Note that when the prestressing steel
is not at the centroid of the section, this does not correspond to the no-load condition. In this case, a certain moment must act on the section before the initial stress is reached. This initial condition has been chosen for two reasons. First, it is convenient for sub-sequent calculations, and second, it is the easiest condition to
P sp
esi is defined as the incremental steel strain required to bring the strain in the concrete at the level of the steel to zero, from the value at the initial steel stress.
strain corresponding to a stress of
f c
=
f .As sp
That is, esi is the concrete
Thus the steel strain corresponding to the initial concrete strain is e + e .•
p SJ.
3-2 STRESS-STRAIN RELATIONSHIPS
For the preliminary stages of the analysis, the equations of both the steel and the concrete stress-strain curves are considered to be known and to be continuous.
The concrete stress is given by
fc
=
Qc(e)The steel stress is given by
where Qc and Qs denote the concrete and steel stress-strain functions respectively.
For concrete in tension, the strain et at modulus of rupture ft is assumed to be given by
assumed to be linear.
3-3 STRESS CONDITIONS JUST PRIOR TO CRACKING
rr
·ed
(a) STRAINS
(b) STRESSES
c
..
30.
·
-111//(TS ..a-TC(c) FORCES
FIG. 3-2 CONDITIONS PRIOR TO CRACKING
From Fig. 3-2(a)
e
k
=
ce +
et
cFrom Fig. 3-2(b)
X
=
.t
e c
e +e c 6
=
e
c
:::Qc(e) .dx
X
=
0TC
ft.et
•
=
et + e c
TS
=
As.Qs(e
+e .
+e )
6 61 p
e c
~d 0 0 0 0
3-1
+
e
c
s
0 0 0 0
3-2
tb
. o . o
3-2(a)
2
For equilibrium we have
b.
C
=
TC + TSX
=
e c
e +e c s
Qc(e)dx
=
ft.et+ec
tb
.----2 + As.Qs(e +e i+e ) ••• s s p
3-3
In equation
3-3,
e is the only independent variable.c If the
relationships Qc and Qs are known and explicit it will be possible to solve equation
3-3
directly to find e • c Having found e , TC and cTS may be calculated, and the cracking moment Mer may be found from
the expression e
c
X
=
- . d.t
+
TS et+ecThe curvature immediately before cracking is
K
=
e +ec s
d
=
t3-4
STRESS CONDITIONS JUST AFTER FORMATION OF CRACKS3-4-1
CONDITIONS AT A CRACKe +e c s
It is assumed that as soon as cracking occurs, all the tension capacity of the concrete at the crack is effectively lost. In fact 9
to the neutral axis. Consequently, the steel and concrete stresses must redistribute to balance the cracking moment without the assistanc
of'TC.
The normal assumption that steel strains are linearly related to concrete compressive strains is made.
For equilibrium,
b.
C = TS e
c
X = -e +-e
c s .d
Qc(e)dx
=
AsQs( e +e .+e )s S1 p
The moment of these two forces must balance Mer.
:. Mer
=
b.e
c
X
= __
.;;_
e +e c s
.d
Qc(e)x.dx + As.Qs(e +e .+e )d(1
-s S1 p
•••• 3-5
e
- 0- ) ••
3-6
e +e c s
Equations
3-5
and3-6
can be solved simultaneously to yield e c and e , the only two unknowns involved.s
The relationships
3=5
and3=6
will also hold for the conditions ~ a crack for any moment M greater than Mer, where M is substituted for Mer in equation3-6.
K
=
e +e c s
d
3-4-2
BOND LENGTH AND CRACK SPACINGImmediately after the first crack forms in a region of constant moment Mer, a stress condition that varies between two limits exists. Limit A is the situation at a crack, and limit B is the situation some distance lB from the crack, where the stresses have not been affected by the formation of the crack. The stresses at limit B are as described by the equations in Section
3-3
and will exist overconsiderable distances in the constant moment zone.
(a) BOND LENGTH lB
At limit B the steel stress is
f B
=
Qs(e +e1+e . )
s p s sc
where, from equation
3=2,
e
=
et = (et+e).(1-sc c
At limit A the steel stress is ·- Qs(e +e
1+e )
p s s
d
- ) . t
where e is found from equations s
3-5
and3-6.
If the average bond stress between the steel and the concrete is Ts, thenAs
=
=L=¢=r-...
T=s--( f sA- f sB) • 0 • •3=7
34.
(b) CRACK SPACING
At first cracking in a constant moment zone probably one crack alone will form first. This will be due to the non-homogeneity of concrete causing cracking to occur at the section that possesses the weakest modulus of rupture. More cracks will form at sections with slightly higher modulii of rupture as the load is increased. These sections will be at least lB apart.
With initially random cracking, the individual crack spacings soon after the formation of the first crack will vary between two
These cracks will constitute the final cracking
I
pattern, apart from cracks due to causes other than flexural stresses This must be the case, because at higher stresses no more tension can be transferred from the steel to the concrete by bond than after firs cracking since thebond stress will remain approximately constant. Also, the area of concrete over which the tension can be distributed will incFease as the load increases and the neutral axis rises.
Presumably the crack spacing will average 1.51B.
3-4-3 STRESS DISTRIBUTION AT A DISTANCE 1 FROM A CRACK (l~lB)
The assumption is made that at a section some distance from a crack, the steel strain is still linearly related to the concrete compressive strain at that section. This seems to be a reasonable assumption, as it holds for a section before cracking occurs, and provided that the wire diameter is moderately small and the bond is good (conditions normally satisfied by preatressing steel), it also holds at a crack, see Reference
(6).
If the relationship holdsfor no slip (before cracking), and for maximum slip (at a crack), and also holds for average strains, i t must also hold for all sections between cracks where the slip is present, but is less than the maximum value at a crack.
At a distance 1 from a crack, the steel stress will be reduced by bond and the concrete tension will build up. At this stage of the analysis no assumption is made regarding the shape and distribution of tensile stresses and strains across the section.
·
-(a) STRAIN (b) STRESS
36
The reduction in steel tension force over the length 1 is
1
j
r¢.T.dl0
where T is the bond stress and may vary with 1. Therefore, the steeJ tension stress at 1 is
=
Qs(e +e .+e ) ~ p s~ sand the steel strain at 1 is
~1
e
1
=
Qs ( Qs(e +e i+e)-s p s s
Now from Fig. 3=3(a), eel
k
=
.dFor equilibrium C
=
TC
+
TS.
eel
.d X =
-1
j
r¢.T.dlAs
0
1
1
.[¢.T.dl0
- - A : - - s - - )
!
ec1+es1b. Qc(e)dx
=
AsQs<e +e .+e )-z
1
.r¢.T.dl + Tc p s~ s
X=O
0
and taking moments about the neutral axis1
X =
M=/
X
=
0Qc(e)xdx +
1
(AsQs(e +e .i+e p s s )= jr¢T.dl)o 0
•••• 3-8
••• 3-10
Thus, having found the stress conditions at a crack for a given moment M by the solution of equations 3-5 and 3-6, we can find the steel strain at a distance 1 from the crack from equation 3~8. · The simultaneous solution of equations 3-9 and 3-10 yields the remaining unknowns e
01
and TC, and consequently the full stress conditions ata distance 1 from a crack can be found.
With e
01 and TC known, the curvature at the section distance 1 from the crack is given by
K "'
1e l+e c s 1
d
3-5
AVERAGE CURVATURE AT MOMENT M
The average curvature will be given by
Kav
1~
•751B
ecl+esl.dl o751Bod
3-6
SOLUTION OF THE BASIC EQUATIONS
The solution of the equations 3-1 to 3~10 requires a knowledge of four things. They are:
(a) The stress=strain curve of the steel.
(b) The stress~strain curve of the concrete.
(c) The variations of bond stress between cracks.
38.
distance from a crack. That is, a knowledge of k
1 (see Fig. 3-3(b)) is required.
3-6-1 STEEL STRESS-STRAIN CURVE
The actual stress-strain curve for the steel can be obtained by testing. However, it was apparent that no simple equation could be put to a typical steel stress-strain curve, and anything but a simple curve would make the solution of equations 3-1 to 3-10 practically impossible. Consequently it was decided to represent the stress~ strain curve by defining points, up to twenty in number, on the curve and to assume straight lines joining them.
Judicious choice of the position of these points, with a concent· ration in the region of yield, and less in the upper or plastic, and lower or elastic regions enabled a very accurate r~presentation of thE stress-strain curve.
The point n on the curve is defined by a stress A and a strain n
The equation of the line joining point n with point n + 1 is
f s
=
A
n+
3-6-2 CONCRETE STRESS=STRAIN CURVE
• ( e +e . +e - 117 ) s s~ p tn
A large number of concrete stress-strain curves have been postu-lated by different researchers (See (13), (14), (15) 1 (16), for
affect the shape of the stress-strain curve. It is beyond the scope of this study to include the effects of such variations, and a simple curve proposed by Hognestad, (16), and shown below in Fig.
3-4
is assumed to fit all cases..~5fc
0 L---+---~~
0
SIRAIAI
e
FIG.
3=4
CONCRETE STRESS-STRAIN CURVEThe curve consists of a second-order parabola up to a maximum stress, with a linear falling branch. Hognestad used a safe maximum stress of .85fc1 for his curve, which was obtained from tests on short eccentrically loaded columns. Since the present study required a curve applicable to pure flexure and giving average results, it was felt that a maximum stress equal to the cylinder strength fc9 would
4o
Two characteristic strains
e.
and E. define the curve: 0 uG
0 is the strain at maximum stress fc'
Eu is the crushing strain.
The shape of this curve is commensurate with
a
relatively slow rate of loading, as with a fast rate of loading a steeper falling branch would be expected.The equation of the curve is: for 0 ~ e ~c. ,
0
for
(e - €. ) f
=
fc1(1 - .15 - - -0;;..._)c
(E -
e )
u 0 Typical values for
e
and €0 u are: E 0
=
.002, and E u =.oo4.
The calculation of the compressive force in the compression zone of a flexed beam where e is the maximum compressive strain can nowc be performed.
(a)
COMPRESSIVE FORCE C.
0~ e ~e.c 0 From Fig. 3=2(a),
e c (e +e ).x/d
c s
fc1
(e +e )
c s
• (2x - X • 2
(e + e )
c s
dot:
0
c
=
ie
C=
---e +---e c s
(e +e ) 2 (e +e )
C S o (2x - X C S
0
fc'
d.~ 0
fc•.e 2bd e
_ _ _ c _ _ _ ( 1 - __£_,) .
(e c +e ) s •E
0 3<= 0
d.e
0
when e
=
E , c 02fc16 bd
0
c
=
~----3(e:
+e )0 s
(b) COMPRESSIVE FORCE C
E0
~e0
~Euf
=
fc1(1 - .15 (e
e
e +e
(e +e
)x/d -
e; c s 0 ) )Eu -Eo
c .d
)dx
2fc'E bd 0
c s
(e
+e)x/d -
~c s 0
c
=
=
i.(?
c
=
3(e +e ) c s
2fc16' bd 0
3(e +e ) c s
fc'bd
E'o e +e c s
+ fc1bd
fc1(1 - .15( ~===~~))dx
.d
( e - E' )
c 0
o(1 -(e +e )
c s
G -6
u 0
.15(e ~f)
c 0
2(£ -E )
u 0
(e -t: )
c 0
)
- - (2€ /3+
(e +e ) 0
(e-€)(1-o075 ) )
c o (e-~)
c s u 0