ISSN Online: 2152-7393 ISSN Print: 2152-7385
DOI: 10.4236/am.2019.109055 Sep. 26, 2019 769 Applied Mathematics
Mathematical Modeling on Dynamic
Characteristics of the Breakdown Process in
Narrow-Gap of SF
6
Based on the FCT Algorithm
Qiuping Zheng
1, Dianchun Zheng
21Instrumentation Technology & Economy Institute, Beijing, China 2Harbin University of Science and Technology, Harbin, China
Abstract
The two-dimensional and self-consistent fluid model of the SF6 discharge was
established based on the electron and ions continuity transfer equations coupled to Poisson’s equation, and also simultaneously considered the pho-toionization event, and then the flux corrected transport technique (FCT) was employed to numerically solve the particle flux-continuity equations, and some significant microphenomena were achieved that the dynamic behaviors of the charged particles, the spatio-temporal evolution of the discharge
chan-nel and the transformation law of the avalanche-streamer for the SF6
nar-row-gap were revealed in this paper.
Keywords
FCT, SF6, Avalanche, Streamer, Photoionization
1. Introduction
Usually, the approaches to explore gas discharge phenomenon can be classified into experimental and theoretical methods. Experimental method can directly observe the discharge events, but the discharge mechanisms have not been clearly discovered in detail. However, the theoretical method not only gains key data for the dielectric breakdown of gases, but also some microcosmic parame-ters on controlling dynamic behaviors of charged particles produced in the time of the gas discharge process are founded [1] [2] [3]. Recently, the computational fluid dynamics has been widely used in the gas discharge field due to its advan-tages in explicit physical concept, legible image exhibition and highly calculating efficiency [4] [5] [6].
How to cite this paper: Zheng, Q.P. and Zheng, D.C. (2019) Mathematical Model-ing on Dynamic Characteristics of the Breakdown Process in Narrow-Gap of SF6
Based on the FCT Algorithm. Applied Ma-thematics, 10, 769-783.
https://doi.org/10.4236/am.2019.109055
Received: August 21, 2019 Accepted: September 23, 2019 Published: September 26, 2019
Copyright © 2019 by author(s) and Scientific Research Publishing Inc. This work is licensed under the Creative Commons Attribution International License (CC BY 4.0).
DOI: 10.4236/am.2019.109055 770 Applied Mathematics
Despite the fact that the electron and ion densities can attain very steep gra-dients and make the shock fronts in particule fluids along the discharge channel when the gas discharge is triggered and developed in the overall process under the stimulation of electric field, the FCT technique (flux corrected transport) shows high efficiency and accuracy dealing with the intricacy situation [7] [8] [9]. By virtue of the excellent thermodynamic, dielectric and transport propeties, SF6 is widely used in the eletrical industry, especially in the high voltage circuit
breaker technology, although it might be replaced by the environment friendly insulating gases. Nevertheless, it is necessary to accurately find microcosmic mechanisms of the particle dynamical behaviors, the spatio-temporal characte-ristics of the electric field and the track evolution of the discharge channel along the direction of the specific discharge development for broader application do-main.
This paper is organized as following: the mathematical model, the FCT algo-rithm and constraint conditions are carefully presented inSection 2, and the re-sults of the mathematical simulation are analyzed in Section 3 including the fol-lowing contents: 3.1, avalanche phase; 3.2, streamer formation phase; 3.3, the discharge channel evolution and the photoionization effect. Some valuable con-clusions are given in Section 4.
2. The Model and FCT Algorithm
2.1. Model of the Gas Discharge
The model for the narrow-gap with parallel plate electrodes which are filled with SF6 gas has been presented in detail [10] [11], and the spatio-temporal evolution
of the SF6 discharge overall process is mathematically modeled by a set of
equa-tions governing the transport of particles, moment and energy for ions and elec-trons together with the electric field equation as follows [12] [13]:
( )
e(
e e)
eph e e e e e p
N N v N
S N v N v N N D
t α η β z z z
∂ ∂ ∂ ∂
= + − − − +
∂ ∂ ∂ ∂ (1)
( )
p(
p p)
ph e e e p n p
N N v
S N v N N N N
t α β β z
∂ ∂
= + − − −
∂ ∂ (2)
( )
n(
n n)
e e p n
N N v
N v N N
t η β z
∂ ∂
= − −
∂ ∂ (3)
here t is the time, r and z are the radius and axis distances for the calculating subregion; Ne, Np and Nn are the electron, positive and negative ion
densi-ties; ve, vp and vn are respectively the electron, positive and negative ion
drift velocity; the symbols
α
,β
, η and D are ionization, adsorption,DOI: 10.4236/am.2019.109055 771 Applied Mathematics
reaches the ionization critical value, then the photoionization process occurs and produces a certain amount of the photo electron. Generally speaking, the num-ber of photon electron is much smaller than that of the electrons generated by impact ionization. However, these photon electrons would result in the forma-tion of the secondary avalanche, which moves towards the head of the first ava-lanche, composes a big avalanche and accelerates the development of the dis-charge process. Hence the photoionization effect plays a significant role in the gas discharge process. The term Sph, being a source term due to photoionization, is represented as shown below:
( )
(
) ( ) ( ) ( )
*(
)
0 exp d
d
ph p e e
S z =
γ
∫
Ω −z z N′ z′α
z′ν
z′ × −µ
z−z′ z′ (4)here γp,
*
α and µ are second ionization, excitation and absorption coeffi-cients, and Ω is the solid angle subtended at z′ by the disk charge at the
point z. A detail solution about Sph can be referred to the literature [15]. Taking into account the distortion of space charge effects on the electric field, the Poisson equation is given by:
(
)
2 2 2 2 2 0 1p e n
q
N N N
r r
r z
ϕ
ϕ
ϕ
ϕ
ε
∂ ∂ ∂
∇ = + + = − − −
∂
∂ ∂ (5)
where ϕ is the electric potential; q is the electronic charge; ε0 is the
permit-tivity of the free space. The current I in the external circuit due to the motion of electrons and ions between the electrodes is calculated by the Sato formula [16]:
(
)
2
0 d
d
p p n n e e
r q
I N v N v N v z
d π
=
∫
− − (6)here, r is the radius of the discharge channel, q is the electronic charge.
The convection term of particle’s continuity Equations (1)-(3) are solved by the FCT technique and other items are used the finite difference directly to solve and the Poisson’s Equation (5) is numerically resolved by the over-relaxation iteration.
2.2. FCT Algorithm
The convective terms of Equations (1), (2) and (3) are written as
( )
conv Nv N t x ∂ ∂ = −∂ ∂ , where symbol N shows the density of the particle species
and
v
is their velocities.Taking (rN ) as the dependent variable for an axisymmetric cylindrical
coor-dinate system, then
( )
conv
rN f g
t r z
∂ = −∂ −∂
∂ ∂ ∂ (7)
where
,
r z
f =rNv g=rNv (8)
DOI: 10.4236/am.2019.109055 772 Applied Mathematics
1). Compute L
1 , 2
i j
F
+ and
L 1 , 2 i j G
+ by a low order monotonic scheme (donor
cell).
2). Compute H
1 , 2
i j
F
+ and
H 1 , 2 i j G
+ by a high order scheme.
3). Define the anti-diffusive fluxes:
H L H L
1 1 1 1 1 1
, , , , , ,
2 2 2 2 2 2
,
i j i j i j i j i j i j
A F F A G G
+ = + − + + = + − + (9)
4). Compute the low order time advanced solution:
td t L L L L
, , 1 1 1 1
, , , ,
, 2 2 2 2
1
i j i j
i j i j i j i j
i j
N N F F G G
V + − + −
= − − + −
∆ (10)
5). Limit the anti-diffusive fluxes:
C
1 1 1 1
, , , ,
2 2 2 2
, 0 1
i j i j i j i j
A A C C
+ = + + ≤ + ≤ (11)
C
1 1 1 1
, , , ,
2 2 2 2
, 0 1
i j i j i j i j
A A C C
+ = + + ≤ + ≤ (12)
6). Apply the limited anti-diffusive fluxes:
td C C C C
, , 1 1 1 1
, , , ,
, 2 2 2 2
1
t t
i j i j
i j i j i j i j
i j
N N A A A A
V
+∆
+ − + −
= − − + −
∆ (13)
where Vi j, , ri j, , Ni j, and Ci j, are the volume, radial distance, density and
anti-diffusive coefficient of the
( )
i j, cell, and further details and calculationprocedure on the FCT can be found in the literature [3].
2.3. Constraint Conditions
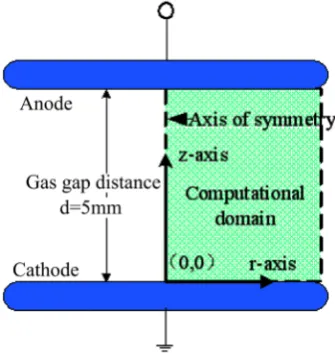
[image:4.595.289.457.525.702.2]In this paper, schematic diagram and the constraint conditions for parallel-plate electrodes discharge under atmospheric pressure are set as shown in Figure 1, and the calculation model is converted to a two-dimensional structure by rotating the axis of symmetry. In the present study, the gap distance between the elec-trodes filled with SF6 gas is 5 mm under the pressure 0.1 MPa and temperature
DOI: 10.4236/am.2019.109055 773 Applied Mathematics
300 K. The spatial mesh chosen to be uniform with 40,000 mesh points, namely, the longitudinal axis (z-axis) and the radial axis (r-axis) are all uniformly
di-vided into 200 grids. Then 9
0.05 10 s
t −
∆ = × is taken as time step, which is
sig-nificantly smaller than that required for stability of the used numerical scheme
[3]. At the initial moment of time for gas discharge, the quasi–neutral plasma spot of Gaussian shape in the radial and axial directions is placed at the front of cathode:
2 2
0 0
0 0 exp
et pt
r z
z z
r
n n n
δ δ = = − = = − −
(14)
where r z, is the radial and axial coordinates respectively; the origin of
coor-dinates (r= =z 0) is positioned at the center of cathode surface, the peak value
density of particles (seed electrons and positive ions) is 6 3
0 10 m
n = − , the
posi-tion of initial plasma z0 =0.1 cm, characteristic scales
4
2.5 10 m
r
δ = × − and
4
2.5 10 m
z
δ = × − .
Boundary conditions for electrons and positive ions at the electrodes are as follows:
0 0
0, p p 0
e e
z z d z z d
n n
n n
z = z = z = z =
∂ ∂
∂ ∂
= = = =
∂ ∂ ∂ ∂
The solution of Poisson's equation is subject to the following boundary condi-tions:
0 0
0 0
0
, 0, 0,
z z r R
r
V z
V V V V V
r d = = = = ∂ = = = = ∂
where V0 is the applied voltage, r is the radius of the computational domain.
3. Modeling Results
The space between parallel-plane electrodes 0.5 cm apart is filled SF6 gas with
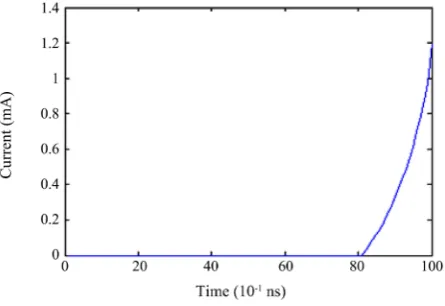
standard atmospheric pressure and commercial purity, and the 46 kV DC is ap-plied on the anode plane, then the cathode grounding. The incepting discharge of the model is trigged by the seed electrons having a Gaussian distribution near the cathode at t=0 ns (located at 0.1 cm from the cathode as mentioned
earli-er). Under the electric field, the seed electrons obtain energy to migrate, impact the neutral molecules and produce much more charged particles, so that the current through parallel-plane electrodes is shown in Figure 2. The transition time of the electron for the model is about 10 ns, according to the principle of gas discharge, the whole discharge process undergoes two phases from the ava-lanche to the streamer phase while the discharge incepted.
3.1. Avalanche Phase
The electric field stress 92 kV/cm applied to the SF6 gap, which slightly larger
smooth-DOI: 10.4236/am.2019.109055 774 Applied Mathematics
ly. With the electrons migrating to the anode and impacting with neutral
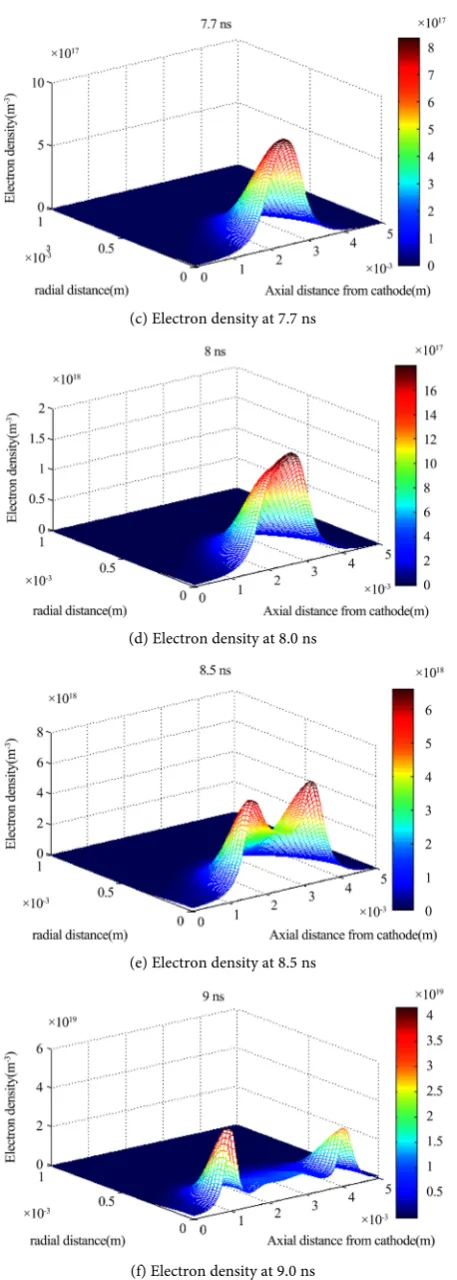
mole-cules, an electron swarm is quickly made up as shown in Figure 3. When about
7.7 ns moment, the peak value of the electron swarm is up to the 18 3
1.01 10 cm× −
at the point z=0.25 cm apart from the cathode, and corresponding positive
and negative ions densities are 18 3
3.97 10 cm× − and 18 3
3.22 10 cm× −
respec-tively as shown in Figure 7 and Figure 8, then the distortion of the space electric field is not remarkable as shown in Figure 4 at 7.5 and 7.7 ns moments, there-fore the interval from t=0 ns to the t=7.7 ns usually is known as the
[image:6.595.263.486.221.374.2]ava-lanche phase according to the gas discharge theory [18].
Figure 2. External circuit current.
(a) Electron density at 0 ns
DOI: 10.4236/am.2019.109055 775 Applied Mathematics
(c) Electron density at 7.7 ns
(d) Electron density at 8.0 ns
(e) Electron density at 8.5 ns
[image:7.595.261.490.64.705.2](f) Electron density at 9.0 ns
DOI: 10.4236/am.2019.109055 776 Applied Mathematics
(a) Axial electric field at 7.0 ns
(b) Axial electric field at 7.5 ns
DOI: 10.4236/am.2019.109055 777 Applied Mathematics
(d) Axial electric field at 8.0 ns
(e) Axial electric field at 8.3 ns
[image:9.595.257.486.61.698.2](f) Axial electric field at 9.0 ns
DOI: 10.4236/am.2019.109055 778 Applied Mathematics
3.2. Streamer Phase
When the avalanche volume reaches to the critical value, it instantly changes the avalanche phase into the streamer phase, namely, the streamer phase formation
[19] [20]. It is demonstrated in Figure 3 and Figure 4 that the electron densities are visibly larger than that of the avalanche phase in the interval 7.7 - 8.0 ns, al-though the distorting of space electric field is still slight enhancement, it is con-sidered an initial period of the streamer phase.
From the 8.0 ns moment, the streamer discharge is rapidly development, its volume is promptly expanded and the length is also stretched quickly, and si-multaneously the electric field distortion is also exacerbated as shown in Figure 5, then the mainly changes of the density distribution of charged particles for the electron, positive and negative ions on the axial direction are shown in Figures
6-8, the procedure described is rather intricacy including the dynamical
[image:10.595.216.533.296.474.2]beha-viors of the charged particles in the electric field [21] [22].
Figure 5. Axial electric field distributions at 7.7 ns, 8.0 ns, 8.3 ns, 8.6 ns, 8.9 ns and 9.2 ns, respectively.
[image:10.595.216.532.525.693.2]DOI: 10.4236/am.2019.109055 779 Applied Mathematics
Figure 7. Axial distributions of positive ions at 7.7 ns, 8.0 ns, 8.3 ns, 8.6 ns, 8.9 ns and 9.2 ns, respectively.
Figure 8. Axial distributions of negative ions at 7.7 ns, 8.0 ns, 8.3 ns, 8.6 ns, 8.9 ns and 9.2 ns, respectively.
1)The anode-directed streamer
When the transformation avalanche into the streamer phase, the peak value of
the electron densities from location z=0.25 cm at 7.7 ns to the point
0.44 cm
z= at t=9.2 ns is shown in Figure 6, and the streamer head moves
to the anode at an average speed 6
1.33 10 cm s× . The positive and negative ion
densities in the anode-directed streamer head increase steadily from
18 3
4.43 10 cm× − to 19 3
1.09 10 cm× − and from 18 3
3.62 10 cm× − to
19 3
9.41 10 cm× − respectively shown in Figure 7 and Figure 8. The head of the
anode-directed streamer shows the electro-negativity due to gathering most electrons and greatly enhanced field intensity of the short distance between the head with the anode plate, so that SF6 molecule ionization in this small region is
[image:11.595.210.537.312.484.2]DOI: 10.4236/am.2019.109055 780 Applied Mathematics
until the head arrives at the anode plate. 2) The cathode-directed streamer
As shown in Figure 6, the curve of electron distribution at z=0.18 cm and 8.3 ns
t= presents the clearly escalating trend, that is to say, the event of the
cathode-directed streamer obviously happens, then the appeared moment of the cathode-directed streamer is later than that of the anode-directed one. In con-trast with anode-directed streamer, the head of the cathode-directed streamer presents the electro-positivity, because the electric field is strengthened in the short space between the cathode plate and the head, then the ionization rate of the SF6 molecule is greatly accelerated and much stronger, the velocity of the
ca-thode-directed streamer at 9.2 ns is 6
0.92 10 cm s× at z=0.088 cm location,
which is only about 70% of the velocity of the anode-directed streamer in the same moment.
3.3. Discharge Channel and Photoionization
As mentioned above, the discharge process in the narrow-gap of the SF6
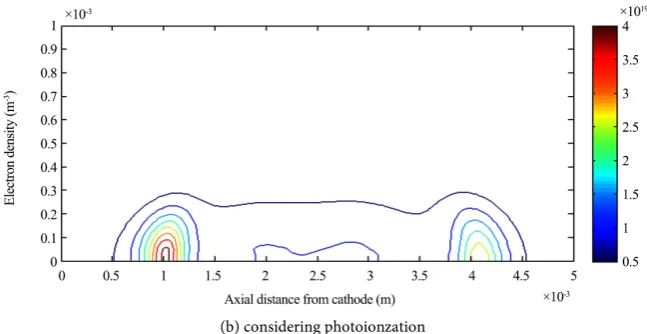
under-goes transformation from the avalanche to the streamer phase, once the streamer is triggered it soon develops respectively towards the anode and cathode plate, namely, the anode-directed streamer and the cathode-directed streamer, at the same time accompanied by the photoionization appeared, the streamer volume not only grows quickly presenting a near cylindrical shape and but also the streamer length becomes much longer till through the anode and cathode plate, then the discharge path of the both electrode is formed and known as a break-down channel. The fact has been proved by the experiment results and theoreti-cal demonstration, the photoionization plays an important role and not been
overlook when the whole discharge process in the narrow-gap of the SF6
under-goes transformation from the avalanche to the streamer phase. The results of the
mathematical modeling in this paper shows in Figure 9, considering and
ignor-ing photoionization could achieve different results, if you ignore the photoioni-zation effect, you might get the false result [23].
DOI: 10.4236/am.2019.109055 781 Applied Mathematics
[image:13.595.211.535.70.237.2](b) considering photoionzation
Figure 9. Electron density contour in SF6 at 9 ns.
4. Conclusions
Based on the fluid model of gas discharge and the FCT algorithm, dynamic
cha-racteristics of the SF6 breakdown process in narrow-gap has mathematically
modeled and some important facts has demonstrated that the FCT algorithm is an efficient theoretical way to deal with the troublesome problems having shock fronts in the discharge channel. The results are both shown via easy visualization for the complicated course of the SF6 discharge and revealed dynamic
characte-ristics of the charged particles during the SF6 discharge process in narrow-gap.
According to the mathematical model and numerical analysis results in this paper, the breakdown process in narrow-gap of SF6 still presents two phases at
the standard atmospheric pressure, and parallel-plane electrodes 0.5 cm apart and the 46 kV DC applied. Moreover, some facts are indicated that when elec-trons increase to a certain amount and the avalanche phase changes into the streamer phase. On the one hand, in the electron avalanche phase, the collision ionization is the key rule for producing electrons and making them grow fast
until the electron swarms up to the 18 3
1.01 10 cm× − . The microcosmic
mechan-isms of the particle dynamical behaviors, the spatio-temporal characteristics of the electric field and the track evolution of the discharge channel are shown in
Figure 3 and Figure 4 in the interval from t=0 ns to the t=7.7 ns. In this
interval, the collision between SF6 molecule and seed electrons is only triggered
by the external electric field. When time ranges from t=7.7 ns to the 8.0 ns, a
dramatic change happens in the electron number and electric field of the gas-gap; that is to say, the streamer discharge would be coming. On the other hand, in the streamer phase, from the 8.0 ns moment, the streamer discharge is rapidly de-veloping; its volume is promptly expanded and the length is also stretched quickly, and simultaneously the electric field distortion is also exacerbated as shown in Figure 5, then the main changes of the density distribution of charged particles for the electron, and positive and negative ions on the axial direction are shown in Figures 6-8.
DOI: 10.4236/am.2019.109055 782 Applied Mathematics
the streamer discharge phase.
Accompanied by the photoionization, the space charges of the gas-gap are multiplicatively increased and led to extremely distorting of the electric field within the discharge channel, and then the streamer dramatically develops to-ward both anode and cathode plates, and a plasma region is left in the central part of the streamer; meanwhile, the distorted electric field also speeds up the streamer velocity forward to both plates till bridging the anode and cathode plate; finally, the gas-gap is absolutely broken down.
Acknowledgements
This work was supported financially by National Natural Science Foundation of China, No. 51077032.
Conflicts of Interest
The authors declare no conflicts of interest regarding the publication of this pa-per.
References
[1] Boris, J.P., Book, D.L. and Shasta, A. (1973) Fluid Transport Algorithm that Works.
Journal of Computational Physics, 11, 38-69.
https://doi.org/10.1016/0021-9991(73)90147-2
[2] Zalesak, S.T. (1979) Fully Multidimensional Flux-Corrected Transport. Journal of Computational Physics, 31, 335-362. https://doi.org/10.1016/0021-9991(79)90051-2
[3] Zheng, D.C. (2016) Numerical Simulation Methods for Gas Discharge. Science Press, Beijing.
[4] Morrow, R. (1986) A Survey of the Electron and Ion Transport Properties of SF6.
IEEE Transactions on Plasma Science, 14, 234-239. https://doi.org/10.1109/TPS.1986.4316534
[5] Dhali, S.K. and Williams, P.F. (1987) Two-Dimensional Studies of Streamers in Gases. Journal of Applied Physics, 62, 4696-4707. https://doi.org/10.1063/1.339020
[6] Kulikovsky, A.A. (1995) Two-Dimensional Simulation of the Positive Streamer in N2 between Parallel-Plate Electrodes. Journal of Physics D: Applied Physics, 28,
2483-2493.https://doi.org/10.1088/0022-3727/28/12/015
[7] Georghiou, G.E., Morrow, R. and Metaxas, A.C. (1999) The Theory of Short Gap Breakdown of Needle Point-Plane Gaps in Air Using Finite-Difference and Fi-nite-Element Methods. Journal of Physics D: Applied Physics, 32, 1370-1385.
https://doi.org/10.1088/0022-3727/32/12/314
[8] Lehmann, K.K. and Callegari, C. (2002) Quantum Hydrodynamic Model for the Enhanced Moments of Inertia of Molecules in Helium Nanodroplets: Application to SF6. The Journal of Chemical Physics, 117, 1595-1603.
https://doi.org/10.1063/1.1486443
[9] Pancheshnyi, S.V. and Starikovskii, A.Yu. (2003) Two-Dimensional Numerical Modelling of the Cathode-Directed Streamer Development in a Long Gap at High Voltage. Journal of Physics D: Applied Physics, 36, 2683-2691.
https://doi.org/10.1088/0022-3727/36/21/014
DOI: 10.4236/am.2019.109055 783 Applied Mathematics under the Uniform Electric Field. Master Thesis, Harbin University of Science and Technology, Harbin.
[11] Morrow, R. (1991) Theory of Positive Corona in SF6 Due to a Voltage Impulse.
IEEE Trans on Plasma Science, 19, 86-94. https://doi.org/10.1109/27.106801
[12] Morrow, R. (1987) Properties of Streamers and Streamer Channels in SF6. Physical
Review A, 35, 1778. https://doi.org/10.1103/PhysRevA.35.1778
[13] Zheng, D.C. (2019) SF6 Dielectric Behaviors and Application. Science Press, Beijing.
[14] Zhu, S.H. (2012) The Dynamic Behaviors of Discharge Process in SF6/N2 in Short-Gap.
Master Thesis, Harbin University of Science and Technology, Harbin.
[15] Boris, J.P. and Book, D.L. (1976) Solution of Continuity Equations by the Method of Flux-Corrected Transport. Methods in Computational Physics, 1, 85-129.
https://doi.org/10.1016/B978-0-12-460816-0.50008-7
[16] Sato, N. (1980) Discharge Current Induced by the Motion of Charged Particles.
Journal of Physics D: Applied Physics, 13, 3-6. https://doi.org/10.1088/0022-3727/13/1/002
[17] Boris, J.P. and Book, D.L. (1973) Flux-Corrected Transport. I. SHASTA, a Fluid Transport Algorithm That Works. Journal of Computational Physics, 11, 38-69.
https://doi.org/10.1016/0021-9991(73)90147-2
[18] Pedersen A. (1967) Calculation of Spark Breakdown or Corona Starting Voltages in Nonuniform Fields. IEEE Transactions on Power Apparatus and Systems, PAS-86, 200-206. https://doi.org/10.1109/TPAS.1967.291836
[19] Luque, A. and Ratushnaya, V. (2008) Ute Ebert, Positive and Negative Streamers in Ambient Air: Modelling Evolution and Velocities. Journal of Physics D: Applied Physics, 41, 1-18.https://doi.org/10.1088/0022-3727/41/23/234005
[20] Raether, H. (1964) Electron Avalanches and Breakdown in Gases. Butterworths, London, 15-22.
[21] Bonisch, S., Kalkner, W. and Pommerenke, D. (2003) Modeling of Short-Gap ESD under Consideration of Different Discharge Mechanisms. IEEE Transactions on Plasma Science, 31, 736-744. https://doi.org/10.1109/TPS.2003.815823
[22] Georghiou, G.E., Papadakis, A.P., Morrow, R. and Metaxas, A.C. (2005) Numerical Modelling of at Mospheric Pressure Gas Discharges Leading to Plasma Production.
Journal of Physics D: Applied Physics, 38, 303-328. https://doi.org/10.1088/0022-3727/38/20/R01