C L I M A T O L O G Y
2015 © The Authors, some rights reserved; exclusive licensee American Association for the Advancement of Science. Distributed under a Creative Commons Attribution NonCommercial License 4.0 (CC BY-NC). 10.1126/sciadv.1500561Old World megadroughts and pluvials during
the Common Era
Edward R. Cook,
1* Richard Seager,
1Yochanan Kushnir,
1Keith R. Briffa,
2Ulf Büntgen,
3David Frank,
3Paul J. Krusic,
4Willy Tegel,
5Gerard van der Schrier,
6Laia Andreu-Hayles,
1Mike Baillie,
7Claudia Baittinger,
8Niels Bleicher,
9Niels Bonde,
8David Brown,
7Marco Carrer,
10Richard Cooper,
2Katarina
Č
ufar,
11Christoph Dittmar,
12Jan Esper,
13Carol Griggs,
14Björn Gunnarson,
15Björn Günther,
16Emilia Gutierrez,
17Kristof Haneca,
18Samuli Helama,
19Franz Herzig,
20Karl-Uwe Heussner,
21Jutta Hofmann,
22Pavel Janda,
23Raymond Kontic,
24Nesibe Köse,
25Tomá
š
Kyncl,
26Tom Levani
č
,
27Hans Linderholm,
28Sturt Manning,
14Thomas M. Melvin,
2Daniel Miles,
29Burkhard Neuwirth,
30Kurt Nicolussi,
31Paola Nola,
32Momchil Panayotov,
33Ionel Popa,
34Andreas Rothe,
35Kristina Seftigen,
28Andrea Seim,
28Helene Svarva,
36Miroslav Svoboda,
23Terje Thun,
36Mauri Timonen,
19Ramzi Touchan,
37Volodymyr Trotsiuk,
23Valerie Trouet,
37Felix Walder,
9Tomasz Wa
ż
ny,
37,38Rob Wilson,
39Christian Zang
40Climate model projections suggest widespread drying in the Mediterranean Basin and wetting in Fennoscandia in
the coming decades largely as a consequence of greenhouse gas forcing of climate. To place these and other
“
Old
World
”
climate projections into historical perspective based on more complete estimates of natural hydroclimatic
variability, we have developed the
“
Old World Drought Atlas
”
(OWDA), a set of year-to-year maps of tree-ring
reconstructed summer wetness and dryness over Europe and the Mediterranean Basin during the Common Era.
The OWDA matches historical accounts of severe drought and wetness with a spatial completeness not previously
available. In addition, megadroughts reconstructed over north-central Europe in the 11th and mid-15th centuries
reinforce other evidence from North America and Asia that droughts were more severe, extensive, and prolonged
over Northern Hemisphere land areas before the 20th century, with an inadequate understanding of their causes.
The OWDA provides new data to determine the causes of Old World drought and wetness and attribute past
climate variability to forced and/or internal variability.
INTRODUCTION
Instrumental observations show that the Mediterranean region has been
drying since the 1970s (
1
). Coupled climate model simulations from
Phase 5 of the Coupled Model Intercomparison Project archive,
per-formed as part of the Intergovernmental Panel on Climate Change
Working Group 1 Fifth Assessment Report (
2
), further suggest that the
Mediterranean will undergo severe and widespread drying in the coming
decades as a consequence of rising greenhouse gases (GHGs) (
3
).
How-ever, the recent drying trend has been variably attributed to a mixture of
natural climate variability and anthropogenically forced change (
4
,
5
),
with similar challenges in understanding both wetting and drying
trends in other parts of Europe and farther afield (
6
,
7
). This
uncer-tainty arises because the instrumental climate records used in attribution
studies are relatively short, are likely to be confounded by unspecified
levels of GHG forcing, and are unlikely to include the full range of
natural variability. In addition, determining the complete range of
pos-sible future climate states from climate models requires knowing both
the response to changes in anthropogenic forcing and the potential
range of natural variability that will underlie it. Climate models are
es-sential tools for diagnosing ongoing and future climate change, making
it necessary to determine how well they represent each of these drivers
of climate variability.
An extended record of natural hydroclimatic variability from
tree-ring reconstructed drought and wetness before the instrumental era is
a crucial estimate of past climate variability caused by both forced
var-iability and internal varvar-iability, which is ideal for assessing the true
range of hydroclimate variability in the preindustrial past and the
de-gree to which climate models properly represent it. The North American
Drought Atlas (NADA), released in 2004 (
8
), made clear that droughts of
1
Lamont-Doherty Earth Observatory of Columbia University, Palisades, NY 10964, USA.
2
Climatic Research Unit, University of East Anglia, Norwich NR4 7TJ, UK.
3Swiss Federal
Re-search Institute WSL, Birmensdorf 8903, Switzerland.
4Navarino Environmental Observatory,
Messinia 24001, Greece.
5Institute for Forest Growth (IWW), University of Freiburg, Freiburg 79106,
Germany.
6Royal Netherlands Meteorological Institute (KNMI), De Bilt 3730, The Netherlands.
7
Paleoecology Center, Queens University, Belfast BT7 1NN, Northern Ireland.
8National Museum
of Denmark, Copenhagen DK-1220, Denmark.
9Competence Center for Underwater
Archae-ology and DendrochronArchae-ology, Office for Urbanism, City of Zürich, Zürich 8008, Switzerland.
10
TeSAF Department, Università degli Studi di Padova, Agripolis, Legnaro I-35020, Italy.
11
Biotechnical Faculty, University of Ljubljana, Ljubljana SI-1000, Slovenia.
12Environmental
Research and Education (UFB), Mistelbach 95511, Germany.
13Department of Geography,
Johannes Gutenberg University, Mainz 55099, Germany.
14Cornell Tree Ring Laboratory,
Cornell University, Ithaca, NY 14853, USA.
15Department of Physical Geography, Stockholm
University, Stockholm SE-106, Sweden.
16Technische Universität Dresden, Tharandt D-01737,
Germany.
17Department of Ecology, University of Barcelona, Barcelona 08028, Spain.
18Flanders
Heritage Agency, Brussels 1210, Belgium.
19Natural Resources Institute Finland, Rovaniemi
FI-96301, Finland.
20Bavarian State Department for Cultural Heritage, Thierhaupten 86672,
Germany.
21German Archaeological Institute (DAI), Berlin 14195, Germany.
22Jahrringlabor
Hofmann, Nürtingen 72622, Germany.
23Department of Forest Ecology, Czech University of
Life Sciences, Prague 16521, Czech Republic.
24Labor Dendron, Basel 4057, Switzerland.
25
Faculty of Forestry, Istanbul University, Bahcekoy, Sariyer 34473, Istanbul, Turkey.
26Moravian
Dendro-Labor, Brno 61600, Czech Republic.
27Slovenian Forestry Institute, Ljubljana SI-1000,
Slovenia.
28Department of Earth Sciences, Gothenburg University, Gothenburg SE-405,
Sweden.
29Oxford Dendrochronology Laboratory, Oxford University, Oxford RG4 7TX, UK.
30
DeLaWi
–
Tree Ring Analyses, Windeck D-51570, Germany.
31Institut für Geographie,
Universität Innsbruck, Innsbruck A-6020, Austria.
32Dipartimento di Scienze della Terra e
dell
’
Ambiente, Università degli Studi di Pavia, Pavia 27100, Italy.
33Dendrology Department,
University of Forestry, Sophia 1756, Bulgaria.
34Forest Research and Management Institute,
Calea Bucovinei, Campulung Moldovenesc 725100, Romania.
35Faculty of Forestry,
Uni-versity of Applied Sciences Weihenstephan-Triesdorf, Freising 85354, Germany.
36NTNU
University Museum, Norwegian University of Science and Technology, Trondheim 7012,
Norway.
37Laboratory of Tree-Ring Research, University of Arizona, Tucson, AZ 85721, USA.
38
Nicolaus Copernicus University, Torun 87-100, Poland.
39School of Geography and Geosciences,
University of St. Andrews, St. Andrews KY16 9AL, Scotland.
40Ecoclimatology, Technische
Universität München, Freising 85354, Germany.
*Corresponding author. E-mail: [email protected]
on November 12, 2015
http://advances.sciencemag.org/
a severity and a longevity not seen in the 19th and 20th centuries
oc-curred more frequently in earlier centuries, and this has sparked a range
of efforts to determine whether climate models can simulate such events
(
9
,
10
). Here, we present the Old World Drought Atlas (OWDA), a new
tree ring
–
based field reconstruction of past droughts and pluvials over
Europe, North Africa, and the Middle East spanning the Common Era
(CE), which will facilitate similar advances in understanding and
modeling hydroclimate variability in the Old World.
RESULTS
The OWDA is a set of year-by-year maps of reconstructed summer
season [June-July-August (JJA)] self-calibrating Palmer Drought
Se-verity Index (scPDSI) (
11
) on a 5414-point half-degree
longitude-by-latitude grid (Fig. 1). The JJA scPDSI reflects spring-summer soil
moisture conditions and is the same season reconstructed in the NADA
(
8
) and Monsoon Asia Drought Atlas (MADA) (
12
). The OWDA is
based on the same regression-based climate field reconstruction
method used to produce the NADA and the MADA. These common
properties allow for direct comparisons of the drought atlases. The
OWDA also provides a longer and more spatially complete
reconstruc-tion of hydroclimatic variability over the Old World compared to
pre-vious estimates based on instrumental, historical, and natural records
(Supplementary Materials). In addition to the tree-ring data from living
trees, we assembled an exceptional amount of historical, archaeological,
and subfossil tree-ring data to extend many chronologies back a
millen-nium or more in time (Supplementary Materials). This allows us to
make informed statements about the properties of hydroclimatic
vari-ability during medieval times in the Old World.
Dendroclimatic reconstructions are traditionally validated through
comparisons of tree ring
–
based climate estimates with 20th-century
instrumental data that have not been used for calibration (
8
,
12
). This
was performed as well for the OWDA by withholding 1901
–
1928
in-strumental scPDSI data from the 1928
–
1978 calibration period for
val-idation testing (Supplementary Materials). However, the vast amount of
historical climate information from Europe extending back many
cen-turies (
13
) allows for far more extensive comparisons of OWDA
recon-structions with recorded droughts and pluvials. We compare the OWDA
to several historically documented extreme hydroclimatic events (with
additional comparisons shown in Supplementary Materials), with
em-phasis on those events that reflect the spring-summer moisture
condi-tions most relevant to the OWDA.
The great drought of 1921: On the basis of an evaluation of
instru-mental climate data not used to calibrate the OWDA, this drought
was described as
“
a year of unprecedentedly small rainfall
”
over large
parts of the British Isles, with the worst deficit occurring in
south-eastern England where London may have experienced its driest year
since 1774 (
14
). The OWDA map for 1921 (Fig. 2A) shows the most
extreme drought occurring in southern England, in accordance with the
report. It also shows serious drought extending over most of central
Europe but less dry conditions in peninsular Italy, a result consistent
with other reports from Europe (
15
).
The great drought of 1893: Evaluated again using instrumental climate
data,
“…
the absence of rain was phenomenal
”
during the period March
to June, with a rainfall deficit gradient from 30 to 50% of normal over
southern England to 50 to 90% of normal over Scotland and Ireland (
16
).
The 1893 OWDA map (Fig. 2B) shows a similar north-south gradient
of rainfall deficit over the British Isles and also shows the drought
ex-tending over continental Europe, as alluded to in this report.
The Irish famine of 1740
–
1741: This event has been attributed to
unusually low winter and spring temperatures in 1740, resulting in crop
failures and subsequent famine (
17
). The OWDA is not well suited for
determining temperature anomalies because it primarily reflects warm
season hydroclimate. However, climate field reconstructions of seasonal
precipitation from documentary and early instrumental data (
18
)
indi-cate that spring-summer rainfall over Ireland in 1741 was well below
normal relative to the modern average. Drought over Ireland may
there-fore have contributed to the severity of the famine through its negative
impact on food production in 1741. The OWDA map of 1741 (Fig. 2C)
indicates severe drought over Ireland that also extended over England
and Wales, consistent with previously reported record rainfall deficits (
19
).
The great droughts of 1616 and 1540: Droughts over Czech lands
have been reconstructed from documentary records since 1090 CE, with
five
“
outstanding drought events
”
(1540, 1590, 1616, 1718, and 1719)
described (
20
). We highlight the 1616 and 1540 droughts here but note
that all five outstanding drought events over Czech lands are well
expressed in the OWDA (Supplementary Materials). The 1616 drought
began in the spring and continued throughout the summer with
“
great
heat, dried-up rivers
”
and a mark on a
“
hunger stone
”
on the Elbe River
(
20
). Similar conditions also extended into Switzerland and Germany.
The OWDA map of 1616 (Fig. 2D) indicates severe to extreme drought
over central and eastern Europe, much the same as indicated on Czech
documentary records. The 1540 drought has been described as a
“
worst-case
”
event in terms of both precipitation deficit and excessive warmth
0˚0˚
20˚ 20˚
40˚ 40˚
40˚ 40˚
60˚ 60˚
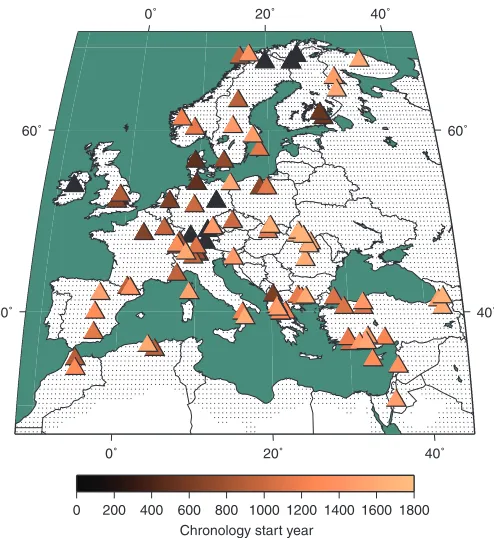
[image:2.594.41.288.378.647.2]0 200 400 600 800 1000 1200 1400 1600 1800 Chronology start year
Fig. 1. Map of the JJA scPDSI target field (small black grid points) and
the 106 chronology tree-ring network used for reconstruction.
There
are 5414 half-degree scPDSI grid points. The OWDA tree-ring network (filled
triangles shaded by start year) illustrates the reasonably uniform coverage of
chronologies across the domain, except for Russia.
on November 12, 2015
http://advances.sciencemag.org/
over central Europe relative to droughts that have occurred over the last
century (
21
). The OWDA map for 1540 (Fig. 2E) shows the widespread
occurrence of moderate to extreme droughts in central Europe, consistent
with reports (
18
,
19
), but not a worst-case event even among the examples
shown here.
The great European famine of 1315
–
1317: This is one of the most
famous historical catastrophes in late medieval European history, a
famine caused by a multiyear period of excessive wetness that made
food production nearly impossible (
22
). This pluvial actually began
in 1314, but the following year was considered the most catastrophic
year, when
“…
there was universal failure of crops in 1315 in most if not
all lands of Europe from the Pyrenees to Slavic regions, from Scotland
to Italy
”
(
22
). The 1315 OWDA map (Fig. 2F) corresponds well to this
pattern of excessive wetness and crop failure and also shows the drier
conditions in southern Italy,
“…
which escaped the great crisis that
raged north of the Alps
”
(
22
). The OWDA now provides strong
evi-dence for the hydroclimatic conditions over Europe that were
respon-sible for this catastrophe and shows its yearly progression from 1314
to 1317 in full detail (Supplementary Materials).
The spatial and temporal details of the OWDA reconstructions are a
marked improvement in our knowledge of changing moisture
condi-tions across the Old World during the Common Era (Supplementary
Materials). These few illustrations alone show that the OWDA now
provides a new basis for the study of pre- and postindustrial
hydro-climatic variabilities and their possible causes and consequences on
the Old World. The
“
Medieval Climate Anomaly
”
(MCA) (
23
) and
“
Little Ice Age
”
(LIA) (
24
) periods are particularly interesting, as well as
controversial, because of uncertainty over their conditions relative to the
modern period and the degree of spatial heterogeneity in preindustrial
climate (
25
). While debate about the exact characteristics of
tempera-ture variability during the MCA and LIA continues, hydroclimatic
con-ditions remain even more poorly quantified. The NADA made clear
that the MCA period in North America experienced severe and
pro-longed
“
megadroughts
”
(
26
,
27
), with additional paleoclimate evidence
for elevated aridity documented elsewhere in the Northern Hemisphere
(NH) (
28
). Across Europe, glaciers advanced during the LIA, testifying
to a generally cooler climate (
24
), but the hydroclimate signatures of the
MCA and LIA in the Old World have been poorly constrained. Here, we
use the OWDA for the first detailed comparison of the spatial patterns
of MCA and LIA hydroclimate across the Old World for the periods
1000
–
1200 and 1550
–
1750 CE, which fall within the generally accepted
time spans of the MCA and LIA (
23
,
24
). The specific period chosen
here for the MCA is also one in which a megadrought was previously
reconstructed to have occurred in southern Finland (
29
). The modern
period is defined as 1850
–
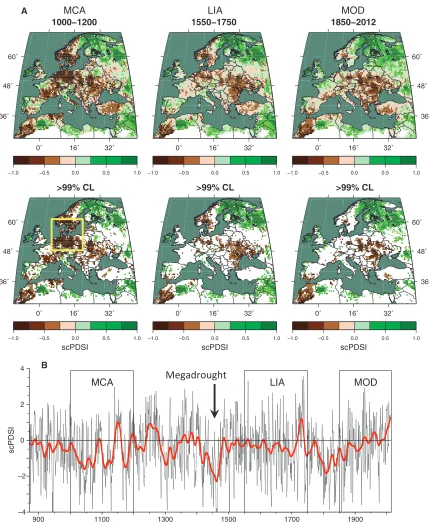
2012. For each epoch, composite maps of
re-constructed scPDSI (Fig. 3A) are shown for the full OWDA domain
(upper maps) as well as for just the statistically significant (
P
< 0.01)
regions of wetness and dryness (lower maps). The MCA period
ana-lyzed here is significantly drier over a larger portion of continental
north-central Europe and southern Scandinavia than either the LIA
0˚ 16˚ 32˚ 36˚
48˚ 60˚
0˚ 16˚ 32˚ 0˚ 16˚ 32˚
36˚ 48˚ 60˚
1921
1893
1741
0˚ 16˚ 32˚ 36˚
48˚ 60˚
0˚ 16˚ 32˚ 0˚ 16˚ 32˚
36˚ 48˚ 60˚
1616
1540
1315
A
B
C
D
E
F
[image:3.594.81.513.62.376.2]–6
–4
–2
0
2
4
6
–6
–4
–2
0
2
4
6
–6
–4
–2
0
2
4
6
Fig. 2. OWDA maps of known years of hydroclimatic extremes.
(
A
to
F
) The maps are presented in reverse chronological order based on documentary
climate records: from the best years recorded by instrumental climate records [1921 (A) and 1893 (B)] to the lesser known years [1741 (C), 1616 (D), 1540 (E),
and 1315 (F)]. See the text for details and refer to Supplementary Materials for more examples of historical droughts from documentary records.
on November 12, 2015
http://advances.sciencemag.org/
0˚ 16˚ 32˚ 36˚
48˚ 60˚
0˚ 16˚ 32˚ 0˚ 16˚ 32˚
0˚ 16˚ 32˚ 0˚ 16˚ 32˚ 0˚ 16˚ 32˚
36˚ 48˚ 60˚
−1.0 −0.5 0.0 0.5 1.0 −1.0 −0.5 0.0 0.5 1.0 −1.0 −0.5 0.0 0.5 1.0
−1.0 −0.5 0.0 0.5 1.0 −1.0 −0.5 0.0 0.5 1.0 −1.0 −0.5 0.0 0.5 1.0
36˚ 48˚
60˚
36˚ 48˚ 60˚
1000−1200
1550−1750
1850−2012
>99% CL
>99% CL
>99% CL
MCA
LIA
MOD
–4 –2 0 2 4
900 1100 1300 1500 1700 1900
scPDSI
Year
MCA
LIA
MOD
B
A
[image:4.594.82.511.113.637.2]scPDSI
scPDSI
scPDSI
Fig. 3. Comparison of mean scPDSI fields in the OWDA during periods associated with the MCA, LIA, and modern period (MOD).
(
A
) The mean fields
were calculated over the time intervals indicated, and the areas in those fields with significant mean anomalies of wetness or dryness (
p
< 0.01, two-tailed,
corrected for lag
−
1 autocorrelation) are indicated in the middle set of maps. The area of maximum dryness during the MCA period is indicated by the yellow
rectangle in the lower MCA map. (
B
) Average of OWDA reconstructions from within this rectangle. It confirms the drier conditions during the MCA period and
also shows the occurrence of an extraordinary megadrought in the mid-15th century. CL, confidence level.
on November 12, 2015
http://advances.sciencemag.org/
or modern period, considerably adding to the previous report of an
MCA megadrought in southern Finland (
29
), and it now more
com-pletely defines the spatial pattern and extent of dryness during that time.
In contrast, the Romania and Ukraine regions of eastern Europe have
more similar patterns of dryness, and northern Fennoscandia and Russia
have more similar patterns of wetness, in all three epochs. Notably, the
overall timing of MCA dryness in north-central Europe is consistent
with that described for large areas of North America (
26
,
27
) (see later
discussion).
A summary of the history of drought and wetness since 870 CE in
the core region of Old World MCA drought (Fig. 3A, yellow rectangle)
is presented in Fig. 3B. The overall mean ± 1
s
error is
−
0.44 ± 0.04 scPDSI
units from the expected mean of zero for the 1928
–
1978 calibration
period, which reflects the general tendency for drier conditions in the
preindustrial past. In contrast, the most recent period (1998
–
2012) has
been anomalously wet (+0.97 ± 0.24). It is necessary to go back to 1721
–
1739 to find a wetter period of comparable duration (+1.55 ± 0.24). As a
relative index of drought, scPDSI has a high degree of spatial
compara-bility across a broad range of precipitation climatologies (
30
). This allows
us to compare this drought to another reconstructed medieval
mega-drought occurring at around the same time in western North America
(
26
). The 1000
–
1200 CE megadrought over north-central Europe has a
reconstructed mean of
−
0.72 ± 0.10 scPDSI units. By comparison, the
worst megadrought in the California and Nevada regions of the NADA
(
26
) lasted from 832 to 1074 CE (
−
0.84 ± 0.09, calculated after adjusting
the mean of the California/Nevada series to match that of the
north-central Europe series over their 870
–
2005 common interval). Thus, in
terms of relative dryness as modeled by the scPDSI, this MCA
mega-drought in the OWDA is comparable to one of the more exceptional
MCA megadroughts in the NADA.
Besides the MCA, Fig. 3B also reveals the occurrence of a mid
–
15th-century megadrought in north-central Europe. The most intense drought
phase lasted for 37 years from 1437 to 1473 CE (
−
1.84 ± 0.20), with only
two isolated years of positive scPDSI. The timing of this megadrought is
similar to that of the worst drought reconstructed to have occurred over
the past 1000 years in the southeastern United States (
27
). This suggests
the existence of some common hydroclimate forcing across the North
Atlantic, perhaps related to Atlantic Ocean sea surface temperature
variations and/or the North Atlantic Oscillation (
31
,
32
). Finally, a third
megadrought occurred from 1779 to 1827 (
−
1.34 ± 0.16). This period has
a subperiod of
“
major long-duration drought
”
(
33
) from 1798 to 1808
(
−
1.89 ± 0.38) in England and Wales identified from early instrumental
NADA
MADA
OWDA
Latitude
A NHDA regions
–4
–2
0
1000
1100
1200
1300
1400
1500
1600
1700
1800
1900
2000
2
4
Z
-scores
B NHDA averages
Years
Longitude
0˚
−150˚
−100˚
−50˚
0˚
50˚
100˚
150˚
20˚
[image:5.594.84.510.64.389.2]40˚
60˚
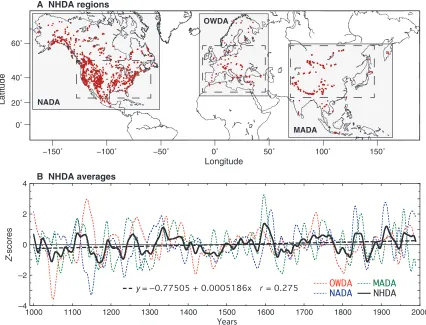
Fig. 4. The NHDA based on the OWDA, NADA, and MADA.
(
A
) The temperate latitude regions of drought atlases within the dashed boxes are
em-phasized for purposes of comparison because not all drought atlases have boreal (for example, MADA) or tropical (for example, OWDA) reconstructions.
(
B
) The original annually resolved drought reconstructions in each region were averaged from 1000 to 1989 CE, transformed into standard normal
de-viates (
Z
scores), and low pass
–
filtered to emphasize variability that was >30 years in duration. The low pass
–
filtered average series were renormalized
to eliminate any differential weighting by region and averaged to produce the NHDA records (not renormalized) shown in black.
on November 12, 2015
http://advances.sciencemag.org/
and historical climate information. It is also the driest period within the
longer epoch (1779
–
1827) of persistently drier-than-average conditions
over north-central Europe. More generally, Fig. 3B reveals the existence
of large-amplitude decadal to centennial hydroclimate variability over
Europe and shows that, like North America, megadroughts in the Old
World were not restricted to just the MCA period. In comparison,
hydro-climate variability over the 20th century, although large, does not
ap-pear unprecedented in amplitude or trend. Isolating signals of recent
GHG-induced hydroclimate change from this complex record of
natural variability will be challenging.
DISCUSSION
The OWDA greatly expands our understanding of the spatiotemporal
history of droughts and pluvials in the Old World. It confirms the
oc-currence of an MCA megadrought in north-central Europe, first noted
in southern Finland (
29
), which is similar in timing, duration, and
rel-ative intensity to that found in the NADA for the western United States
(
26
). This finding significantly adds to the realization that NH droughts
were more prolonged during the MCA compared to the 20th century,
with little understanding as to why. In addition, the example maps
illus-trate its considerable relevance to studies of hydroclimate impact on Old
World societies and cultures over the Common Era.
The OWDA is an important new advancement toward achieving a
full and consistent spatial coverage of hydroclimatic variability across
the NH land areas during the Common Era, one of the primary goals
of Kaufman and the PAGES 2k Consortium (
34
). Figure 4 shows
pro-gress toward the completion of a
“
Northern Hemisphere Drought Atlas
”
(NHDA) for the temperate latitude regions of the OWDA, NADA, and
MADA (Fig. 4A). This gives us an opportunity to compare hydroclimatic
variability between continents on a hemispheric basis back to the MCA
for the first time.
A first comparison, based on normalized averages of reconstructed
droughts smoothed to emphasize >30-year time scales of variability
(Fig. 4B), shows little commonality in the timing of wet and dry epochs
between drought atlas regions at the continental scale over the past
1000 years (average
r
= 0.05). However, there are several periods of
dis-tinct antiphasing between regions, especially between the NADA and
the MADA, which nonetheless suggests some dynamical links between
them. The NHDA average has also shown a long-term positive trend
from drier to wetter conditions over the temperate latitudes of the NH
since the MCA. The addition of the OWDA to the NADA and MADA
thus allows for more complete investigations of atmosphere-ocean
dynamical influences on the hemispheric patterns of hydroclimate
variability over the Common Era. The use of multiple climate field
recon-structions (spatially and fully data-independent) represented by the
OWDA, NADA, and MADA should better constrain the modes of
cli-mate variability responsible and greatly improve our understanding of
the causes of hydroclimatic variability at interannual to centennial time
scales. Furthermore, completion of the OWDA, together with available
simulations of the last millennium, now allows us to determine whether
state-of-the-art climate models in the NH contain realistic hydroclimate
variability at interannual to centennial time scales [see Smerdon
et al
.
(
35
) for a North American example]. This knowledge is essential to
assessing whether models can correctly represent the range of future
hydroclimates, including wet and dry extremes, that combine forced
change with continued natural variability.
MATERIALS AND METHODS
The scPDSI data used for reconstruction (
11
) are based on gridded
Climatic Research Unit Time Series (CRU TS) monthly temperature
and precipitation data (
36
) updated to version CRU TS 3.21 and
cover-ing the period 1901
–
2012. We examined the changing density of
pre-cipitation stations available for interpolation onto the CRU TS 3.21
precipitation grid before 1950 and found it to be stable back in time over
most of the OWDA domain (Supplementary Materials). The greatest
exception was found in Turkey and the Middle East, where little local
precipitation station data were available before 1930 for interpolation to
the half-degree grid. This is not desirable for evaluating reconstruction
skills in those regions over the 1901
–
1927 regression model validation
period. However, it is unlikely to adversely affect the tree-ring
reconstruc-tions themselves because the 1928
–
1978 calibration period used to
produce the reconstructions barely overlaps with the period of reduced
local precipitation data coverage. The correlation decay length (CDL) of
the scPDSI field was also evaluated and found to be ~800 km, on
av-erage, but with considerable latitudinal variability. This information was
useful for objectively defining the search radius used to find tree-ring
chronologies for reconstruction of past droughts (see later discussion
and Supplementary Materials for details).
The tree-ring data used to produce the OWDA came from the
In-ternational Tree-Ring Data Bank and from contributions by European
dendrochronologists, including a large quantity from the
dendroarch-aeology community. Incorporating archaeological tree-ring data into the
tree-ring network, after updating with modern tree-ring data from
appro-priate younger living trees (
37
), enabled the reconstructions to be
extended back a millennium or more over most of the OWDA domain.
The resulting tree-ring chronologies were developed for climate
recon-struction using the newest
“
signal-free
”
methods of tree-ring
standardiza-tion (
38
,
39
), with emphasis on preserving long-term variability due to
climate. Because of considerable variation in the segment lengths of the
archaeological tree-ring series in each of those tree-ring data sets and the
associated difficulty in preserving long-term climate variability because of
“
segment length curse
”
(
40
), a modified signal-free regional curve
stan-dardization (SF-RCS) (
39
) method was devised and used (see
Supple-mentary Materials for a detailed description of how RCS was performed).
The climate field reconstruction method used to produce the OWDA
is the point-by-point regression (PPR) method (
41
), with an extension
of the procedure producing ensembles of climate reconstructions (
12
,
42
).
The OWDA reconstruction presented here is the mean of eight
ensem-ble members, with each member being based on the weighting of each
tree-ring chronology used in PPR by some power of its correlation with
scPDSI (
42
). The initial search radius used by PPR to locate tree-ring
chronologies for reconstructing scPDSI at each grid point was set to
1000 km, a small enlargement over the estimated CDL (800 km) of
the instrumental scPDSI data to account for some of the irregular spacings
of the tree-ring chronology network shown in Fig. 1.
A value-added outcome of PPR was the ability to evaluate the climate
sensitivity of the tree-ring chronologies used for scPDSI reconstruction.
This evaluation, performed through a simple correlation analysis,
conclu-sively demonstrated the overall moisture sensitivity of the tree-ring
chronologies over most of the OWDA domain, a result that is highly
consistent with an independent evaluation of the climate response of
tree-ring chronologies in Europe (
43
). At high elevations in central
Eu-rope and at high northern latitudes in Fennoscandia, the level of
mois-ture sensitivity does diminish and is increasingly replaced by sensitivity
on November 12, 2015
http://advances.sciencemag.org/
to growing-season temperatures. This change in climate sensitivity has
also been described by Babst
et al
. (
43
). The successful reconstruction of
droughts in Fennoscandia, using a mixture of moisture- and
temperature-limited tree-ring records (
44
), indicates that this change in climate
sensi-tivity is not a serious issue (refer to Supplementary Materials for details).
SUPPLEMENTARY MATERIALS
Supplementary material for this article is available at http://advances.sciencemag.org/cgi/ content/full/1/10/e1500561/DC1
Introduction
OWDA as a scientific advancement over previous work Gridded monthly scPDSI target field
OWDA tree-ring network
Climate sensitivity of OWDA tree-ring chronologies Validation of OWDA tree-ring climate response
Augmenting tree-ring chronologies with historical tree-ring data Standardizing OWDA tree-ring data for climate reconstruction Standardizing OWDA historical/modern tree-ring data Estimating low- to medium-frequency variance retention Point-by-point regression
Comparisons with Pauling spring-summer precipitation reconstructions Additional validation tests of the OWDA
References
Table S1. List of tree-ring chronologies used for producing the OWDA.
Fig. S1. Map of the OWDA domain showing 5414 half-degree grid points of JJA scPDSI (small black dots) and the 106 annual chronology tree-ring network (red and blue triangles). Fig. S2. Maps, by decade (up to 1950), of the changing densities of precipitation stations (solid red dots) available for interpolation on the half-degree regular grid used to produce the CRU TS precipitation field (http://badc.nerc.ac.uk).
Fig. S3. Comparisons of calibration period (1928–1978) and validation period (1901–1927) scPDSI averages and their variances.
Fig. S4. Statistical properties of gridded summer scPDSI data over the 1928–1978 calibration period and tests of normality using a simple and robust test of normality based on joint use of skewness and kurtosis (69).
Fig. S5. CDL between 5414 grid points of summer scPDSI used for reconstruction over the OWDA domain.
Fig. S6. Summary maps of correlations between summer scPDSI and the tree-ring network over the 5414 grid points of the OWDA domain calculated for the 1928–1978 calibration period, using the PPR program in the same way that it was used to produce the OWDA reconstructions. Fig. S7. Example of a historical/modern tree-ring chronology from northeastern France developed by the iterative procedure described in the text.
Fig. S8. Overlay plots of Tornetrask power spectra (frequencies from 0 to 0.1) for different detrending options before (RCS/SSD) and after (SF-RCS/SSD) the application of the signal-free method to the data using the same curve-fitting options: Opt 0—RCS detrending (designed to preserve the most low- to medium-frequency variance); Opt 1—negative exponential/linear detrending (monotonic nonincreasing, least flexible SSD option); Opt 2—cubic smoothing spline detrending based on the median segment length of the data (moderately data-adaptive, fixed intermediate flexibility); and Opt 3—the Friedman variable span smoother (locally adaptive, very flexible).
Fig. S9. Example of the two-stage SF-RCS method applied to the historical/modern Quercus species (QUSP) tree-ring data of northeastern France used as an example by Aueret al. (48).
Fig. S10. Additional low- to medium-frequency variance retained in the historical/modern tree-ring chronologies using the two-stage SF-RCS procedure.
Fig. S11. Calibration and validation statistical maps of the eight-member ensemble-average OWDA reconstructions.
Fig. S12. Correlations of OWDA JJA scPDSI reconstructions with Pauling spring-summer precipitation reconstructions primarily reconstructed from long instrumental and historical climate indices (18). Fig. S13. Comparison of OWDA and Pauling maps for 1540 (“year-long unprecedented European heat and drought”) (21).
Fig. S14. Maps of exceptional droughts in Czech lands (20). Fig. S15. Maps of the great European famine (22).
Fig. S16. OWDA mean and median maps for nine noteworthy 17th-century droughts over England and Wales: 1634, 1635, 1636, 1666, 1667, 1684, 1685, 1694, and 1695 (33). Fig. S17. OWDA mean and median maps for eight noteworthy Ottoman Empire droughts: 1570, 1591, 1592, 1594, 1595, 1607, 1608, and 1610 (107).
Fig. S18. OWDA mean and median maps for 12 noteworthy pre-1450 historical droughts in England and Wales: 1084, 1129, 1136, 1222, 1242, 1252, 1263, 1272, 1284, 1288, 1305, and 1385 (110). References (45–110)
REFERENCES AND NOTES
1. C. M. Philandras, P. T. Nastos, J. Kapsomenakis, K. C. Douvis, G. Tselioudis, C. S. Zerefos, Long term precipitation trends and variability within the Mediterranean region.Nat. Hazards Earth Syst. Sci.11, 3235–3250 (2011).
2. B. Kirtman, S. B. Power, J. A. Adedoyin, G. J. Boer, R. Bojariu, I. Camilloni, F. J. Doblas-Reyes, A. M. Fiore, M. Kimoto, G. A. Meehl, M. Prather, A. Sarr, C. Schär, R. Sutton, G. J. van Oldenborgh, G. Vecchi, H. J. Wan, Near-term climate change: Projections and predictability, inClimate Change 2013: The Physical Science Basis. Contribution of Working Group I to the Fifth Assessment Report of the Intergovernmental Panel on Climate Change, T. F. Stocker, D. Qin, G.-K. Plattner, M. M. B. Tignor, S. K. Allen, J. Boschung, A. Nauels, Y. Xia, V. Bex, P.M. Midgley, Eds. (Cam-bridge Univ. Press, Cam(Cam-bridge, UK, 2013).
3. R. Seager, H. Liu, N. Henderson, I. Simpson, C. Kelley, T. Shaw, Y. Kushnir, M. Ting, Causes of increasing aridification of the Mediterranean region in response to rising greenhouse gases.J. Climate27, 4655–4676 (2014).
4. C. Kelley, M. Ting, R. Seager, Y. Kushnir, The relative contributions of radiative forcing and internal climate variability to the late 20th century winter drying of the Mediterranean region.Clim. Dyn.38, 2001–2015 (2011).
5. M. Hoerling, J. Eischeid, J. Perlwitz, X. Quan, T. Zhang, P. Pegion, On the increased frequency of Mediterranean drought.J. Climate25, 2146–2161 (2012).
6. B. Orlowsky, S. I. Seneviratne, Elusive drought: Uncertainty in observed trends and short- and long-term CMIP5 projections.Hydrol. Earth Syst. Sci.17, 1765–1781 (2013).
7. P. Greve, B. Orlowsky, B. Mueller, J. Sheffield, M. Reichstein, S. I. Seneviratne, Global assess-ment of trends in wetting and drying over land.Nat. Geosci.7, 716–721 (2014). 8. E. R. Cook, C. A. Woodhouse, C. M. Eakin, D. M. Meko, D. W. Stahle, Long-term aridity
changes in the western United States.Science306, 1015–1018 (2004).
9. S. Coats, J. E. Smerdon, B. I. Cook, R. Seager, Are simulated megadroughts in the North American Southwest forced?J. Climate28, 124–142 (2015).
10. S. Coats, B. I. Cook, J. E. Smerdon, R. Seager, North American pancontinental droughts in model simulations of the last millennium.J. Climate28, 2025–2043 (2015).
11. G. van der Schrier, J. Barichivich, K. R. Briffa, P. D. Jones, A scPDSI-based global data set of dry and wet spells for 1901–2009.J. Geophys. Res.118, 4025–4048 (2013).
12. E. R. Cook, K. J. Anchukaitis, B. M. Buckley, R. D. D’Arrigo, G. C. Jacoby, W. E. Wright, Asian monsoon failure and megadrought during the last millennium.Science328, 486–489 (2010).
13. R. Brázdil, C. Pfister, H. Wanner, H. Von Storch, J. Luterbacher, Historical climatology in Europe—The state of the art.Clim. Change70, 363–430 (2005).
14. C. E. P. Brooks, J. Glasspoole, The drought of 1921.Q. J. Roy. Meteorol. Soc.48, 139–168 (1922).
15. L. C. W. Bonacina, The European drought of 1921.Nature112, 488–489 (1923). 16. F. J. Brodie, The great drought of 1893 and its attendant meteorological phenomena.Q. J.
Roy. Meteorol. Soc.20, 1–30 (1894).
17. S. Engler, F. Mauelshagen, J. Werner, J. Luterbacher, The Irish famine of 1740–1741: Fam-ine vulnerability and“climate migration”.Clim. Past9, 1161–1179 (2013).
18. A. Pauling, J. Luterbacher, C. Casty, H. Wanner, Five hundred years of gridded high-resolution precipitation reconstructions over Europe and the connection to large-scale circulation.Clim. Dyn.26, 387–405 (2006).
19. P. D. Jones, K. R. Briffa, Unusual climate in northwest Europe during the period 1730 to 1745 based on instrumental and documentary data.Clim. Change79, 361–379 (2006).
20. R. Brázdil, P. Dobrovolný, M. Trnka, O. Kotyza, L.Řezníčková, H. Valášek, P. Zahradníček, P.Štěpánek, Droughts in the Czech Lands, 1090–2012 AD.Clim. Past9, 1985–2002 (2013). 21. O. Wetter, C. Pfister, J. P. Werner, E. Zorita, S. Wagner, S. I. Seneviratne, J. Herget, U. Grünewald, J. Luterbacher, M.-J. Alcoforado, M. Barriendos, U. Bieber, R. Brázdil, K. H. Burmeister, C. Camenisch, A. Contino, P. Dobrovolný, R. Glaser, I. Himmelsbach, A. Kiss, O. Kotyza, T. Labbé, D. Limanówka, L. Litzenburger, Ø. Nordl, K. Pribyl, D. Retsö, D. Riemann, C. Rohr, W. Siegfried, J. Söderberg, J.-L. Spring, The year-long unprecedented European heat and drought of 1540—A worst case.Clim. Change125, 349–363 (2014).
22. H. S. Lucas, The great European famine of 1315, 1316, and 1317.Speculum5, 343–377 (1930). 23. H. F. Diaz, R. Trigo, M. K. Hughes, M. E. Mann, E. Xoplaki, D. Barriopedro, Spatial and temporal characteristics of climate in medieval times revisited.Bull. Am. Meteorol. Soc.92, 1487–1500 (2011).
24. J. A. Matthews, K. R. Briffa, The‘Little Ice Age’: Re-evaluation of an evolving concept.Geogr. Ann.87 A, 17–36 (2005).
25. PAGES 2k Consortium, Continental-scale temperature variability during the past two millennia.Nat. Geosci.6, 339–346 (2013).
26. E. R. Cook, R. Seager, R. R. Heim Jr., R. S. Vose, C. Herweijer, C. Woodhouse, Megadroughts in North America: Placing IPCC projections of hydroclimatic change in a long-term paleoclimate context.J. Quat. Sci.25, 48–61 (2010).
27. B. I. Cook, J. E. Smerdon, R. Seager, E. R. Cook, Pan-continental droughts in North America over the last millennium.J. Climate27, 383–397 (2014).
on November 12, 2015
http://advances.sciencemag.org/
28. R. Seager, N. Graham, C. Herweijer, A. L. Gordon, Y. Kushnir, E. Cook, Blueprints for medieval hydroclimate.Quat. Sci. Rev.26, 2322–2336 (2007).
29. S. Helama, J. Meriläinen, H. Tuomenvirta, Multicentennial megadrought in northern Europe coincided with a global El Niño–Southern Oscillation drought pattern during the Medieval Climate Anomaly.Geology37, 175–178 (2009).
30. N. Wells, S. Goddard, M. J. Hayes, A self-calibrating Palmer Drought Severity Index.J. Climate 17, 2335–2351 (2004).
31. S. Feng, Q. Hu, R. J. Oglesby, Influence of Atlantic sea surface temperatures on persistent drought in North America.Clim. Dyn.37, 569–586 (2011).
32. R. Oglesby, S. Feng, Q. Hu, C. Rowe, The role of the Atlantic Multidecadal Oscillation on medieval drought in North America: Synthesizing results from proxy data and climate models.Glob. Planet. Change84–85, 56–65 (2012).
33. G. A. Cole, T. J. Marsh, The impact of climate change on severe droughts. Major droughts in England and Wales from 1800 and evidence of impact, inScience Report: SC040068/SR1 (Environment Agency, Bristol, UK, 2006).
34. D. S. Kaufman, PAGES 2k Consortium, A community-driven framework for climate recon-structions.Eos40, 361–362 (2014).
35. J. E. Smerdon, B. I. Cook, E. R. Cook, R. Seager, Bridging past and future climate across paleoclimatic reconstructions, observations, and models: A hydroclimate case study.J. Climate 28, 3212–3231 (2015).
36. I. Harris, P. D. Jones, T. J. Osborn, D. H. Lister, Updated high-resolution grids of monthly climatic observations—The CRU TS3.10 dataset.Int. J. Climatol.34, 623–642 (2014). 37. W. Tegel, J. Vanmoerkerke, U. Büntgen, Updating historical tree-ring records for climate
reconstruction.Quat. Sci. Rev.29, 1957–1959 (2010).
38. T. M. Melvin, K. R. Briffa, A“signal-free”approach to dendroclimatic standardisation. Dendrochronologia26, 71–86 (2008).
39. T. M. Melvin, K. R. Briffa, CRUST: Software for the implementation of Regional Chronology Standardisation: Part 1. Signal-Free RCS.Dendrochronologia32, 7–20 (2014). 40. E. R. Cook, K. R. Briffa, D. M. Meko, D. A. Graybill, G. Funkhouser, The‘segment length curse’in
long tree-ring chronology development for palaeoclimatic studies.Holocene5, 229–237 (1995). 41. E. R. Cook, D. M. Meko, D. W. Stahle, M. K. Cleaveland, Drought reconstructions for the
continental United States.J. Climate12, 1145–1162 (1999).
42. E. R. Cook, P. J. Krusic, K. J. Anchukaitis, B. M. Buckley, T. Nakatsuka, M. Sano, PAGES Asia2k Members, Tree-ring reconstructed summer temperature anomalies for temperate East Asia since 800 C.E.Clim. Dyn.41, 2957–2972 (2013).
43. F. Babst, B. Poulter, V. Trouet, K. Tan, B. Neuwirth, R. Wilson, M. Carrer, M. Grabner, W. Tegal, T. Levanic, M. Panayotov, C. Urbinati, O. Bouriaud, P. Ciais, D. Frank, Site- and species-specific responses of forest growth to climate across the European continent.Glob. Ecol. Biogeogr.22, 706–717 (2013).
44. K. Seftigen, J. Björklund, E. R. Cook, H. W. Linderholm, A tree-ring field reconstruction of Fennoscandian summer hydroclimate variability for the last millennium.Clim. Dyn.44, 3141–3154 (2014).
45. W. C. Palmer,Meteorological Drought, Tech. Rep. Weather Bureau Research Paper No. 45, US Department of Commerce, Washington DC (1965).
46. G. van der Schrier, K. R. Briffa, P. D. Jones, T. J. Osborn, Summer moisture variability across Europe.J. Clim.19, 2818–2834 (2006).
47. K. R. Briffa, P. D. Jones, M. Hulme, Summer moisture variability across Europe, 1892–1991: An analysis based on the Palmer Drought Severity Index.Int. J. Climatol.14, 475–506 (1994). 48. I. Auer, R. Böhm, A. Jurkovic, W. Lipa, A. Orlik, R. Potzmann, W. Schöner, M. Ungersböck, C. Matulla, K. Briffa, P. Jones, D. Efthymiadis, M. Brunetti, T. Nanni, M. Maugeri, L. Mercalli, O. Mestre, J.-M. Moisselin, M. Begert, G. Müller-Westermeier, V. Kveton, O. Bochnicek, P. Stastny, M. Lapin, S. Szalai, T. Szentimrey, T. Cegnar, M. Dolinar, M. Gajic-Capka, K. Zaninovic, Z. Majstorovic, E. Nieplova, HISTALP–historical instrumental climatological surface time series of the Greater Alpine Region.Int. J. Climatol.27, 17–46 (2007).
49. K. R. Briffa, G. van der Schrier, P. D. Jones, Wet and dry summers in Europe since 1750: Evidence of increasing drought.Int. J. Climatol.29, 1894–1905 (2009).
50. R. Brázdil, P. Dobrovolný, J. Luterbacher, A. Moberg, C. Pfister, D. Wheeler, E. Zorita, European climate of the past 500 years: New challenges for historical climatology.Clim. Change101, 7–40 (2010).
51. R. Touchan, D. Meko, M. K. Hughes, A 396-year reconstruction of precipitation in Southern Jordan.J. Amer. Water Res. Assoc.35, 45–55 (1999).
52. R. Touchan, G. Funkhouser, M. K. Hughes, N. Erkan, Standardized precipitation index re-construction from Turkish tree-ring widths.Clim. Change72, 339–353 (2005). 53. R. J. S. Wilson, B. H. Luckman, J. Esper, A 500-year dendroclimatic reconstruction of
spring-summer precipitation from the lower Bavarian forest region, Germany.Int. J. Climatol.25, 611–630 (2005).
54. J. Esper, D. Frank, U. Büntgen, A. Verstege, J. Luterbacher, E. Xoplaki, Long-term drought severity variations in Morocco.Geophys. Res. Lett.34, L17702 (2007).
55. C. B. Griggs, A. DeGaetano, P. Kuniholm, M. Newton, A regional high-frequency recon-struction of May-June precipitation in the north Aegean from oak tree-rings, AD 1089-1989. Int. J. Climatol.27, 1075–1089 (2007).
56. K.Čufar, M. De Luis, D. Eckstein, L. Kajfež-Bogataj, Reconstructing dry and wet summers in SE Slovenia from oak tree-ring series.Int J. Biometeorol.52, 607–615 (2008). 57. R. Touchan, K. J. Anchukaitis, D. M. Meko, S. Attalah, C. Baisan, A. Aloui, Long term context
for recent drought in northwestern Africa.Geophys. Res. Lett.35, L13705 (2008). 58. U. Büntgen, V. Troueta, D. Franka, H. H. Leuschnerc, D. Friedrichsd, J. Luterbachere, J. Esperf,
Tree-ring indicator of German summer drought over the last millennium.Quat. Sci. Rev.29, 1005–1016 (2010).
59. R. J. Cooper, T. M. Melvin, I. Tyers, R. J. S. Wilson, K. R. Briffa, A tree-ring reconstruction of East Anglian (UK) hydroclimate variability over the last millennium.Clim. Dyn.40, 1019–1039 (2013).
60. R. Wilson, D. Miles, N. J. Loader, T. Melvin, I. Tyers, R. Cooper, K. R. Briffa, A millennial long March-July precipitation reconstruction for southern-central England.Clim. Dyn.40, 997–1017 (2013).
61. N. Köse, Ü. Akkemik, H. T. Güner, H. N. Dalfes, H. D. Grissino-Mayer, M. S. Özeren, T. Kındap, An improved reconstruction of May–June precipitation using tree-ring data from western Turkey and its links to volcanic eruptions.Int. J. Biometeorol.57, 691–701 (2013).
62. S. Klesse, M. Ziehmer, G. Rousakis, V. Trouet, D. Frank, Synoptic drivers of 400 years of summer temperature and precipitation variability on Mt. Olympus, Greece.Clim. Dyn.45, 807–824 (2015).
63. A. Nicault, S. Alleaume, S. Brewer, M. Carrer, P. Nola, J. Guiot, Mediterranean drought fluctuation during the last 500 years based on tree-ring data.Clim. Dyn.31, 227–245 (2008).
64. R. Touchan, K. J. Anchukaitis, D. M. Meko, M. Sabir, S. Attalah, A. Aloui, Spatiotemporal drought variability in northwestern Africa over the last nine centuries.Clim. Dyn.37, 237–252 (2010).
65. G. van der Schrier, P. D. Jones, K. R. Briffa, The sensitivity of the PDSI to the Thornthwaite and Penman Monteith parameterizations for potential evapotranspiration.J. Geophys. Res. 116, D03106 (2011).
66. K. E. Trenberth, A. Dai, G. van der Schrier, P. D. Jones, J. Barichivich, K. R. Briffa, J. Sheffield, Global warming and changes in drought.Nat. Clim. Chang.4, 17–22 (2014). 67. M. New, P. D. Jones, Representing twentieth century space–time climate variability. Part 2:
Development of 1901–96 monthly grids of terrestrial surface climate.J. Clim.13, 2217–2238 (2000).
68. L. H. Shoemaker, Fixing the F test for equal variances.Am. Stat.57, 105–114 (2003). 69. R. B. D’Agostino, A. Belangerb, R. B. D’Agostino Jr., A suggestion for using powerful and
informative tests of normality.Am. Stat.44, 316–321 (1990).
70. M. New, M. Hulme, P. Jones, Representing twentieth-century space–time climate variability. Part II: Development of 1901–96 monthly grids of terrestrial surface climate.J. Clim.13, 2217–2238 (2000).
71. T. D. Mitchell, P. D. Jones, An improved method of constructing a database of monthly climate observations and associated high-resolution grids.Int. J. Climatol.25, 693–712 (2005).
72. R. J. S. Wilson, J. Esperb, B. H. Luckman, Utilising historical tree-ring data for dendroclimatology: A case study from the Bavarian forest, Germany.Dendrochronologia21, 53–68 (2004). 73. K. Haneca, K.Čufarb, H. Beeckmanc, Oaks, tree-rings and wooden cultural heritage: A
review of the main characteristics and applications of oak dendrochronology in Europe. J. Archaeol. Sci.36, 1–11 (2009).
74. K. Nicolussi, M. Kaufmann, G. Patzelt, J. Plicht van der, A. Thurner, Holocene tree-line variability in the Kauner Valley, Central Eastern Alps, indicated by dendrochronological analysis of living trees and subfossil logs.Veget. Hist. Archaeobot.14, 221–234 (2005). 75. U. Büntgen, W. Tegel, K. Nicolussi, M. McCormick, D. Frank, V. Trouet, J. O. Kaplan, F. Herzig,
K.-U. Heussner, H. Wanner, J. Luterbacher, J. Esper, 2500 years of European climate variability and human susceptibility.Science331, 578–582 (2011).
76. A. M. García-Suáreza, C. J. Butler, M. G. L. Baillie, Climate signal in tree-ring chronologies in a temperate climate: A multi-species approach.Dendrochronologia27, 183–198 (2009). 77. N. Pederson, A. R. Bell, E. R. Cook, U. Lall, N. Devineni, R. Seager, K. Eggleston, K. P. Vranes,
Is an epic pluvial masking the water insecurity of the greater New York City region?J. Clim. 26, 1339–1354 (2013).
78. D. M. Meko,Applications of Box-Jenkins Methods of Time Series Analysis to the Reconstruc-tion of Drought from Tree Rings. Unpublished Ph.D. dissertaReconstruc-tion, The University of Arizona (1981).
79. J. Franke, D. Frank, C. C. Raible, J. Esper, S. Brönnimann, Spectral biases in tree-ring climate proxies.Nat. Clim. Chang.3, 360–364 (2013).
80. S. St. George, T. R. Ault, The imprint of climate within Northern Hemisphere trees.Quat. Sci. Rev.89, 1–4 (2014).
81. D. A. Friedrichs, V. Trouet, U. Büntgen, D. C. Frank, J. Esper, B. Neuwirth, J. Löffler, Species-specific climate sensitivity of tree growth in Central-West Germany.Trees–Structure and Function23, 729–739 (2009).
82. F. Babst, M. Carrer, B. Poulter, C. Urbinati, B. Neuwirth, D. Frank, 500 years of regional forest growth variability and links to climatic extreme events in Europe.Environ. Res. Lett. 7, 045705 (2012).
on November 12, 2015
http://advances.sciencemag.org/
83. J. Esper, U. Büntgen, M. Timonen, D. C. Frank , Variability and extremes of northern Scandinavian summer temperatures over the past two millennia.Glob. Plan. Change88-89, 1–9 (2012). 84. T. M. L. Wigley, K. R. Briffa, P. D. Jones, On the average value of correlated time series, with
applications in dendroclimatology and hydrometeorology.J. Clim. Appl. Met.23, 201–213 (1984). 85. R. L. Holmes, Computer-assisted quality control in tree ring dating and measurements.
Tree-Ring Bull.43, 69–78 (1983).
86. C. Nehrbass-Ahles, F. Babst, S. Klesse, M. Nötzli, O. Bouriaud, R. Neukom, M. Dobbertin, D. Frank, The influence of sampling design on tree-ring-based quantification of forest growth.Glob. Change Biol.20, 2867–2885 (2014).
87. M. G. L. Baillie, J. R. Pilcher, A simple cross-dating program for tree-ring research.Tree-Ring Bull.38, 35–43 (1973).
88. T. M. L. Wigley, P. D. Jones, K. R. Briffa, Cross-dating methods in dendrochronology.J. Archaeol. Sci.14, 51–64 (1987).
89. D. Frank, J. Esper, E. R. Cook, Adjustment for proxy number and coherence in a large-scale temperature reconstruction.Geophys. Res. Lett.34, L16709 (2007).
90. H. C. Fritts,Tree Rings and Climate(Academic Press, London, 1976), p. 567.
91. E. R. Cook, L. A. Kairiukstis, Eds.,Methods of Dendrochronology: Applications in the Environmental Sciences(Kluwer Academic Publishers, Dordrecht, 1990), p. 394. 92. E. R. Cook, K. Peters, The smoothing spline: A new approach to standardizing forest
in-terior tree-ring width series for dendroclimatic studies.Tree-Ring Bull.41, 45–53 (1981). 93. J. H. Friedman,“A variable span scatterplot smoother”Stanford University Technical Report No.
5(1984).
94. K. R. Briffa, P. D. Jones, T. S. Bartholin, D. Eckstein, F. H. Schweingruber, W. Karlén, P. Zetterberg, M. Eronen, Fennoscandian summers from A.D. 500: Temperature changes on short and long timescales.Clim. Dyn.7, 111–119 (1992).
95. K. R. Briffa, T. M. Melvin, A closer look at regional curve standardization of tree-ring re-cords: Justification of the need, a warning of some pitfalls, and suggested improvements in its application, inDendroclimatology,Developments in Paleoenvironmental Research 11, M. K. Hughes, T. W. Swetnam, H. F. Diaz, Eds. (Springer, Dordrecht, 2011), pp. 113–145. 96. T. M. Melvin, K. R. Briffa, CRUST: Software for the implementation of Regional Chronology Standardisation: Part 2 Further RCS options and recommendations.Dendrochronologia32, 343–356 (2014).
97. T. M. Melvin, K. R. Briffa, K. Nicolussi, M. Grabner, Time-varying-response smoothing. Dendrochronologia25, 65–69 (2007).
98. U. Büntgen, W. Tegel, K.-U. Heussner, J. Hofmann, R. Kontic, T. Kyncl, E. R. Cook, Effects of sample size in dendroclimatology.Clim. Res.53, 263–269 (2012).
99. T. M. Melvin, H. Grudd, K. R. Briffa, Potential bias in‘updating’tree-ring chronologies using regional curve standardisation: Re-processing 1500 years of Torneträsk density and ring-width data.Holocene23, 364–373 (2013).
100. P. M. Kelly, M. A. R. Munro, M. K. Hughes, C. M. Goodess, Climate and signature years in West European Oaks.Nature340, 57–60 (1989).
101. M. K. Hughes, P. I. Kuniholm, J. K. Eischeid, G. G. Garfin-Woll, C. B. Griggs, C. Latini, Aegean tree-ring signature years explained.Tree Ring Res.57, 67–73 (2001).
102. D. Meko, Dendroclimatic reconstruction with time varying predictor subsets of tree indices. J. Clim.10, 687–696 (1997).
103. E. R. Cook, R. D. D’Arrigo, M. E. Mann, A well-verified, multiproxy reconstruction of the winter North Atlantic oscillation index since AD 1400.J. Clim.15, 1754–1764 (2002). 104. D. M. Allen, The relationship between variable selection and data augmentation and a
method for prediction.Technometrics16, 125–127 (1974).
105. W. T. Bell, A. E. J. Ogilvie, Weather compilations as a source of data for the reconstruction of European climate during the medieval period.Clim. Chang.1, 331–348 (1978). 106. M. J. Ingram, D. J. Underhill, T. M. L. Wigley, Historical climatology.Nature276, 329–334 (1978). 107. S. A. White, Climate change and crisis in Ottomon Turkey and the Balkans, 1590-1710. In Proceedings of International Conference on Climate Change in the Middle East: Past, Present and Future, 20–23 November 2006, Istanbul Technical University, pp. 391–409.
108. R. Touchan, G. M. Garfin, D. M. Meko, G. Funkhouser, Nesat Erkan, M. K. Hughes, B. S. Wallin, Preliminary reconstructions of spring precipitation in southwestern Turkey from tree-ring width.Int. J. Climatol.23, 157–171 (2002).
109. R. Touchan, E. Xoplaki, G. Funkhouser, J. Luterbacher, M. K. Hughes, N. Erkan, Ü. Akkemik, J. Stephan, Reconstructions of spring/summer precipitation for the eastern Mediterranean from tree-ring widths and its connection to large-scale atmospheric circulation.Clim. Dyn. 25, 75–98 (2005).
110. C. E. Britton, A Meteorological Chronology to A.D. 1450,Geophysical Memoirs, no. 70 (H. M. Meteorological Office, London, 1937), p. 177.
Acknowledgments:Reviews of earlier drafts of this paper by K. Anchukaitis, M. Cane, B. Cook, J. Smerdon, and A. P. Williams improved its quality and are greatly appreciated.Funding:We thank the National Oceanic and Atmospheric Administration Climate Change Data and Detec-tion Program for supporting this project (award NA10OAR4310123) and the NaDetec-tional Science Foundation Earth System History Program (awards 0075956 and ESH0317288), ATM GEO/ATM Pa-leoclimate Program (award 0758486), and award 1103314 for additional long-term support in developing this research in the Mediterranean region.Author contributions:E.R.C. was fully re-sponsible for data processing, statistical analysis, and production of the OWDA. G.v.d.S. provided the PDSI target field data. R.S. and Y.K. helped guide the development of the OWDA and worked on climate dynamics interpretation. W.T. and U.B. spearheaded the contribution of tree-ring data used in the OWDA. K.R.B., D.F., and P.J.K. contributed data and critically reviewed earlier drafts. The remain-ing coauthors contributed tree-rremain-ing data to the effort.Competing interests:The authors declare that they have no competing interests.Data and materials availability:All data needed to evaluate the conclusions in the paper are present in the paper and/or the Supplementary Materials. The OWDA reconstructions are archived with associated metadata (www.ncdc.noaa. gov/data-access/paleoclimatology-data/datasets/climate-reconstruction) for routine public access and use. A second public access site will be set up at the International Research Institute for Climate and Society/Lamont-Doherty Earth Observatory Climate Data Library (http://iridl.ldeo.columbia. edu). The OWDA was made possible through the tree-ring data (most of them unpublished) provided by the dendrochronological community, which is engaged in various aspects of Old World tree-ring research. The availability of dendroarchaeological data from Europe enabled the OWDA to be extended back over most of the Common Era, which would have been impossible to do otherwise, and the newly available gridded scPDSI data from the Royal Netherlands Mete-orological Institute (http://climexp.knmi.nl) provided the high-quality instrumental data for calibra-tion. Other tree-ring data came from the International Tree-Ring Data Bank (www.ncdc.noaa. gov/data-access/paleoclimatology-data/datasets/tree-ring), from A. Billamboz (Dendrolab Ar-chaeological Service, Baden-Württemberg, Germany), and from the archived tree-ring data contributed by K. Tyers and I. Tyers to the ADVANCE-10K project (http://hol.sagepub.com/con-tent/12/6/639.abstract). Additional data related to this paper may be requested from the authors. Lamont-Doherty Earth Observatory contribution number 7938.
Submitted 4 May 2015 Accepted 4 August 2015 Published 6 November 2015 10.1126/sciadv.1500561
Citation:E. R. Cook, R. Seager, Y. Kushnir, K. R. Briffa, U. Büntgen, D. Frank, P. J. Krusic, W. Tegel, G. van der Schrier, L. Andreu-Hayles, M. Baillie, C. Baittinger, N. Bleicher, N. Bonde, D. Brown, M. Carrer, R. Cooper, K.Čufar, C. Dittmar, J. Esper, C. Griggs, B. Gunnarson, B. Günther, E. Gutierrez, K. Haneca, S. Helama, F. Herzig, K.-U. Heussner, J. Hofmann, P. Janda, R. Kontic, N. Köse, T. Kyncl, T. Levanič, H. Linderholm, S. Manning, T. M. Melvin, D. Miles, B. Neuwirth, K. Nicolussi, P. Nola, M. Panayotov, I. Popa, A. Rothe, K. Seftigen, A. Seim, H. Svarva, M. Svoboda, T. Thun, M. Timonen, R. Touchan, V. Trotsiuk, V. Trouet, F. Walder, T. Ważny, R. Wilson, C. Zang, Old World megadroughts and pluvials during the Common Era.Sci. Adv.1, e1500561 (2015).
![Fig. 2. OWDA maps of known years of hydroclimatic extremes. (climate records: from the best years recorded by instrumental climate records [1921 (A) and 1893 (B)] to the lesser known years [1741 (C), 1616 (D), 1540 (E),A to F) The maps are presented in rev](https://thumb-us.123doks.com/thumbv2/123dok_us/8934276.392726/3.594.81.513.62.376/hydroclimatic-extremes-records-recorded-instrumental-climate-records-presented.webp)