SDSS-IV MaNGA: A SERENDIPITOUS OBSERVATION OF A POTENTIAL GAS ACCRETION EVENT
Edmond Cheung1, David V. Stark1, Song Huang1, Kate H. R. Rubin2, Lihwai Lin3, Christy Tremonti4, Kai Zhang5, Renbin Yan5, Dmitry Bizyaev6,7, Médéric Boquien8, Joel R. Brownstein9, Niv Drory10, Joseph D. Gelfand11,12, Johan H. Knapen13,14, Roberto Maiolino15,16, Olena Malanushenko6, Karen L. Masters17, Michael R. Merrifield18,
Zach Pace4, Kaike Pan6, Rogemar A. Riffel19,20, Alexandre Roman-Lopes21, Wiphu Rujopakarn1,22, Donald P. Schneider23,24, John P. Stott25, Daniel Thomas17, and Anne-Marie Weijmans26 1
Kavli Institute for the Physics and Mathematics of the Universe(WPI), The University of Tokyo Institutes for Advanced Study, The University of Tokyo, Kashiwa, Chiba 277-8583, Japan;ec2250@gmail.com
2
Harvard-Smithsonian Center for Astrophysics, 60 Garden Street, Cambridge, MA 02138, USA 3
Institute of Astronomy and Astrophysics, Academia Sinica, Taipei 106, Taiwan 4
Department of Astronomy, University of Wisconsin–Madison, 475 North Charter Street, Madison, WI 53706, USA 5
Department of Physics and Astronomy, University of Kentucky, 505 Rose Street, Lexington, KY 40506-0055, USA 6
Apache Point Observatory and New Mexico State University, P.O. Box 59, Sunspot, NM, 88349-0059, USA 7
Sternberg Astronomical Institute, Moscow State University, Moscow, Russia 8
Unidad de Astronomía, Universidad de Antofagasta, Avenida Angamos 601, Antofagasta 1270300, Chile 9
Department of Physics and Astronomy, University of Utah, 115 S. 1400 E., Salt Lake City, UT 84112, USA 10
McDonald Observatory, Department of Astronomy, University of Texas at Austin, 1 University Station, Austin, TX 78712-0259, USA 11
NYU Abu Dhabi, P.O. Box 129188, Abu Dhabi, UAE 12
Center for Cosmology and Particle Physics, New York University, Meyer Hall of Physics, 4 Washington Place, New York, NY 10003, USA 13
Instituto de Astrofísica de Canarias, E-38205 La Laguna, Tenerife, Spain 14
Departamento de Astrofísica, Universidad de La Laguna, E-38205 La Laguna, Tenerife, Spain 15
Cavendish Laboratory, University of Cambridge, 19 J. J. Thomson Avenue, Cambridge CB3 0HE, UK 16
Kavli Institute for Cosmology, University of Cambridge, Madingley Road, Cambridge CB3 0HA, UK 17
Institute for Cosmology and Gravitation, University of Portsmouth, Dennis Sciama Building, Burnaby Road, Portsmouth PO1 3FX, UK 18
School of Physics and Astronomy, University of Nottingham, University Park, Nottingham, NG7 2RD, UK 19
Departamento de Física, Centro de Cien̂cias Naturais e Exatas, Universidade Federal de Santa Maria, 97105-900 Santa Maria, RS, Brazil 20
Laboratório Interinstitucional de e-Astronomia—LIneA, Rua Gal. José Cristino 77, Rio de Janeiro, RJ—20921-400, Brazil 21
Departamento de Física y Astronomía, Facultad de Ciencias, Universidad de La Serena, Cisternas 1200, La Serena, Chile 22
Department of Physics, Faculty of Science, Chulalongkorn University, 254 Phayathai Road, Pathumwan, Bangkok 10330, Thailand 23
Department of Astronomy and Astrophysics, The Pennsylvania State University, University Park, PA 16802, USA 24
Institute for Gravitation and the Cosmos, The Pennsylvania State University, University Park, PA 16802, USA 25
Sub-department of Astrophysics, Department of Physics, University of Oxford, Denys Wilkinson Building, Keble Road, Oxford OX1 3RH, UK 26
School of Physics and Astronomy, University of St Andrews, North Haugh, St Andrews, Fife KY16 9SS, UK
Received 2016 June 17; revised 2016 September 20; accepted 2016 September 30; published 2016 November 30
ABSTRACT
The nature of warm, ionized gas outside of galaxies may illuminate several key galaxy evolutionary processes. A serendipitous observation by the MaNGA survey has revealed a large, asymmetric Hα complex with no optical counterpart that extends ≈8″ (≈6.3 kpc) beyond the effective radius of a dusty, starbursting galaxy. This Hαextension is approximately three times the effective radius of the host galaxy and displays a tail-like morphology. We analyze its gas-phase metallicities, gaseous kinematics, and emission-line ratios and discuss whether this Hαextension could be diffuse ionized gas, a gas accretion event, or something else. We find that this warm, ionized gas structure is most consistent with gas accretion through recycled wind material, which could be an important process that regulates the low-mass end of the galaxy stellar mass function.
Key words:galaxies: abundances– galaxies: evolution– galaxies: formation– galaxies: starburst
1. INTRODUCTION
Understanding the warm, ionized gas outside of galaxies is a critical aspect of galaxy evolution. To study this gas, there have been two main probes:(1)observations of extraplanar ionized gas in edge-on galaxies (e.g., Rand et al. 1990; Tüllmann et al.2000; Otte et al.2001; Miller & Veilleux2003; Rossa & Dettmar 2003) and (2) low-ionization metal-line absorption studies using quasar sightlines (e.g., Tumlinson et al. 2011; Werk et al.2013,2014).
These studies have led to the discovery of diffuse ionized gas
(DIG; Hoyle & Ellis1963; Reynolds1985), which is a layer of warm, low-density ionized gas that extends out to several kiloparsecs into the halos of galaxies, and the confirmation of the circumgalactic medium (CGM; Bergeron 1986; Lanzetta et al.1995), which is a gas reservoir containing warm, ionized
gas that is of even lower density than the DIG and extends hundreds of kiloparsecs into the halos of galaxies. But how this gas relates to the evolution of their host galaxies is an open question.
In this work, we further our understanding of warm, ionized gas in the halos of galaxies by studying a rare and unusual gas complex in the SDSS-IV MaNGA survey
(Bundy et al. 2015). Designed to observe galaxies out to a maximum radius of 2.5 effective radii (Re), the MaNGA survey has observed a dusty, starbursting27galaxy that is on the upper end of the mass–metallicity relationship(Tremonti et al.2004)out to 6.3Rethrough a fortuitous overestimation
© 2016. The American Astronomical Society. All rights reserved.
27
of Re.28 This galaxy shows no signs of interaction and
displays a large Hαextension with no optical counterpart in the Sloan Digital Sky Survey Data Release 7 (SDSS DR7; York et al. 2000; Abazajian et al.2009).
Throughout this work, we assume aflat cosmological model with H0=70 km s−1Mpc−1,Ωm=0.30, and ΩΛ=0.70.
2. DATA
The data used in this work are from the ongoing SDSS-IV MaNGA survey (Bundy et al. 2015; Drory et al. 2015; Law et al.2015; SDSS Collaboration et al.2016; Yan et al. 2016), which is an integral field unit (IFU) survey that is taking resolved spectroscopy of 10,000 nearby galaxies with logM*/ Me9. The survey uses the SDSS 2.5 m telescope (Gunn et al.2006)and BOSS spectrographs(Smee et al.2013); pilot studies using P-MaNGA data include Li et al. (2015), Wilkinson et al.(2015), and Belfiore et al.(2015). Ther-band signal-to-noise ratio (S/N)in the galaxy outskirts is 4–8Å−1, and the wavelength coverage is 3600–10000Å. The effective spatial resolution is 2 5(FWHM), with an instrumental resolution of σ≈60 km s−1 and a spectral resolution of
R∼2000.
The MaNGA sample and data products were drawn from the internal MaNGA Product Launch-4 (MPL-4), which contains 1368 galaxies. Ancillary data are from the MPA-JHU DR7 value-added catalog29 and the NASA-Sloan Atlas.30
The stellar masses from the MPA-JHU DR7 value-added catalog are estimated by fitting a large grid of stellar population models from Bruzual & Charlot (2003) to the
ugriz SDSS photometry, following the philosophy of Kauffmann et al. (2003) and Salim et al. (2007). The fiber star formation rates from the MPA-JHU DR7 value-added catalog are estimated using the technique described in Brinchmann et al. (2004), where galaxies with emission lines are fitted with the models of Charlot & Longhetti
(2001). The fiber star formation rate surface density is calculated over the 3″diameter SDSSfiber.
The stellar continuum of each spaxel is fit by the MaNGA Data Analysis Pipeline (DAP; K. Westfall et al. 2016, in preparation), which usespPXF(Cappellari & Emsellem2004)
and the MIUSCAT stellar population models (Vazdekis et al. 2012). Although the MIUSCAT templates are built to reflect simple stellar populations, the mix of templates used to construct the best-fit stellar continuum does not represent a physically motivated stellar population.
Emission-line fluxes are measured through simple fl ux-summing after subtraction of the stellar continuum(where there is stellar continuum). The wavelength passbands over which they are integrated are similar to that of Yan et al. (2006), ranging from 10to 20Åaround the central wavelength. For spectra that do not have measured stellar continua, we subtract a baseline continuum that is based on a linearfit to the red and blue sidebands; these sidebands extend approximately 100Åbeyond the central passbands and have been chosen to avoid other strong emission lines.
We adopt the nonparametric quantities vpeak and W80 to
characterize the center(with respect to the systemic velocity of the host galaxy)and width(that contains 80% of theflux)of the Hαemission line(e.g., Harrison et al.2014). We only measure
vpeakand W80in spaxels where the Hα flux has S/N>5.
To estimate the gaseous metallicities, 12+log(O/H), we use the IZI code (Blanc et al. 2015), which estimates the ionization parameter and gaseous metallicity based on a Bayesian analysis of a model grid with a set of input line
fluxes; we used the Dopita et al. (2013) model grids, but we obtain similar results to those of Levesque et al. (2010). We provide [OII]λλ3727, 3729, Hβ, [OIII]λ5007, Hα, [NII]λ6583, and[SII]λλ6717, 6731; all provided linefluxes have S/N>3. Throughout this work, we correct for reddening using the Balmer decrement and the Fitzpatrick (1999)
extinction law. The typical uncertainties of these IZI metallicities are 0.1–0.3 dex.
We also estimate the gaseous metallicity using the [NII]/
[OII]calibration from Kewley & Dopita (2002), which is relatively insensitive to variations in ionization parameter and is least sensitive to DIG contamination (Zhang et al. 2016, submitted). We estimate the uncertainties by adding in quadrature the intrinsic scatter of this calibration (0.04 dex; see Kewley & Dopita 2002) and the measurement error of log[NII]/[OII]propagated through the calibration, resulting in typical uncertainties of 0.05–0.15 dex.
3. RESULTS
Our main result is presented in Figure1. The SDSSgricolor image of the system is shown in Figure1(a), with the MaNGA footprint outlined by the magenta hexagon. Figure 1(b) displays the Hα flux map of this system, with the Hα flux contours in light gray. There is a large extension in the Hαflux distribution that extends ≈8″ (≈6.3 kpc) to the left (east) beyond the effective radius of the host galaxy and does not correspond to any optical source in SDSS. This striking feature is elucidated in Figure 1(c), where we present the Hα flux contours superimposed on the SDSS r-band image, with the blue circle marking theReof the host galaxy.
Figures 1(d) and (e) show the spectra centered on the Hα emission line of the highlighted spaxels in the Hα complex
(which is 6 67 away from the center)and in the center of the host galaxy, respectively. Both spectra possess strong emission from the[NII]doublet, Hα, and the[SII]doublet, confirming the authenticity of this Hα extension and indicating the presence of ionized gas throughout the entire system. Stacking all the spectra within the green circle centered in the Hα extension of Figure 1(b)—which we will refer to as the “Hα circle”—does not reveal a significant continuum. Properties of the host galaxy are listed in Table1.
Figure2 presents the gaseous metallicities, 12+log(O/H), of this system using IZI (Figure 2(a)) and the [NII]/[OII]
calibration (Figure 2(b)), with the Hα flux contours overlaid and the same spaxels from Figure 1(b)highlighted in white. Using the estimates of IZI(the [NII]/[OII] calibration), the stacked 12+log(O/H)value in a 1 5 circle centered on the host galaxy is 9.06±0.06(8.92±0.02), whereas the stacked 12+log(O/H) value in the Hα circle is 8.81±0.05
(8.77±0.03)—0.25(0.15)dex less than the center of the host galaxy at greater than 99.7% confidence. Comparing these gaseous metallicities to the solar value (12+log(O/ H)e=8.69; Asplund et al. 2009) reveals that the entire 28
MaNGA uses Re measurements from the NASA-Sloan Atlas, which estimatedRe=7 4 for this galaxy. After masking out the bright, nearby stars, we used GALFIT(Peng et al.2002)tofit a single Sérsic model to this galaxy, yieldingRe=2 6; see Section2
29
http://www.mpa-garching.mpg.de/SDSS/DR7/ 30
http://www.nsatlas.org
system has supersolar gaseous metallicities (but see Kennicutt et al.2003for caveats associated with strong-line abundances). Figures 2(c) and (d) display the 12+log(O/H) profile as traced by the highlighted spaxels in Figures2(a)and(b), with the characteristic metallicity profile of noninteracting disks from Sánchez et al.(2014)overplotted in the dashed line(with an arbitrary zero point). Out to∼2Re, the metallicity profiles of
this system are similar to that of Sánchez et al. (2014). At
2Re, however, there appears to be a break that corresponds to
the location of the Hα extension.
The estimated metallicity profile of this system, however, is highly uncertain, as indicated by the large error bars fromIZI, which, unlike the [NII]/[OII] calibration, considers multiple strong emission lines (see Section 2). These large error bars from IZI likely reflect the contrasting diagnostic line ratios, which may be due to the blending of physically different emission regions caused by insufficient spatial resolution.
Another source of uncertainty is the DIG contribution to the emission-line ratios, which could produce artificial metallicity gradients, especially in the outskirts of the system (K. Zhang et al. 2016, in preparation). While we argue that DIG is not the
major component of this system in Section4.1, we cannot rule out minor DIG contributions that could affect the estimated metallicity gradients of this system.
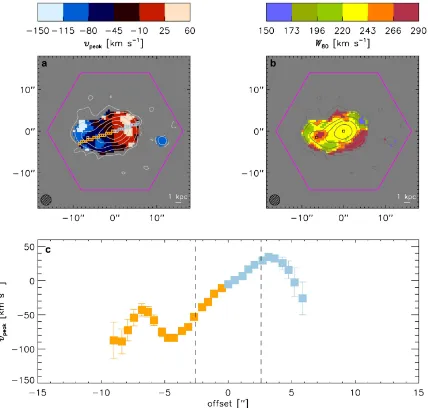
The ionized gas kinematics of this system is presented in Figure3, withvpeakdisplayed in panel(a)andW80in panel(b);
again, we superimpose the Hαflux contours and highlight the two spaxels from Figure 1(b). Figure 3(a) reveals an asymmetric gradient that ranges fromvpeak≈−140 km s−1at
the Hαextension to vpeak≈40 km s−1at the right side of the
host galaxy. Figure 3(b) shows typical values of
W80≈230 km s− 1
, with areas of enhanced W80 in the Hα
extension and the outer envelope of the Hα flux distribution. The velocity profile of the highlighted spaxels in Figure3(a)is shown in Figure3(c), withReof the host galaxy marked by the
vertical dashed lines.∣vpeak∣rises smoothly out to±5″, where it starts to flatten. Beyond −5″, however, there is an irregular wiggle in vpeak that corresponds to boosted W80 in the Hα
extension.
[image:3.612.48.561.53.427.2]The[NII]and[SII]BPT(Baldwin et al.1981)diagrams for this system are presented in Figures4(a)and(b), respectively. We only consider spaxels with emission lines that have
>
S N 3and overlay curves from Kewley et al. (2006)that are used to separate different classes of galaxies. Figures 4(c) and (d) display the resolved [NII]and [SII]BPT diagrams, respectively, i.e., these maps color-code each spaxel according to its location in their respective BPT diagrams. We overplot the Hα flux contours and highlight the same two spaxels in Figure1(b). Figure4demonstrates that almost all spaxels have HIIline ratios.
4. DISCUSSION
In this section, we discuss the nature of the Hαextension.
4.1. Diffuse Ionized Gas
The presence of warm, ionized gas in the outskirts of galaxies has been commonly referred to as DIG (Hoyle & Ellis 1963; Reynolds 1985). The most pronounced character-istics of the DIG are the elevated[NII]/Hαand[SII]/Hαline ratios compared to HIIregions(e.g., Monnet1971; Rand et al.
1990; Rand 1997, 1998; Haffner et al. 1999; Tüllmann et al. 2000; Collins & Rand 2001; Otte et al. 2001, 2002; Hoopes & Walterbos 2003; Wood & Mathis 2004; Voges & Walterbos 2006; Rand et al. 2008; Haffner et al. 2009; Reynolds et al. 2012), which may be due to secondary ionization/heating sources (e.g., Reynolds & Cox 1992; Reynolds et al. 1999). Thus, comparing the line ratios of the Hα extension to that of HIIregions would constrain whether the Hα extension is DIG.
Ideally, we would identify individual HII regions in our system in order to conduct this comparison. However, the spatial resolution of the MaNGA data is too coarse—the FWHM is 2 5, which corresponds to ≈1.9 kpc atz=0.038
(the host galaxy’s redshift), which is more than an order of magnitude larger than typical HII regions (1–100 pc; Kenni-cutt1984; Hunt & Hirashita 2009). Therefore, every spaxel in our data contains contributions from both HIIregions and DIG. One way to constrain the DIG contribution of the Hα extension is by comparing its line ratios to that of the center of the host galaxy, where the Hαsurface brightness is the highest and the DIG contribution is the lowest(Ferguson et al.1996). However, since line ratios are also dependent on metallicity and ionization parameter(Dopita et al.2000,2013; Kewley & Dopita 2002; Kewley et al. 2006)—which are likely to be different at the center compared to the Hαextension—another way to constrain the DIG contribution is to compare the line ratios of the Hαextension to the line ratios of the surrounding regions.
We present this line ratio comparison in Figure5, all of the panels of which have been corrected for reddening according to Section 2. Figures 5(a)–(c) show the log line ratio maps of [NII]/Hα, [OIII]/Hα, and [SII]/Hα, and Figures 5(e)–(f) show the log line ratio maps of[OII]/Hα and[OIII]/Hβ; the white contours represent the Hα flux distribution. Figure5(d) displays the [NII]/Hα (filled circles), [OIII]/Hα (open triangles), and[SII]/Hα(asterisks)line ratio profiles as traced by the highlighted spaxels in Figures 5(a)–(c), while Figure 5(g) presents the [OII]/Hα (filled stars), [OIII]/Hβ
(open squares), and [SII]/[NII] (open diamonds) line ratio profiles as traced by the highlighted spaxels in Figures5(e)–(f); the black solid line represents the Hαsurface brightness profile over the same highlighted spaxels.
Figure 5 indicates a complicated situation. While Figures 5(d)and (g)show that [NII]/Hα generally decreases with more negative offsets from the center of the galaxy, i.e., toward the direction of the Hαextension, the[SII]/Hα,[OIII]/
Hα, [OII]/Hα, and [OIII]/Hβ generally increase along the same direction. These enhancing line ratios toward the Hα extension are consistent with DIG, but the decreasing [NII]/
Hα line ratio toward the Hα extension is not consistent with DIG (e.g., Hoopes & Walterbos 2003; Voges & Walter-bos 2006; Zhang et al. 2016, submitted). The latter trend is particularly striking since [NII]/Hα is sensitive to the temperature of the gas and has been used to infer that the DIG is about ∼2000 K hotter than HII regions—a defining characteristic of DIG(Haffner et al.1999; Madsen et al.2006; Haffner et al.2009; Reynolds et al.2012).
Figure5(d)also shows that the[NII]/Hαprofile displays a dip around an offset of−5″, which corresponds to the location of the Hα extension, while the [SII]/Hα profile and the Hα surface brightness profile display aflattening at the same spot. Since the regions surrounding the Hαextension should have a similar metallicity and ionization parameter, the fact that the Hαextension does not display enhanced[NII]/Hαand[SII]/
Hαcompared to its surrounding regions indicates that the Hα extension is not dominated by DIG. However, since the S/N is low at the outskirts, the comparison of the line ratios at the center of the Hαextension(at∼−5″)to those at the outermost regions is more uncertain.
Another defining characteristic of DIG is its low density
[image:4.612.46.568.76.119.2](∼10−3cm−3; e.g., Haffner et al.2009). Hence, another way to constrain the DIG contribution is to probe the gas density of the system with the [SII]λ6717/[SII]λ6731 line ratio ( Oster-brock & Ferland 2006). We present the [SII]λ6717/ [SII]λ6731 line ratio map in Figure 6(a) (with the Hα contours superimposed and the same spaxels from Figure1(b)
Table 1
Galaxy Properties
MaNGA-ID Plate-IFU R.A. Decl. za logM*b u−rc log SFRd logSSFRe Re f
Re n
g (J2000.0 deg) (J2000.0 deg) (Me) (Meyr−1) (Meyr−1kpc−2) (arcsec) (kpc)
1-113700 8618-12703 319.45182 11.66059 0.038 9.77 2.05 0.22 −0.37 2.6 2.0 3.7
Notes.
a
Spectroscopic redshift from NSA catalog. b
Galaxy stellar mass from MPA-JHU DR7 data release. c
Rest-frameu−rcolor from NSA catalog. d
Fiber star formation rate from MPA-JHU DR7 data release. e
Fiber star formation rate surface density using the MPA-JHU DR7 data release. f
Effective radius from GALFIT(Peng et al.2002). g
Galaxy Sérsic index from GALFIT(Peng et al.2002).
highlighted in white) and the histogram of the [SII]λ6717/ [SII]λ6731 line ratios for various regions in Figure6(b).
The [SII]λ6717/[SII]λ6731 line ratios of the Hα circle range from 1.0 to 1.6, which corresponds to electron densities,
ne, of 500 to <10cm−3, respectively (Proxauf et al. 2014).
Even though the leftmost edge of the Hαcircle shows electron densities that are less than 10cm−3, that a large area of the Hα extension contains dense gas with ne∼500cm−3 strongly
indicates that the Hαextension is not dominated by DIG.
4.2. Gas Accretion
Alternatively, the Hα extension could be a sign of gas accretion(Sancisi et al.2008; Rubin et al.2012; Bouché et al.
2013, 2016; Sánchez Almeida et al. 2014, 2015), which can manifest through a variety of ways, e.g., cold flows (the properties of this galaxy, logM* M=9.77 and z=0.038, suggest cold flows rather than hot flows; Kereš et al. 2005,
2009b; Dekel & Birnboim2006; Dekel et al. 2009; Danovich et al. 2015; Stewart et al. 2016), recycled wind material
(Shapiro & Field 1976; Bregman 1980; Fraternali & Binney 2008; Oppenheimer & Davé 2008; Kereš et al.
2009a; Oppenheimer et al. 2010; Hopkins et al. 2014), or a gas-rich low-surface-brightness (LSB) dwarf galaxy (e.g., Fischer et al.2015; Leaman et al.2015).
The supersolar gaseous metallicities of this Hα extension
(see Figure 2), however, are inconsistent with gas accretion through coldflows from the intergalactic medium(IGM)since this type of accreting gas is expected to be very metal-poor
(Davé et al. 2011; Joung et al. 2012; van de Voort & Schaye2012).
[image:5.612.94.527.52.479.2]The HII line ratios of the Hα extension indicate that star formation is the primary source of ionization (see Figure4), suggesting that the Hαextension is an accreting gas-rich LSB dwarf galaxy. Assuming that this Hαextension is indeed a LSB
dwarf galaxy, we estimate a stellar mass upper limit of
M*∼107Me.
To obtain this limit, we first sum theg-bandflux of every pixel in the Hαcircle using SDSS DR7; we multiply this sum by 3 and take it as the upper limit of theg-bandflux. Selecting SDSS DR7 galaxies at 0.02<z<0.04, we plot their mass-to-light ratios(M/L)as a function of rest-frameg−rcolor using the MPA-JHU stellar masses and galaxyg- andr-band absolute magnitudes from GIM2D(Simard et al.2011)and then use the typical M/L of star-forming galaxies (0.2<g−r<0.4) to estimate the stellar mass upper limit of the Hαextension, which yields M*∼107Me.
A galaxy with such a low stellar mass, however, is unlikely to have the supersolar gaseous metallicities that are observed in the Hα extension (Berg et al. 2012; Jimmy et al. 2015), indicating that the Hα complex is probably not an accreting gas-rich LSB dwarf galaxy.
Finally, the enhanced values ofW80within the Hαextension (see Figure3(b))that coincide with an unusualvpeakbump in
the velocity profile(at∼−7″of Figure 3(c))may suggest the
presence of turbulence that could be caused by the interaction between accreting gas and the host galaxy. However, such large values ofW80may also be an artifact caused by the coarse
resolution of the MaNGA data, which could blend multiple components separated by small velocities and/or small distances. Future higher-resolution data will be needed to discern these possibilities.
Therefore, the gas accretion scenario that best matches the properties of the Hα extension is recycled wind material
(Oppenheimer & Davé2008; Kerešet al.2009a; Oppenheimer et al. 2010; Hopkins et al. 2014), which is predicted to be a critical process in shaping the galaxy stellar mass function at low stellar masses (<5×10¹⁰M*/Me; Oppenheimer et al.2010; Hopkins et al.2014).
4.2.1. Gas Accretion Deficit
[image:6.612.95.523.51.459.2]If this Hα extension is indeed accreting gas, then an interesting application would be toward the gas accretion deficit. To elaborate, Sancisi et al. (2008) combined many nearby HIstudies to show that the visible HIgas accretion rate
Figure 3.(a)Peak velocity,vpeak, of the system.(b)Line width,W80, of the system.(c)Velocity profile of the highlighted spaxels in panel(a), where the color corresponds to the color of the highlighted spaxels. The vertical dashed lines markReof the host galaxy, and the error bars are the 1σuncertainties estimated by resampling the data 1000 times. Panel(c)shows that the Hαextension has peak velocities that deviate from regular rotation, arguing against it being part of a skewed disk.
in the local universe is only ∼0.2M☉yr−1, which is about an order of magnitude too small to account for the current SFR of local star-forming galaxies (∼1M☉yr−1). These HI studies, however, only probe cold gas(T100 K). Simulations predict that most of the gas in coldflows hasT104K upon entering the host galaxy (Joung et al. 2012; van de Voort & Schaye
2012; Nelson et al. 2013). Thus, probing warm (∼104K), ionized gas from the CGM may alleviate the gas accretion deficit.
To test this idea, we compare the potential warm gas accretion rate onto this galaxy with its SFR. Wefirst calculate the ionized gas mass of the Hα circle using the following equation from Osterbrock & Ferland(2006):
( ) ☉
´ =
b
-
-⎜ ⎟
⎛ ⎝
⎜ ⎞
⎠
⎟⎛⎝ ⎞⎠
M
M
L n
2.82 10 10 erg s 100 cm , 1
ionized gas 9
H
43 1
e 3
1
where LHb is the extinction-corrected Hβluminosity andneis
the electron density. We calculate LHβ by summing the
extinction-corrected Hβ luminosities of every spaxel in the Hα circle, yielding LHβ=2.89×1039ergs−1. To estimate
ne, we measure the median [SII] λ6717/[SII] λ6731 ratio (≈1.3; see Figure 6(b)) of the Hα circle to obtain
ne≈50cm−3; this calculation yields Mionizedgas≈1.63×10⁶M☉.
The time required for this Hαcircle to accrete onto the host galaxy,taccretion, is estimated by dividing the distance between
the Hαcircle and the host galaxy with the observed velocity of the Hαcircle. This distance, i.e., the distance between the two highlighted spaxels in Figure 1(b), is ≈6 67, which corre-sponds to 1.5×10¹⁷km. The median∣vpeak∣of the Hαcircle is ≈80 km s−1. Hence, taccretion≈6×10⁷yr.
[image:7.612.65.548.50.461.2]Therefore, the average warm gas accretion rate onto the host galaxy isMionizedgas/taccretion≈0.03M☉yr−1. If this accreting warm gas were driving the current star formation in the host galaxy, we would expect for this warm gas accretion rate to be similar to the current SFR. However, the estimated star formation rate of the host galaxy is SFR=1.67M☉yr−1, which is almost two orders of magnitude larger than the estimated warm gas accretion rate. Thus, warm gas accretion does not appear to solve the gas accretion deficit for this galaxy.
Figure 5. (a)–(c)The log[NII]/Hα, log[OIII]/Hα, and log[SII]/Hαline ratio maps.(d) Line ratio profiles of [NII]/Hα,[OIII]/Hα, and[SII]/Hαof the highlighted spaxels in panels(a)–(c); the colors correspond to the colors of the highlighted spaxels, and the error bars represent the 1σmeasurement error. The black line represents the Hαsurface brightness profile across the same highlighted spaxels, with its values indicated by they-axis on the right side.(e)–(f)The log[OII]/
Hαand log[OIII]/Hβline ratio maps.(g)The line ratio profiles of[OII]/Hα,[OIII]/Hβ, and[SII]/[NII]of the highlighted spaxels in panels(e)–(f). We only consider spaxels with S/N>3 for these emission lines and have corrected all these line ratios for reddening.
However, since this galaxy is starbursting, which is defined to be a short period of intense star formation, perhaps it is unsurprising that the warm gas accretion does not sustain the current star formation rate. Moreover, this estimated warm gas accretion rate may be a lower limit since we do not account for transverse motions, meaning that the true velocity could be higher, nor do we account for the possibility of more DIG that is below our detection limit.
4.3. Other Possibilities
Another possibility for this Hα complex is that it is an outflow. If it were an outflow from a starburst, though, we would expect for its 12+log(O/H)values to be the same as, or higher than, the center of the host galaxy, where the metal-enriching stellar feedback would have likely originated. Instead, we find that the Hα extension has lower 12+log
(O/H), arguing against an outflow. Another possibility is that it is gas disrupted and/or stripped by environmental processes, e.g., mergers or ram pressure stripping (Gunn & Gott 1972). However, since the host galaxy shows no signs of interaction and does not appear to be in a large group, we find this explanation unlikely. Moreover, with a galaxy Sérsic index of
n=3.7, unusual gaseous metallicity profile, and irregular rotation curve, it is also unlikely that this Hα extension is simply part of the host galaxy as a dim, lopsided disk.
Finally, the elongated, asymmetric Hα flux distribution of the system (see Figure 1) resembles the morphologies of tadpole galaxies(van den Bergh et al. 1996; Elmegreen et al.
2005, 2007, 2012; Sánchez Almeida et al. 2013; Straughn et al.2015), suggesting that this Hαextension may be part of a tadpole galaxy. However, in addition to their cometary morphology, another common property of tadpole galaxies is their bright, blue colors that are indicative of recent bursts of intense star formation (Elmegreen & Elmegreen 2010; Elme-green et al.2012). Since the Hαextension in our system has no optical or ultraviolet (UV) counterpart, it is unlikely that our system is a tadpole galaxy. Moreover, the supersolar gaseous metallicities of our system are inconsistent with the very metal-poor gaseous metallicities found in local tadpole galaxies
(Sánchez Almeida et al.2013).
5. CONCLUSION
In this paper, we present the serendipitous observation of an ionized gas structure that protrudes out of a dusty, starbursting galaxy. Our analysis indicates that this ionized gas complex is most consistent with gas accretion through recycled wind material.
To better understand the nature of this phenomenon, and to constrain the importance of gas accretion through recycled wind material, we need to find more of these extended gas complexes. However, the current MaNGA sample has not observed any other isolated galaxy with an adequately sized integralfield unit(6.3Re)to allow such a search. We hope to address this issue with future MaNGA releases.
We thank Kevin Bundy, Kyle Westfall, and Matthew Bershady for helpful comments and discussions. We also thank the anonymous referee for a constructive report that improved this work.
Funding for the Sloan Digital Sky Survey IV has been provided by the Alfred P. Sloan Foundation, the U.S. Department of Energy Office of Science, and the Participating Institutions. SDSS-IV acknowledges support and resources from the Center for High-Performance Computing at the University of Utah. The SDSS Web site iswww.sdss.org. SDSS-IV is managed by the Astrophysical Research Con-sortium for the Participating Institutions of the SDSS Collaboration, including the Brazilian Participation Group, the Carnegie Institution for Science, Carnegie Mellon Uni-versity, the Chilean Participation Group, the French Participa-tion Group, Harvard-Smithsonian Center for Astrophysics, Instituto de Astrofísica de Canarias, Johns Hopkins University, Kavli Institute for the Physics and Mathematics of the Universe
[image:9.612.47.289.53.388.2](IPMU)/University of Tokyo, Lawrence Berkeley National Laboratory, Leibniz Institut für Astrophysik Potsdam (AIP), Max-Planck-Institut für Astronomie(MPIA Heidelberg), Max-Planck-Institut für Astrophysik(MPA Garching), Max-Planck-Institut für Extraterrestrische Physik (MPE), National Astro-nomical Observatory of China, New Mexico State University, New York University, University of Notre Dame, Observatário Nacional/MCTI, The Ohio State University, Pennsylvania State University, Shanghai Astronomical Observatory, United Kingdom Participation Group, Universidad Nacional Autón-oma de México, University of Arizona, University of Colorado Boulder, University of Oxford, University of Portsmouth, University of Utah, University of Virginia, University of Washington, University of Wisconsin, Vanderbilt University,
and Yale University. D.B. is supported by grant RSCF-14-22-00041. A.W. acknowledges support from a Leverhulme Early Career Fellowship. J.H.K. acknowledgesfinancial support from the Spanish Ministry of Economy and Competitiveness
(MINECO)under grant number AYA2013-41243-P and thanks the Astrophysics Research Institute of Liverpool John Moores University for their hospitality, and the Spanish Ministry of Education, Culture and Sports forfinancial support of his visit there, through grant number PR2015-00512.
REFERENCES
Abazajian, K. N., Adelman-McCarthy, J. K., Agüeros, M. A., et al. 2009,
ApJS,182, 543
Asplund, M., Grevesse, N., Sauval, A. J., & Scott, P. 2009,ARA&A,47, 481 Baldwin, J. A., Phillips, M. M., & Terlevich, R. 1981,PASP,93, 5 Belfiore, F., Maiolino, R., Bundy, K., et al. 2015,MNRAS,449, 867 Berg, D. A., Skillman, E. D., Marble, A. R., et al. 2012,ApJ,754, 98 Bergeron, J. 1986, A&A,155, L8
Blanc, G. A., Kewley, L., Vogt, F. P. A., & Dopita, M. A. 2015,ApJ,798, 99 Bouché, N., Finley, H., Schroetter, I., et al. 2016,ApJ,820, 121
Bouché, N., Murphy, M. T., Kacprzak, G. G., et al. 2013,Sci,341, 50 Bregman, J. N. 1980,ApJ,236, 577
Brinchmann, J., Charlot, S., White, S. D. M., et al. 2004,MNRAS,351, 1151 Bruzual, G., & Charlot, S. 2003,MNRAS,344, 1000
Bundy, K., Bershady, M. A., Law, D. R., et al. 2015,ApJ,798, 7 Cappellari, M., & Emsellem, E. 2004,PASP,116, 138
Charlot, S., & Longhetti, M. 2001,MNRAS,323, 887 Collins, J. A., & Rand, R. J. 2001,ApJ,551, 57
Danovich, M., Dekel, A., Hahn, O., Ceverino, D., & Primack, J. 2015,
MNRAS,449, 2087
Davé, R., Finlator, K., & Oppenheimer, B. D. 2011,MNRAS,416, 1354 Dekel, A., & Birnboim, Y. 2006,MNRAS,368, 2
Dekel, A., Birnboim, Y., Engel, G., et al. 2009,Natur,457, 451
Dopita, M. A., Kewley, L. J., Heisler, C. A., & Sutherland, R. S. 2000,ApJ, 542, 224
Dopita, M. A., Sutherland, R. S., Nicholls, D. C., Kewley, L. J., & Vogt, F. P. A. 2013,ApJS,208, 10
Drory, N., MacDonald, N., Bershady, M. A., et al. 2015,AJ,149, 77 Elmegreen, B. G., & Elmegreen, D. M. 2010,ApJ,722, 1895
Elmegreen, D. M., Elmegreen, B. G., Ravindranath, S., & Coe, D. A. 2007,
ApJ,658, 763
Elmegreen, D. M., Elmegreen, B. G., Rubin, D. S., & Schaffer, M. A. 2005,
ApJ,631, 85
Elmegreen, D. M., Elmegreen, B. G., Sánchez Almeida, J., et al. 2012,ApJ, 750, 95
Ferguson, A. M. N., Wyse, R. F. G., Gallagher, J. S., III, & Hunter, D. A. 1996,
AJ,111, 2265
Fischer, T. C., Crenshaw, D. M., Kraemer, S. B., et al. 2015,ApJ,799, 234 Fitzpatrick, E. L. 1999,PASP,111, 63
Fraternali, F., & Binney, J. J. 2008,MNRAS,386, 935 Gunn, J. E., & Gott, J. R., III 1972,ApJ,176, 1
Gunn, J. E., Siegmund, W. A., Mannery, E. J., et al. 2006,AJ,131, 2332 Haffner, L. M., Dettmar, R.-J., Beckman, J. E., et al. 2009,RvMP,81, 969 Haffner, L. M., Reynolds, R. J., & Tufte, S. L. 1999,ApJ,523, 223 Harrison, C. M., Alexander, D. M., Mullaney, J. R., & Swinbank, A. M. 2014,
MNRAS,441, 3306
Hoopes, C. G., & Walterbos, R. A. M. 2003,ApJ,586, 902 Hopkins, P. F., Kereš, D., Oñorbe, J., et al. 2014,MNRAS,445, 581 Hoyle, F., & Ellis, G. R. A. 1963,AuJPh,16, 1
Hunt, L. K., & Hirashita, H. 2009,A&A,507, 1327 Jimmy, Tran, K.-V., Saintonge, A., et al. 2015,ApJ,812, 98
Joung, M. R., Putman, M. E., Bryan, G. L., Fernández, X., & Peek, J. E. G. 2012,ApJ,759, 137
Kauffmann, G., Heckman, T. M., White, S. D. M., et al. 2003, MNRAS, 341, 33
Kennicutt, R. C., Jr. 1984,ApJ,287, 116
Kennicutt, R. C., Jr., Bresolin, F., & Garnett, D. R. 2003,ApJ,591, 801 Kennicutt, R. C., & Evans, N. J. 2012,ARA&A,50, 531
Kereš, D., Katz, N., Davé, R., Fardal, M., & Weinberg, D. H. 2009a,MNRAS, 396, 2332
Kereš, D., Katz, N., Fardal, M., Davé, R., & Weinberg, D. H. 2009b,MNRAS, 395, 160
Kereš, D., Katz, N., Weinberg, D. H., & Davé, R. 2005,MNRAS,363, 2 Kewley, L. J., & Dopita, M. A. 2002,ApJS,142, 35
Kewley, L. J., Groves, B., Kauffmann, G., & Heckman, T. 2006,MNRAS, 372, 961
Lanzetta, K. M., Bowen, D. V., Tytler, D., & Webb, J. K. 1995,ApJ,442, 538 Law, D. R., Yan, R., Bershady, M. A., et al. 2015,AJ,150, 19
Leaman, R., Erroz-Ferrer, S., Cisternas, M., & Knapen, J. H. 2015,MNRAS, 450, 2473
Levesque, E. M., Kewley, L. J., & Larson, K. L. 2010,AJ,139, 712 Li, C., Wang, E., Lin, L., et al. 2015,ApJ,804, 125
Madsen, G. J., Reynolds, R. J., & Haffner, L. M. 2006,ApJ,652, 401 Miller, S. T., & Veilleux, S. 2003,ApJ,592, 79
Monnet, G. 1971, A&A,12, 379
Nelson, D., Vogelsberger, M., Genel, S., et al. 2013,MNRAS,429, 3353 Oppenheimer, B. D., & Davé, R. 2008,MNRAS,387, 577
Oppenheimer, B. D., Davé, R., Kereš, D., et al. 2010,MNRAS,406, 2325 Osterbrock, D. E., & Ferland, G. J. 2006, in Astrophysics of Gaseous Nebulae
and Active Galactic Nuclei, ed. D. E. Osterbrock & G. J. Ferland.(2nd ed.; Sausalito, CA: Univ. Science Books)
Otte, B., Gallagher, J. S., III, & Reynolds, R. J. 2002,ApJ,572, 823 Otte, B., Reynolds, R. J., Gallagher, J. S., III, & Ferguson, A. M. N. 2001,ApJ,
560, 207
Peng, C. Y., Ho, L. C., Impey, C. D., & Rix, H.-W. 2002,AJ,124, 266 Proxauf, B., Öttl, S., & Kimeswenger, S. 2014,A&A,561, A10 Rand, R. J. 1997,ApJ,474, 129
Rand, R. J. 1998,ApJ,501, 137
Rand, R. J., Kulkarni, S. R., & Hester, J. J. 1990,ApJL,352, L1 Rand, R. J., Wood, K., & Benjamin, R. A. 2008,ApJ,680, 263 Reynolds, R. J. 1985,ApJ,294, 256
Reynolds, R. J., & Cox, D. P. 1992,ApJL,400, L33
Reynolds, R. J., Haffner, L. M., Madsen, G. J., Wood, K., & Hill, A. S. 2012,
EAS Publications Series, 56, 213
Reynolds, R. J., Haffner, L. M., & Tufte, S. L. 1999,ApJL,525, L21 Rossa, J., & Dettmar, R.-J. 2003,A&A,406, 493
Rubin, K. H. R., Prochaska, J. X., Koo, D. C., & Phillips, A. C. 2012,ApJL, 747, L26
Salim, S., Rich, R. M., Charlot, S., et al. 2007,ApJS,173, 267
Sánchez, S. F., Rosales-Ortega, F. F., Iglesias-Páramo, J., et al. 2014,A&A, 563, A49
Sánchez Almeida, J., Elmegreen, B. G., Muñoz-Tuñón, C., et al. 2015,ApJL, 810, L15
Sánchez Almeida, J., Elmegreen, B. G., Muñoz-Tuñón, C., & Elmegreen, D. M. 2014,A&ARv,22, 71
Sánchez Almeida, J., Muñoz-Tuñón, C., Elmegreen, D. M., Elmegreen, B. G., & Méndez-Abreu, J. 2013,ApJ,767, 74
Sancisi, R., Fraternali, F., Oosterloo, T., & van der Hulst, T. 2008,A&ARv, 15, 189
SDSS Collaboration, Albareti, F. D., Allende Prieto, C., et al. 2016, arXiv:1608.02013
Shapiro, P. R., & Field, G. B. 1976,ApJ,205, 762
Simard, L., Mendel, J. T., Patton, D. R., Ellison, S. L., & McConnachie, A. W. 2011,ApJS,196, 11
Smee, S. A., Gunn, J. E., Uomoto, A., et al. 2013,AJ,146, 32 Stewart, K., Maller, A., Oñorbe, J., et al. 2016, arXiv:1606.08542 Straughn, A. N., Voyer, E. N., Eufrasio, R. T., et al. 2015,ApJ,814, 97 Tremonti, C. A., Heckman, T. M., Kauffmann, G., et al. 2004,ApJ,613, 898 Tüllmann, R., Dettmar, R.-J., Soida, M., Urbanik, M., & Rossa, J. 2000, A&A,
364, L36
Tumlinson, J., Thom, C., Werk, J. K., et al. 2011,Sci,334, 948 van de Voort, F., & Schaye, J. 2012,MNRAS,423, 2991
van den Bergh, S., Abraham, R. G., Ellis, R. S., et al. 1996,AJ,112, 359 Vazdekis, A., Ricciardelli, E., Cenarro, A. J., et al. 2012,MNRAS,424, 157 Voges, E. S., & Walterbos, R. A. M. 2006,ApJL,644, L29
Werk, J. K., Prochaska, J. X., Thom, C., et al. 2013,ApJS,204, 17 Werk, J. K., Prochaska, J. X., Tumlinson, J., et al. 2014,ApJ,792, 8 Wilkinson, D. M., Maraston, C., Thomas, D., et al. 2015, MNRAS,
449, 328
Wood, K., & Mathis, J. S. 2004,MNRAS,353, 1126
Yan, R., Newman, J. A., Faber, S. M., et al. 2006,ApJ,648, 281 Yan, R., Tremonti, C., Bershady, M. A., et al. 2016,AJ,151, 8 York, D. G., Adelman, J., Anderson, J. E., Jr., et al. 2000,AJ,120, 1579


![Figure 2. Gaseous metallicity, 12spaxels in panelsmetallicities, bymetallicity gradient of noninteracting disks from Sánchez et al.+log(O/H), map of the system using (a) IZI and (b) the [N II]/[O II] calibration](https://thumb-us.123doks.com/thumbv2/123dok_us/8989911.395828/5.612.94.527.52.479/gaseous-metallicity-panelsmetallicities-bymetallicity-gradient-noninteracting-sanchez-calibration.webp)
![Figure 4. ([ratios in the Ha, b) [N II] and [S II] BPT diagrams, respectively; the lower right error bars represent the typical 1σ measurement errors](https://thumb-us.123doks.com/thumbv2/123dok_us/8989911.395828/7.612.65.548.50.461/figure-ratios-diagrams-respectively-represent-typical-measurement-errors.webp)
![Figure 5. (line represents the Hhighlighted spaxels in panelsHconsider spaxels with Sa)–(c) The log [N II]/Hα, log [O III]/Hα, and log [S II]/Hα line ratio maps](https://thumb-us.123doks.com/thumbv2/123dok_us/8989911.395828/8.612.94.516.49.651/figure-represents-hhighlighted-spaxels-panelshconsider-spaxels-iii-ratio.webp)
![Figure 6. (circle[a) [S II] 6717/[S II] 6731 line ratio map. (b) Histogram of theS II] λ6717/[S II] λ6731 line ratios of the entire system (black), the centralregion (orange, as indicated by the orange circle in the top panel), and the Hα (cyan).](https://thumb-us.123doks.com/thumbv2/123dok_us/8989911.395828/9.612.47.289.53.388/figure-histogram-ratios-centralregion-orange-indicated-orange-circle.webp)
