ISSN Print: 1940-9893
DOI: 10.4236/jssm.2019.123021 Apr. 2, 2019 315 Journal of Service Science and Management
Evidence Implementation Plan
Nader Saadeh
University of Northampton, Northampton, Northamptonshire, UK
Abstract
The focus of this paper is to detect the structure of the guest’s needs and to discover the best predictor of those needs through using the SERVQUAL method which will lead to a better understanding to the service quality in a five-star hotel in Jordan, and hence, lead to better decision making concern-ing customer satisfaction. Methodology: The paper used mixed methods. The qualitative approach was used to explore the management’s understanding of the guest’s perceptions, which is in conducting in-depth, open-ended inter-views using semi-structured prompt questions around the management’s knowledge about the perceptions of their guests. The quantitative approach focused on the scale model SERVQUAL using a self-administered structured questionnaire which will be presented to the hotel’s guests. Results and con-clusion: Based on empirical evidence and previous studies, this paper reached a point where a benefit for change is actually happening at the end of the re-search’s period using the scale model SERVQUAL. This could be measured through the tools that are mentioned in this research paper.
Keywords
SERVQUAL, Audit, Evidence, Expectations, Perceptions, Customer Satisfaction, Change
1. Introduction
It is essential to know that good decision making depends on sound research. Furthermore, a considerable amount of research knowledge helps managers to reach proper solutions to their problems at the workplace. After all, effective de-cision making is a process of choosing among several alternatives, and research gets managers to generate effective decisions that resolve their problems [1].
A research audit has been done to investigate the research culture in five-star hotel in Jordan. The findings revealed the understanding of the organisation’s (hotel) management in dealing with the “customer satisfaction” problem through
How to cite this paper: Saadeh, N. (2019) Evidence Implementation Plan. Journal of Service Science and Management, 12, 315-326.
https://doi.org/10.4236/jssm.2019.123021
Received: February 2, 2019 Accepted: March 29, 2019 Published: April 2, 2019
Copyright © 2019 by author(s) and Scientific Research Publishing Inc. This work is licensed under the Creative Commons Attribution International License (CC BY 4.0).
http://creativecommons.org/licenses/by/4.0/
DOI: 10.4236/jssm.2019.123021 316 Journal of Service Science and Management a systematic process of data gathering and analyses. That is why several aspects of research were existent in the decision-making process that reflected the man-agement’s concern about getting to the best decisions in fulfilling their goal of the “customer satisfaction”. Consequently, the audit demonstrated the existence of tracking systems, analytical techniques and investigating approaches which were built into the system of decision making of the organisation regarding cus-tomer satisfaction. However, the audit detected some deficiencies in the research approach that the organisation follows [2].
2. Literature Review
Numerous past studies investigated the role of service quality, which leads to customer satisfaction, in hotels and other service companies through a model named SERVQUAL which was applied in exploring the quality of the service in different kinds of organisations. Reference [3] developed a “22-item instrument” for evaluating customer’s perceptions and expectations regarding the service quality being presented in an organisation. This model is a scale which could be used in measuring the perceived quality of the service concerning the customer’s perceptions and expectations. Thus, it is a set of structured statements (22-item instrument) that measures the customer’s judgment before experiencing the ser-vice(expectations) and after experiencing it(perceptions). Those statements formulated a construct of service quality, through Parasuraman’s, Zeithaml, and Berry [3] work-study, which was conceptualized, and then operationalised and dimensionalised via a procedure of factor analysis. Evidence of data from four companies checked the scale’s validity and reliability.
Oliver, cited in [3] defines satisfaction as follows: “it is a summary psycholog-ical state resulting when the emotion surrounding disconfirmed expectations is coupled with the consumer’s prior feelings about consumption experience”, while “perceived service quality is a global judgment or attitude relating to the superiority of the service” [3]. To illustrate, “satisfaction” is the “emotional reac-tion following a disconfirmareac-tion experience” whereas quality is related to a judgment or attitude. The disconfirmation experience is the difference in the consumer’s judgment between his expectations, which are taken before expe-rience, and his perceptions which are after it.
DOI: 10.4236/jssm.2019.123021 317 Journal of Service Science and Management 22-item SERVQUAL instrument statements. Those statements were spread among five dimensions and were used to reflect the expectations and percep-tions of the consumers. The SERVQUAL five dimensions suggested the follow-ing labels [3]:
“Tangibles: Physical facilities, equipment and appearance of personnel. Reliability: Ability to perform the promised service dependably and accurate-ly.
Responsiveness: Willingness to help customers and provide prompt service. Assurance: Knowledge and courtesy of employees and their ability to inspire trust.
Empathy: Caring and individualized attention the firm provides its consum-ers.”
After collecting data and do the factor analysis required to dimensionalise and conceptualize the SERVQUAL construct, Parasuraman, Zeithaml, and Berry [3] did descriptive statistical analysis and regression analysis to detect the best pre-dictor of those dimensions. Similarly, the researcher could measure the service quality of the hotel using this SERVQUAL scale instrument statements in order to capture the existing quality of the hotel’s service, the expectations and percep-tions of the hotel’s customers and understanding of the hotel’s management view of those dimensions and how are these related to the hotel’s customers.
While Parasuraman, Zeithaml, and Berry [3] explored the service quality in four different service companies: banks, credit card companies, repair and maintenance companies and long-distance telephone company, Akbaba [1] and Markovic and Raspor [4] examined this construct in the hotel industry. Akbaba [5] found out the relation of the SERVQUAL model to the manager’s under-standing of the customer’s need. Likewise, Markovic and Raspor [4] discovered the implementation of the model in the tourism and hospitality industry. Both studies identified the expectations and perceptions of the customers and the di-mensions of the service quality construct, while only Akbaba [5] detected the best predictor of those dimensions. Akbaba [5] measured the service quality in a business hotel in turkey. He investigated the expectations of the customers using this model, examines the SERVQUAL model of Parasuraman, Zeithaml, and Berry [3] if it applies internationally, searched for any additional dimensions that suites the hotel industry and must be included in the construct and meas-ured the importance of each dimension in relation to the overall quality of the hotel’s customers. However, he found some differences, in his work, in the di-mensions and their components from Parasuraman, Zeithaml, and Berry [3] SERQUAL model.
analy-DOI: 10.4236/jssm.2019.123021 318 Journal of Service Science and Management sis were conducted. However, this study lacked a measure of the level of impor-tance of each specific dimension.
While Akbaba’s [5] study generated five service-quality dimensions: tangibles, adequacy in service supply, understanding and caring, assurance and conveni-ence, the other study generated four key factors that explained the customers’ perceptions of the hotel service. These are reliability, empathy and competence of staff, accessibility and tangibles [4]. To measure expectations and perceptions of the guests Markovic and Raspor [4] prepared 29 service oriented attributes with a seven-point scale that would be presented to a sample of 253 domestic and international guests in the form of self-administered questionnaires. Those attributes were dimensionalised to four factors (mentioned above) through fac-tor analysis using SPSS software. In the same manner, Akbaba [5] used self-administered questionnaires covering a sample of 250 guests using a mod-ified version of the SERVQUAL model of Parasuraman, Zeithaml, and Berry [3] in order to analyze the service quality of the guest’s expectations and perceptions in the hotel being studied in Turkey. After reviewing the literature, 29 attributes were developed to be included in the questionnaire of the study. Some attributes were added to capture some aspects related to the hotel industry. Then, after da-ta were collected, factor and reliability analyses were conducted, and descriptive and regression analyses were done to capture the level of importance for every dimension. The key factors were identified (mentioned above).
Consequently, the best predictor in service quality in Turkey’s hotel was “tan-gibles” followed by “understanding and caring” [5]. Thus, in knowing the level of importance, managers can predict what is most important in the structure of the needs of their guests. This helps them to make better decision making and pick up the best of the alternatives available to resolve their problems at the workplace.
For those reasons which were found in previous evidence-based studies, the researcher values the steps of this evidence in measuring the service quality of the audited hotel. Using this evidence: the “SERVQUAL model” with its modifi-cations that were done in the study of Akbaba [5], enables the management to reach a better understanding of service quality of the hotel, and hence better de-cisions to “customer satisfaction”. Therefore the researcher suggests, in a coming section, a strategy project (plan) for researching and measuring the service qual-ity of the hotel using this model-scale which will help managers to determine the best predictors of the service quality construct. Consequently, rational decisions would be taken to the best of the “customer satisfaction”, which will be based upon scientific research as a shred of evidence, and this will help to determine the best means to reach this goal.
3. Methodology
DOI: 10.4236/jssm.2019.123021 319 Journal of Service Science and Management It is more beneficial for the management to understand what do they know about the expectations and perceptions of their guests. It is also, most beneficial for the management to understand what are the expectations and the percep-tions of their guests. Examples of previous studies were presented in the pre-vious section as evidence of using a scale model that uncovers the hidden needs of the customers. Consequently, this report suggests implementing a research project that aims to detect the structure of the guest’s needs and to discover the best predictor of those needs using the suggested scale model SERVQUAL which will lead to better understanding to the hotel’s service quality, and hence, to bet-ter decision making concerning “customer satisfaction”.
So the aim of this research is to detect the structure of the guests’ needs in the hotel and to discover the best predictor of those needs. Thus the research ques-tion would be “what is the structure of the guests’ needs, and what is their best predictor? Hence, to maximize the value of the results in relation to this research question, the paper will focus on multiple methods investigation in order to un-derstand the experiences and the outcomes of the managers and the guests being researched [6]. The exploration of the management’s understanding of the guest’s perceptions will be based on a qualitative approach. So the aim here is to perceive the management’s interpretation of the service quality attributes of guests possible perceptions. The researcher’s goal is to reach two objectives, which are: 1) to attempt to reach an interpretive understanding of the manage-ment’s action so as to arrive at a causal explanation of their course of action [7], and 2) to compare the findings with the guests perceptions of the hotel. There-fore the management will be able to answer these two questions: did they under-stand what was precisely the guest’s perception, given service quality? Moreover, did they know their exact needs? As for uncovering the needs of the guests and detecting the service quality of the hotel according to the expectations and per-ceptions of the guests, the study will depend upon the quantitative approach. The researcher will follow the SERVQUAL scale model steps which were con-ducted in Akbaba’s [5] study.
3.1. Qualitative Approach
DOI: 10.4236/jssm.2019.123021 320 Journal of Service Science and Management these are:
1) Could you describe if the hotel’s appearance, facilities, equipment and food and beverage are proper, appealing, modern and adequate for your clients?
2) In your own words, how would you identify the adequacy in service supply in the hotel’s client view?
3) How would you see the employees’ empathy for the hotel’s guests in their view? Why?
4) How would you understand the guest’s view of the hotel’s security, safety, and hotel’s operating hours and the employees’ confidence in their guests?
5) How do you think of the guest’s access to the hotel, information and com-plaints?
Those questions will be asked in a recorded focus group approach [8] with the researcher being the moderator of the interview; then the recorded audio will be transcribed. The focus group will formulate a committee. Thematic analysis will be conducted on the transcript, and the main themes and sub-themes will be extrapolated. The findings will be presented and discussed with the focus group committee showing their interpretive understanding of the guests’ perceptions, and then to be compared with the results of the quantitative study of the ques-tionnaires discussed below.
3.2. Quantitative Approach
DOI: 10.4236/jssm.2019.123021 321 Journal of Service Science and Management carried out to test its significance. If the result of the difference was negative; this shows a low (or negative) level of satisfaction, and if it is positive; this shows a definite level of satisfaction. Factor analysis will be performed to explore the di-mensionality of the 29 attributes, and to decide on the dimensions (parameters) of the regression analysis that will be done to determine the level of importance of each dimension. Hence, in determining the level of importance, the manage-ment will be able to focus on the best predictor of the quality dimension which will reflect positively on satisfaction. A reliability test of the scale will also be performed since a reliable scale indicates the stability and consistency of it [1]. In order to track service quality trends within the hotel’s guests, this scale will be conducted periodically [3]. Thus the SERVQUAL scale will be administered twice a year (every six months) for two years.
3.3. Questionnaire Attributes [1]
- The hotel has visually appealing buildings and facilities.
- The service units of the hotel have adequate capacity (dining rooms, meeting rooms, swimming pools, business centre facilities).
- The hotel has modern-looking equipment (air conditioner, furniture, eleva-tor, communication devices).
- The atmosphere and equipment are comfortable and appropriate for stay (beds, chairs, rooms, comfortable, clean, and tranquil).
- The equipment of the hotel works properly without causing breakdowns. - Materials associated with the services are adequate and sufficient (soap,
sham-poo, and towel).
- Food and beverages served are hygienic, adequate, and sufficient.
- Employees of the hotel appear neat and tidy (as uniforms and personal grooming).
- The hotel provides the services as they were promised. - The hotel performs the services right the first time. - Employees provide prompt service.
- The hotel provides the services at the time it promises to do so. - Employees are always willing to serve customers.
- Employees are always available when needed.
- The hotel keeps accurate records (reservations, guest records, bills, orders). - The hotel resolves guest complaints and compensates for the inconveniences
guests suffer.
- The hotel provides flexibility in services according to guest demands. - The hotel serves consistent services (providing the same services and
asso-ciated materials every time).
- Employees have the knowledge to provide information and assistance to guests in areas they would require (shopping, museums, places of interest). - Employees always treat guests in a friendly manner.
DOI: 10.4236/jssm.2019.123021 322 Journal of Service Science and Management - The hotel is also convenient for disabled guests (necessary arrangements made
for the disabled).
- Employees give guests individualized attention that makes them feel special. - The hotel and its facilities have operating hours convenient to all their guests. - The hotel provides its guests with a safe and secure place.
- Employees are still confidence in guests.
- Employees have in-depth occupational knowledge (professional skills, for-eign language, communication skills).
- It is easy to access the hotel (transportation, loading and unloading area, car parking area).
- Getting information about the facilities and services of the hotel is easy.
4. Strategy Project (Plan)
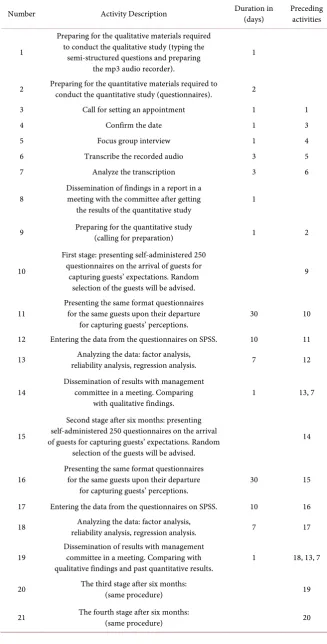
One way of keeping track of the research plan is to put it in bar charts. Gantt charts, which are also recognized as bar charts, are known after their originator Henry Gantt (1861-1919) and used widely in project management. It is a way of keeping track of the research project visually so it may be a powerful aid to con-trol it [9]. Table 1 lists the main tasks that this plan will carry out and Table 2 is the resulting bar chart (Gantt chart) from Table 1, first stage [9]:
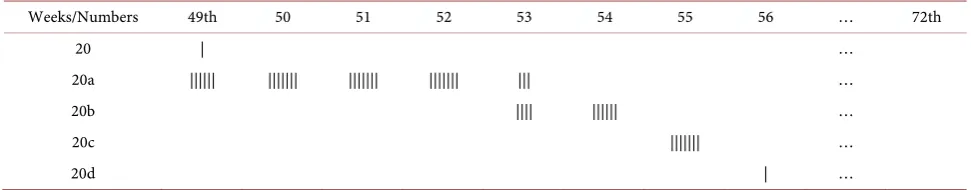
Then the same procedure will be repeated in the same way for the 3rd and the 4th stages in Table 4 and Table 5.
The last three tables show that the second stage ends in the 32nd week, the third stage ends in the 56th and the 4th in the 80th week.
5. Resources and Evaluation of Change
It is important dto determine the sources of information, cost and resources of a research project to be able to implement this project and to develop an evalua-tion procedure to measure change [10]. It is also crucial that the results of this research project end to a beneficial change in the procedures that the manage-ment takes in getting to the best customer satisfaction outcomes. Moreover, evaluation and measurement of change is a powerful tool to identify the impact of this change on the understanding of the hotel’s service quality and customer satisfaction. Below one can find the pre-assumed recourses, sources of informa-tion, and cost of this project and the main points that illustrate the measurement and evaluation of change as follows:
1) Sources of information will be from: a) questionnaires distributed by front desk staff or duty manager and guests who will answer the questionnaires in the quantitative part, and b) audio recorder and management committee in the qua-litative part.
DOI: 10.4236/jssm.2019.123021 323 Journal of Service Science and Management
Table 1. List of main plan tasks.
Number Activity Description Duration in (days) Preceding activities
1
Preparing for the qualitative materials required to conduct the qualitative study (typing the
semi-structured questions and preparing the mp3 audio recorder).
1
2 Preparing for the quantitative materials required to conduct the quantitative study (questionnaires). 2
3 Call for setting an appointment 1 1 4 Confirm the date 1 3 5 Focus group interview 1 4 6 Transcribe the recorded audio 3 5 7 Analyze the transcription 3 6
8 Dissemination of findings in a report in a meeting with the committee after getting
the results of the quantitative study 1
9 Preparing for the quantitative study (calling for preparation) 1 2
10
First stage: presenting self-administered 250 questionnaires on the arrival of guests for
capturing guests’ expectations. Random selection of the guests will be advised.
9
11 Presenting the same format questionnaires for the same guests upon their departure
for capturing guests’ perceptions. 30 10 12 Entering the data from the questionnaires on SPSS. 10 11 13 reliability analysis, regression analysis. Analyzing the data: factor analysis, 7 12
14 Dissemination of results with management committee in a meeting. Comparing
with qualitative findings. 1 13, 7
15
Second stage after six months: presenting self-administered 250 questionnaires on the arrival of guests for capturing guests’ expectations. Random
selection of the guests will be advised.
14
16 Presenting the same format questionnaires for the same guests upon their departure
for capturing guests’ perceptions. 30 15 17 Entering the data from the questionnaires on SPSS. 10 16 18 reliability analysis, regression analysis. Analyzing the data: factor analysis, 7 17
19 Dissemination of results with management committee in a meeting. Comparing with
qualitative findings and past quantitative results. 1 18, 13, 7 20 The third stage after six months: (same procedure) 19
DOI: 10.4236/jssm.2019.123021 324 Journal of Service Science and Management
Table 2. First stage.
Weeks/ Numbers* 1
st
week 2nd 3rd 4 5 6 7th 8 9 10 11 12 13 14 15 16 17 18 19 20 21 22 23 24
Preparing for the qualitative
materials required to conduct the qualitative
study (typing the semi-structured
questions and preparing the
mp3 audio recorder).
|
2 || 3 | 4 | 5 | 6 |||
7 | || |
8
9 | 10 |
11 ||||||| ||||||| ||||||| ||||||| || 12 ||||| ||||| 13 |||||||
14 |
← the is the 1st stage which ends in the 9th week and lasts for six months →
*The numbers are for the first column in Table 1 and reflect the activity description. The chart is for six months and divided to 24 weeks, which means it is for the first stage. Table 3 is the continuing bar chart (Gantt chart) from Table 1 second stage.
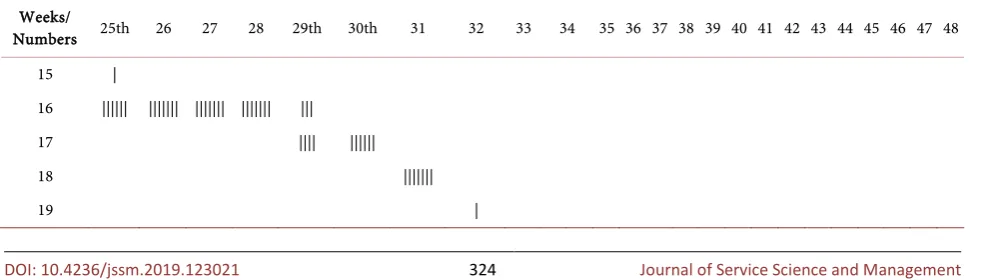
Table 3. Second stage.
Weeks/
Numbers 25th 26 27 28 29th 30th 31 32 33 34 35 36 37 38 39 40 41 42 43 44 45 46 47 48 15 |
16 |||||| ||||||| ||||||| ||||||| ||| 17 |||| |||||| 18 |||||||
[image:10.595.56.549.612.752.2]DOI: 10.4236/jssm.2019.123021 325 Journal of Service Science and Management
Table 4. The 3rd stage.
Weeks/Numbers 49th 50 51 52 53 54 55 56 … 72th
20 | …
20a |||||| ||||||| ||||||| ||||||| ||| …
20b |||| |||||| …
20c ||||||| …
20d | …
Table 5. The 4th stage.
Weeks/Numbers 73th 74 75 76 77 78 79 80 21 |
21a |||||| ||||||| ||||||| ||||||| |||
21b |||| ||||||
21c |||||||
21d |
3) Cost of this research will be only the contract fee of this research project which will be agreed upon later.
4) (PM-EM) is a measuring tool to evaluate change which happens during the period of research. It will be done every six months.
5) Determining the predictors, every six months, is a measuring tool to the best predictors of the hotel’s service quality.
6) Evaluating the management’s vision of guest perceptions from the qualita-tive study. If it is different; suggestions would be made to shift their view to-wards the best predictor of service quality.
7) Preparing for training programs for employees interacting with guests while focusing on the 1st and the 2nd predictors, and illustrating the level of im-portance of the service quality dimensions.
8) Repetition the SERVQUAL procedure every six months to reveal any changes happening in (PM-EM) and in predictors to track trends, since the pe-riodic implementation of SERVQUAL discovers trends [3].
9) Observing if there is any decrease in problems from the Problem Tracker over time.
10) The shift will be measured from the change in (PM-EM). The change in predictors will measure the change in trends. A change in policies must follow any change in those measuring tools.
6. Conclusion
[image:11.595.54.543.217.309.2]DOI: 10.4236/jssm.2019.123021 326 Journal of Service Science and Management quality that shifted (PM-EM) to a positive figure, then this indicated a definite beneficial change that would positively impact the customer satisfaction. Also, if the results of the predictors show any change in trends in service quality, then a change in the training programs and policies would follow this change to be able to get to the best of customer satisfaction. If (PM-EM) was positive from the start or in the middle of the period, then using SERVQUAL as a tracking tool is beneficial for keeping it this way. This study has identified a benefit for change based on empirical evidence and previous studies. But for further studies there is a need to be investigated using the same scale model in the food and beverage department. As this hotel has multiple food and beverage facilities which have a high contribution in the operational income structure. Hence resembling study in this department would add a high value to the customer satisfaction know-ledge in those areas.
Conflicts of Interest
The author declares no conflicts of interest regarding the publication of this paper.
References
[1] Sekaran, U. (2003) Research Methods for Business: A Skill Building Approach. 4th Edition, John Wiley and Sons Inc., Southern Illinois.
[2] Saadeh, N. (2018) Research Culture Audit. The University of Northampton, 1-27. (Unpublished)
[3] Parasuraman, A., Zeithaml, V.A. and Berry, L.L. (1988) SERVQUAL: A Mul-tiple-Item Scale for Measuring Consumer Perceptions of Service Quality. Journal of Retailing, 64, 12-40.
[4] Markovic, S. and Raspor, S. (2010) Measuring Perceived Service Quality Using SERVQUAL: A Case Study of the Croatian Hotel Industry. Management, 5, 195-209.
[5] Akbaba, A. (2006) Measuring Service Quality in the Hotel Industry: A Study in a Business Hotel in Turkey. International Journal of Hospitality Management, 25, 170-192. https://doi.org/10.1016/j.ijhm.2005.08.006
[6] Schutt, K.R. (2015) Why Use Mixed Methods? Your Questions Are Answered. Sage Publishing, Thousand Oaks.
https://connection.sagepub.com/blog/industry-news/2015/02/11/why-use-mixed-m
ethods-your-questions-answered/
[7] Bryman, A. and Bell, E. (2011) Business Research Methods. 3rd Edition, Oxford University Press, Oxford.
[8] Flick, U. (2009) An Introduction to Qualitative Research. 4th Edition, Sage Publica-tions, Thousand Oaks.
[9] Lock, D. (2014) The Essentials of Project Management. 4th Edition, Routledge, ProQuest E-Book Central.
[10] Anon (2015) Project Planning and Evaluation.
https://www.Publicsafety.gc.ca/cnt/cntrng-crm/crm-prvntn/tls-rsrcs/prjct-plnnng-e