Air Traffic Control: To what extent can we predict performance
based on personality?
A dissertation submitted in partial fulfilment of the requirements of the Degree of Master of
Science in Applied Psychology at the University of Canterbury
By Chloe Jones
Supervised by Associate Professor Chris Burt
Department of Psychology,
Acknowledgements
First and foremost, I would like to thank my supervisor Associate Professor Chris Burt. Your
knowledge and support throughout this process have been incredible and I am so very
grateful. Thank you for guiding me back on to the right track when I went off it! To my
secondary supervisor, Associate Professor Katharina Naswall, thank you also for your
support, encouragement and patience through this year– I appreciate both of you helping to
get me over the line.
To the Air Traffic Control provider in New Zealand, thank you for allowing me to conduct
research within your organisation. It was thoroughly interesting and I hope it is valuable to
you.
To my APSY classmates, we made it! It’s been an amazing 2 years and I am grateful for all
of the good times that we have had. I look forward to our continued friendship as we head out
into the world.
And finally, thank you to my family and partner for encouraging me and helping me through
Table of Contents
Acknowledgements ... 2
List of Tables ... 5
Table of Figures ... 6
Abstract ... 7
Introduction ... 8
Overview ... 8
Data Driven Approach to Employee Selection ... 11
History of the relationship between Personality and Performance ... 11
Validation of Personality Measures in Selection ... 15
Occupational personality questionnaire (OPQ) ... 18
Personality and the issue of Response Distortion ... 19
Criterion ... 20
Analysis: Linear vs Curvilinear ... 21
Hypotheses: Specific personality/ performance relationships ... 24
Detail Conscious ... 25
Conscientiousness ... 25
Adaptable ... 26
Decisive ... 27
Relaxed ... 27
Achieving ... 28
Controlling ... 28
Emotional Control ... 29
Innovative ... 30
Vigorous ... 30
Method ... 32
Design ... 32
Participants ... 32
Materials ... 33
Personality ... 33
Performance ... 33
Procedure ... 34
Data Analysis ... 36
Results ... 37
Performance Scale Assessment ... 44
Performance Data Assessment ... 62
Regression ... 64
Curve Estimation Analysis ... 67
Hypothesis Testing ... 69
Expectancy Tables ... 70
Discussion ... 73
Summary of Results ... 73
Response Distortion ... 73
Personality variables important to ATC ... 74
Research Limitations ... 77
Range Restriction Issues ... 77
Future Research ... 78
Theoretical and Practical Implications ... 80
Conclusions ... 83
References ... 84
List of Tables
Table 1. OPQ32 Personality Measure traits to be utilised in the current research ... 10
Table 2. Means and standard deviations for the 32 personality traits at both time points ... 37
Table 3. The results of the paired sample t test for the OPQ personality measure across two different time points ... 40
Table 4. Descriptive Statistics for the low stakes personality data ... 42
Table 5. Results of validation analysis for the Planning and Time Management Competency measure ... 45
Table 6. Results of validation analysis for the Problem Identification and Analysis Competency measure ... 47
Table 7. Results of validation analysis for the Customer Service Competency measure ... 49
Table 8. Results of validation analysis for the Communication Competency measure ... 51
Table 9. Results of validation analysis for the Contextual Decisions Competency measure ... 53
Table 10. Results of validation analysis for the Positive attitude towards learning and change Competency measure ... 55
Table 11. Results of validation analysis for the Teamwork Competency measure ... 57
Table 12. Results of validation analysis for the Responsible and Reliable Competency measure ... 59
Table 13. Process of removal of behavioural indicators through checking scale accuracy ... 61
Table 14. Descriptive statistics for final performance competency scales and overall performance ... 62
Table 15. Reliability analysis for the final performance competency scales ... 63
Table 16. Correlations between the 32 OPQ Personality traits and final competency scores ... 65
Table 17. Regression analysis comparing the linear and curvilinear model for the personality and air traffic controller performance (by competency) ... 67
Table 18. Expectancy tables for significant relationships between personality and performance at competency level ... 71
Table of Figures
Figure 1. An example of how a linear relationship between a predictor and criterion would be presented .. Error!
Bookmark not defined.
Abstract
Purpose – This research looked into the validity of personality in predicting air traffic controller performance and identified which function (curvilinear or linear) was the best fit for each given relationship.
Design/methodology/approach – Participants from an Air Traffic Control Provider in New Zealand completed both the OPQ Personality measure within a high stakes condition
(recruitment) and low stakes condition (in the year 2014) and had managerial performance ratings completed in 2014. This data was then analysed using within sample t tests,
regression and curve estimation techniques.
Findings – 18 relationships were found to be significant between personality traits and the performance competencies. Of these, 10 relationships displayed evidence of a curvilinear function which adds to the growing literature supporting the introduction of a curvilinear function in the personality-performance relationship.
Research Limitations/Implications – There is one minor limitations within the current study. This is that through the use of self-report data, there is a risk of response distortion occurring. Despite this, the current research provides evidence of the validity of personality in predicting performance and a platform for future research into the area. Furthermore, it provides valuable information to improve the successfulness of the selection process.
Originality/value – The study adds to the minimal research on personality and air traffic control performance, and is among the first to examine the idea of a curvilinear function between personality and air traffic controller performance, as opposed to the linear function that has been the only function considered in air traffic control performance research thus far.
Introduction
Overview
This dissertation reports a validation study of the personality measure used within the
selection process of an Air Traffic Control Provider in New Zealand. This organisation is
responsible for managing and supporting air traffic control around New Zealand, with the air
traffic controllers within this organisation being responsible for ensuring the safety of
aircrafts both at and between main airports around New Zealand. The selection process is
made up of three components: pre-screening, assessment centre, and training centre. The
personality measure used is the OPQ32 and sits within the pre-screening section of the
selection process.
This research uses two samples of OPQ32 data obtained from the same air traffic
controllers (ATCs). One sample is from the time of recruitment within the air traffic control
selection process (high stakes) and the other sample is at a time point with no associated
outcomes (low stakes). Research has identified issues of bias and data quality associated with
personality testing, particularly where personality is assessed as part of recruitment. Due to
this, the two personality sample have been compared to identify whether any form of
distortion is occurring within the recruitment sample data. At this point in the research, all 32
traits within the OPQ32 have been analysed (can be seen in Table 1). The result of this
analysis has determined which personality sample (high stakes or low stakes) was used in the
validation analysis.
The validation analysis was the main focus of this dissertation and in particular the
identification of the best fit/function for the relationship between personality and air traffic
control performance for each personality trait. Thus curvilinear and linear functions were
explored for each personality trait and performance relationship. For the function/fit analysis,
useful for air traffic control. These are shown in bold in Table 1. The criterion/outcome
variable in this research is archival air traffic control performance data gathered via
supervisor ratings. These consist of eight different competencies that each have multiple
behavioural indicators beneath them.
The following literature review will first focus on the history of personality testing in
both general and air traffic control selection including the introduction of data-driven
selection. This will identify how personality has emerged and become more accepted in
modern selection. Next, validation studies completed on personality measures will be
analysed with a focus on how personality can add validity, in particular incremental validity,
to selection processes. The validity of personality in air traffic control selection will also be
explored. As stated above, there can be issues of bias and data quality with personality
measures, the types of bias, their impacts and how these can be addressed will be discussed.
The focus will then turn to the analysis of relationships between personality and performance
for general selection and also for air traffic control in particular. The emergence of the idea of
a curvilinear function in personality will be explored as well as what past researchers have
found to be the best fit for specific personality traits.
Finally, specific hypotheses and research questions for the current research are
Table 1. OPQ32 Personality Measure traits to be utilised in the current research
Category Trait
Relationships with People
Persuasive Controlling Outspoken
Independent Minded Outgoing
Affiliative
Socially Confident Modest
Democratic Caring
Thinking Style
Data Rational Evaluative Behavioural Conventional Conceptual Innovative Variety Seeking Adaptable Forward Thinking Detail Conscious Conscientiousness Rule Following
Feelings and Emotions
Relaxed Worrying Tough Minded
Optimistic Trusting
Emotionally Controlled Vigorous
Data Driven Approach to Employee Selection
The data-driven approach to selection has effectively replaced the common-sense
method that replied upon personal judgements (Ungerson, 1970). This modern approach
looks to reduce error and biases (Ungerson, 1970) and create clear job criteria to enable
successful selection (Wood & Payne, 1998). The Air Traffic Control’s selecton process
utilises a comprehensive data driven approach to selection. Job Analysis is a main facet of
this approach and has been described as “a systematic process for collecting and analysing
information about a job” (Prien, Goodstein & Goodstein, 2009, pg. 11). Job Analysis
produces clear links between selection criteria and high employee performance which
justifies selection decisions and consequently reduces guesswork (Boxall, Rudman & Taylor,
1986). The justification of selection decisions reduces the risk of discrimination which, in
turn, protects the employer from legal issues (Thompson & Thompson, 1982). Boxall et al.,
(1986) stated that employers are more likely to make successful selections when supplied
with extensive job-related information. Selection measures are then identified after the job
analysis has taken place (Boxall et al., 1986). Personality measures are a type of selection
measure within data-driven selection and the history of the personality measure will be
discussed in the next section.
History of the relationship between Personality and Performance
Personality is continuing to gain increasing research interest in selection settings
(Converse & Oswald, 2014) which has increased the interest in the personality-performance
relationship. In 1953, Spriegel and Dale surveyed 628 companies in the United States of
America and 248 of these (40%) reported that their selection processes utilise some form of
personality measure. Before the 1990s, research indicated that the use of personality
2000). More recently, personality has become increasingly accepted within selection for
employees (Li et al., 2006).
The first personality-type measure was by Thurstone (1934) and involved a survey
where participants were asked to evaluate someone they knew well on 60 specified traits.
Extending upon this, Locke and Hulin (1962) created the Activity Vector Analysis with 81
words measuring four personality factors (sociability, emotional control, aggression and
social adaptability). In an important personality study, Guion and Gottier (1965) performed a
qualitative review of personality measures in selection and found a need for personality to
successfully predict employee performance. This conclusion was despite low validities being
found by Guion and Gottier (1965) and others in early research which will be discussed later
in this literature review. In line with this, Day and Silvermann (1989) also determined a need
for personality measures in selection when ensuring that the measures are correctly matched
with the organisational values and needs. As stated earlier, the introduction of data-driven
selection is said to have enabled more successful selection of employees (Boxall et al., 1986)
with personality measures having a higher utility when used after a job analysis (Goodstein &
Lanyon, 1999).
The creation of the Big Five Factors of personality began to answer the question
posed by many researchers regarding how many traits exist and the nature of these
(Goodstein & Lanyon, 1999). Early work by Cattell (1945) and Guildford (1948) first
identified a five factor type model and created a platform for other researchers to continue
extending upon into the idea of a five factor model. Tupes and Christal (1958) used a sample
of air force cadets to find reliable results for the presence of five traits: Surgency
(extroversion), Agreeableness, Conscientiousness, Emotional Stability and Culture.
Alongside this, high correlations between these traits and performance measures were also
for conscientiousness (Tupes & Christal, 1958). Research then continued to support and
extend upon the five factor model (Goldburg, 1982, Norman, 1963). McRae and Costa (1987)
found that the ‘Big Five’ accounted for a significant portion of the variability that existed
within both personality measures and self-ratings and confirmed the five traits to be:
Emotional Stability, Extroversion, Openness to Experience, Agreeableness and
Conscientiousness. More recently, as well as the Five Factor Model (McRae & Costa, 1987),
the general factor of personality (Musek, 2007) has been introduced. This factor is said to be
a higher order factor relating to self-esteem, life satisfaction and emotionality and accounts
for 30-50% of variation in the big five personality factors between individuals in a sample
(Musek, 2007). The general factor was also found to account for almost half of the
association between the big five and overall performance which indicates that it has an
influential part in predicting performance through personality (van der Linden, Bakker &
Serlie, 2011). It was concluded by Oswald and Hough (2010) that personality now plays a
prominent role in general employee selection processes.
Air traffic control is an intensive and challenging role that is responsible for
coordinating flights arriving and departing at airports and controlling aircraft routes through
controlled airspace around the world (Suresh et al., 2012). Thus, the role requires a certain
type of person and skill-set to be able to successfully perform the job (Luuk, Luuk & Aluoja,
2009). Within the third stage of the selection process, the candidates enter into the training
centre where they are taught air traffic control through theory and practical training. They are
required to pass this training to become an air traffic controller and get posted to an ATC
location. Even after successful selection into the training phase, global statistics show that
20% of trainees fail (Pecena et al., 2013). Therefore, the two sections of the selection process
candidates who can be successful. Personality selection measures, in general, have been
found to be useful in predicting training success in air traffic controllers if implemented
correctly (King et al., 2003). Early on in research between personality measures and aviation
employee selection, Bond et al., (1962) indicated that personality testing was an essential
component for selecting aviation employees.
The idea that air traffic controllers have similar personality traits was introduced by
Luuk et al., (2009) with common traits being identified. Based on this, the current research
looks to solidify this personality profile and use it to encourage and help the identification
and selection of successful air traffic controllers. Extending upon the findings by Luuk et al.,
(2009) of a common personality profile in air traffic controllers, Suresh, Ramachandran and
Srivastava (2012) confirmed that adjustment, prudence and ambition predicted success
among air traffic control. The research by Suresh et al., (2012) involved 87 controllers from
air force bases around India and utilised a measure called the Performance Improvement
characteristics and Work style attributes which identify what is required to be successful in a
job (Suresh et al., 2012). In this research, air traffic controllers were asked to identify what
makes them successful in their role (Suresh et al., 2012). The results showed that there were
three confirmed traits that predicted ATC performance (ambition, adjustment and prudence).
The current research will look to confirm whether these results are accurate through using
performance data to solidify the personality-performance relationship found by past
researchers.
Now that the history of personality measures in both general selection and in air
traffic control specifically has been looked at, the validation studies for personality in
Validation of Personality Measures in Selection
Due to the current research’s focus on selection and predicting performance, this
section will focus on criterion related validity which is defined as the ability for this measure
to predict job performance (Cronbach & Meehl, 1955).
The validation of personality measures in selection appears to be separated into two
distinct time points (Barrick, Mount and Judge, 2001). The first is when personality was
concluded to be unrelated to employee performance (Barrick et al., 2001) and the second was
when personality became increasingly accepted in recent selection methods (Barrick et al.,
2001). One of the early and influential validation studies on personality and performance was
conducted by Guion and Gottier (1965) who performed a meta-analysis on 17 research
studies from 1952 to 1963. They concluded that only a small number of these studies
indicated some form of predictive validity (37%), and even this number was deemed to be an
overestimate (Guion & Gottier, 1965). Thus they concluded that no evidence was present for
recommending using personality as a selection tool (Guion & Gottier, 1965).
At this point the idea was introduced that personality may be helpful in increasing
incremental validity by increasing the base rate of a selection process (Sechrest, 1962; cited
in Day & Silvermann, 1989). Incremental validity indicates that the measure is useful
alongside other measures in increasing the validity, often predictive power, of the selection
process as a whole (Sechrest, 1963). This idea may still be valid however as research
continued, more criterion related validity was found. A meta-analysis was conducted by
Schmidtt et al., (1984) in an attempt to make sense of the research completed following the
Guion and Gottier (1965) research. This research resulted in an overall criterion related
validity coefficient of 0.21 when personality was related to performance and at this point, it
was concluded that personality may be less valid than other selection tools within selection
A pivotal study in the personality-performance research was the Barrick and Mount
(1991) study on the five factors of personality. This study used 117 studies between 1952 and
1988 and analysed the five factors of personality across 5 different occupations (Barrick &
Mount, 1991). Linear correlations were found ranging from 0.04 for openness to experience
to 0.22 for conscientiousness providing an indication of some predictive validity within
personality (Barrick & Mount, 1991). Despite a linear analysis being used in this analysis (as
this is the default), the idea of a curvilinear analysis was identified as having the potential to
be a better fit for some personality traits (Barrick & Mount, 1991). Conscientiousness was
also found to have the highest criterion related validity coefficient of the personality traits in
the Schmidt & Hunter (1998) study with 0.31 as well as being the only personality measure
found to predict performance. Extending upon this, Tett et al., (1991) found an overall
personality criterion related validity coefficient of 0.24 (linear) across 86 studies which
further solidified the increasing positive perception of personality in selection.
In more recent research, Goodstein and Lanyon (1999) concluded that there is strong
support for the use of personality in employee selection. As stated above, the use of job
analysis can be utilised to increase the successful of a selection method (Boxall et al., 1986).
Goodstein and Lanyon (1999) found that when job analysis is utilised, personality can
account for 10% of variance between people in job performance. Barrick, Mount and Judge
(2001) conducted a further validation analysis on the ‘big five’ personality factors using 40
past studies. It was concluded that there was significant correlation between both emotional
stability and conscientiousness with performance which provides evidence of predictive
validity (Barrick et al., 2001). This research has confirmed that there is consistency amongst
meta-analyses with what personality factors are valid in predicting performance with an
increase now being shown since early research (Barrick et al., 2001; Guion & Gottier, 1965;
performance relationship and found predictive validity for self-report personality measures
when the outcome was getting a job. Furthermore, a predictive validity of 0.27 was found for
personality and predicting individual job performance (Ones et al., 2007).
Within the air traffic control industry specifically, Luuk et al., (2009) conducted an
analysis using 60 air traffic control candidates at an aviation college in Estonia. It was found
that air traffic control personnel were higher in conscientiousness and emotional stability
(Luuk et al., 2009). It was also concluded that personality can add 3% incremental validity to
selection processes within air traffic control (Luuk et al., 2009). There is minimal research on
the incremental validity of personality measures and this requires further analysis. An
interesting finding by Luuk et al., (2009) was the conclusion that the air traffic control
population can be differentiated from the general population. This adds further weight to the
argument that the personality-performance relationship needs to be conducted within a
relevant context for air traffic control and increases the usefulness of the current study. More
recently, Roe (2012) analysed the relationship between personality (specifically, a measure
that measured conscientiousness, extraversion, neuroticism and altruism) through a large
sample of over 3000 air traffic control candidates. This study found evidence of predictive
validity between the personality measures and success in training which was expected to be
replicated in operational performance (Roe, 2012).
In summary, the predictive validity of personality for performance has had mixed
results and has continued to increase over time. Early research (Guion & Gottier, 1965;
Schmitt et al., 1984) indicated very little utility of personality in selection however later
research (Barrick & Mount, 1991; Tett et al., 1991; Schmidt & Hunter, 1998; Barrick et al.,
in selection with a focus on the potential for incremental validity to be a main strength. Even
within air traffic control, a link has been found between particular personality traits and air
traffic control training success with the potential for this to be present in operational
performance as well (Roe, 2012). This literature review will now take a closer look at the
specific personality measure (OPQ32), including its validity, that is used in this research.
Occupational personality questionnaire (OPQ)
As stated above, the selection process outlined is the tool that is used for air traffic
controller selection within an Air Traffic Control Provider in New Zealand. It involves three
sections with the first section, pre-screening, including the OPQ as the personality measure.
The OPQ is designed to measure personality within 3 narrow categories. These categories are
relationships with people, thinking style and feelings and emotions. It also includes a social
desirability and consistency measure to identify any distortion issues within the data. The
issue of distortion in personality measures is discussed in detail in the next section of this
literature review. The OPQ Technical Manual (2014) reports the analysis of the validity and
reliability of the OPQ measure. The OPQ shows a high test-retest reliability of 0.85 and high
construct validity. Bartram et al., (2006) found that all scales within the OPQ32 had an
internal consistency of above 0.7. There is minimal research performed on the criterion
related validity of the OPQ however as stated earlier, context is extremely important for
validation studies (Johns. 2006). Therefore, performing a validation type study on the OPQ
within air traffic control will provide valuable information on the criterion related validity of
The personality measure detailed above has been described as reasonably valid and
reliable however there are common issues that can occur with any self-report measures
(Paulhus, 1991). These issues will be discussed in the next section.
Personality and the issue of Response Distortion
There are often issues surrounding response biases with measures that are mainly, or
solely, self-report (Paulhus, 1991), in particular, personality measures (Edwards, 1953). A
response bias has been defined as a scenario when an applicant chooses an option to appear
more socially desirable whilst disregarding accuracy (Paulhus, 1991). This research is
interested in the difference between high stakes and low stakes personality scores. There are
contrasting results for whether this distortion exists. Early research by Gordon and Stapleton
(1956) displayed that there were inflated scores for students applying for a summer job
(viewed as high stakes) as opposed to completing the personality measure in a career
guidance program (low stakes). In contrast to this, some research has also shown a
consistency amongst scores across recruitment contexts and research contexts (Abrahams,
Neumann & Githens, 1971; Orpen, 1971). In support of the results by Gordon and Stapleton
(1956), Boyce (2005) reported notably inflated scores for the personality measures at
recruitment for a theme park job in comparison to scores solely for research purposes.
Finally, Ellingson, Sackett and Connelly (2007) conducted a study involving 713 individuals
from multiple organisations and roles completing the Californian Psychological Inventory
within two different contexts. These time points were in a recruitment context (high stakes)
and in a development context (low stakes) with results indicating that there was significant
distortion present across these two contexts (Ellingson et al., 2007). Hurtz & Alliger (2002)
favourable and Dilchert, Ones, Viswevaran & Deller (2006) concluded that all scores in ‘high
stakes’ conditions contain some form of deception.
A detrimental effect of response distortion is that some applicants distort more than
others (Ones & Viswesvaran, 1998) therefore the selection outcome will be influenced
through people with large distortion gaining an advantage (Rosse et al., 1998). Regarding
response distortion, the current study will look to add to research by identifying whether there
is response distortion present in the high stakes and low stakes condition and then ensure that
the correct personality measure is being utilised for further analysis. This will allow the
chance of distortion in the study to be minimised. The literature surrounding the criterion
variable will now be discussed and also the goal of point to point correspondence.
Criterion
Now that the predictor variable has been reviewed, focus will turn to the criterion
(performance) variable. The criterion for the current research consists of performance data
that is managerial ratings of the air traffic controller over 8 different competencies (see
Appendix A). The measure of job performance is common as a criterion variable with Lent,
Aurbach and Levin (1971) finding that within validation studies, 63% used job performance
as their criterion variable, with 90-93% of these studies using supervisor ratings (Bernadin &
Beatty, 1984; Lent et al., 1971). The criterion variable can also have influence over the
outcome of the validation study and also the function of the relationship (Converse &
Oswald, 2014) (discussed in the next section). In particular, the Halo effect can influence and
increase bias within performance ratings (Viswesvaran, Schmidt & Ones, 2005). The Halo
effect indicates that people make decisions on one component which has a biasing effect on
the rest of their interpretations and ratings (Viswesvaran et al., 2005). Viswesvaran et al.,
completely different performance dimensions. In their early qualitative review of personality
measures, Guion and Gottier (1965) also called for more consideration to be given to the
specific setting that personality measures are validated in, therefore conducting the research
within the air traffic control environment is essential to the accuracy of the conclusions
drawn.
Point-to-point correspondence is important in selection as the goal of selection is
almost always to predict future job performance (Schmidt & Ostroff, 1986). Point-to-point
correspondence refers to the amount that predictors are in line with, and therefore predict, job
tasks (Schmidt & Ostroff, 1986). Therefore, validation of the selection methods within a
selection process is extremely influential for the success of the process. If not taken into
account, a lack of point-to-point correspondence can have detrimental effects on the
productivity of the organisation as a whole (Iddekinge & Ployhart, 2008). The personality
measure is deemed as a low fidelity measure however this has been said to still produce high
criterion related validity if utilised correctly (Tuzinski, 2013). The air traffic control selection
process consists of many aspects with personality being just one. It is important to understand
firstly what traits predict job performance and then to identify what aspects of performance
are predicted by personality and then validate the remainder of the selection process elements
to ensure that all aspects of performance are being predicted.
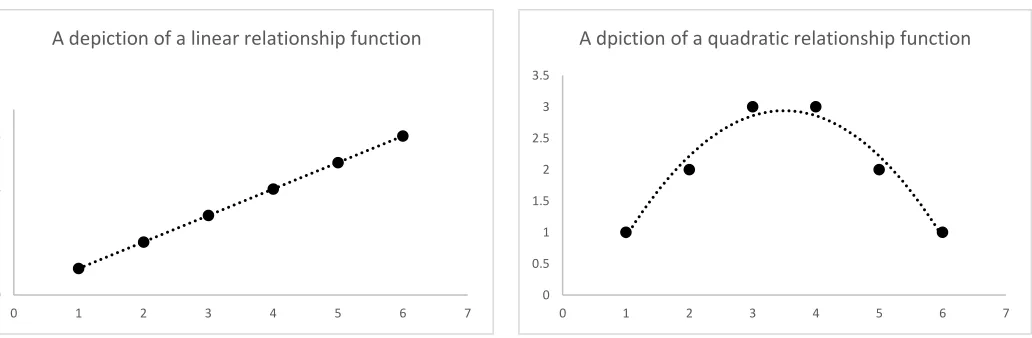
Analysis: Linear vs Curvilinear
There are two broad types of functions for criterion-predictor relationships. The first
is linear and then second is curvilinear. There are two different types of curvilinear which are
asymptotic and quadratic. In this research, the term curvilinear indicates a quadratic function.
As stated above, this research will focus on the linear function and the quadratic function
the criterion behaves in the same way (Stuart-Hamilton, 2007) (Figure 1). A quadratic
function is where high personality levels are associated with high performance levels until a
certain point where high personality is then associated with lower performance levels
[image:22.595.45.561.178.347.2](Converse & Oswald, 2014) (Figure 2).
Figure 1. An example of how a linear relationship between a predictor and criterion would be presented
Figure 2. An example of how a curvilinear
relationship between a predictor and criterion would be presented
Commonly, predictor-criterion relationships have been assumed to be linear in
selection (Converse & Oswald, 2014) however more recently, evidence has been presented
towards the potential for some personality traits to have a curvilinear relationship with
performance (Converse & Oswald, 2014). Results by Converse and Oswald (2014) concluded
that using the incorrect function of a relationship in selection can have a negative effect on
the job performance of the person selected. In their study, it was found that using the wrong
function involved a loss of 0.4 standard deviation (for both Conscientiousness and Emotional
Stability) which moved a selected employee from having above average performance to
average or below average performance (Converse & Oswald, 2014). This finding indicates
the importance of using the correct function as selection decisions can be incorrectly made if
not. Early research identified a linear function for the ability-performance relationship, and, 0
1 2 3 4 5 6 7
0 1 2 3 4 5 6 7
A depiction of a linear relationship function
0 0.5 1 1.5 2 2.5 3 3.5
0 1 2 3 4 5 6 7
due to a lack of knowledge regarding personality, the personality-performance was assumed
to be linear also (Coward & Sackett, 1990, Le et al., 2011). Despite finding solely linear
relationships between personality and performance, Coward and Sackett (1990) questioned
the accuracy of this function and called for further research into the possibility of a
curvilinear function. Barrick and Mount (1991) hypothesised that the reason for low
validities, as described earlier, was due to the function of personality-performance
relationships being curvilinear and not the anticipated linear. More specifically, Murphy
(1996) suggested that if a linear function was not utilised, a quadratic function may be the
most accurate for relationships between non-cognitive measures (such as personality) and
performance. This idea has guided the current research to compare the linear and curvilinear
functions for the relationship between air traffic control performance and personality.
Many studies have found curvilinear relationships between personality traits and
performance type measures such as training performance (Vasilopoulos, Cucina & Hunter,
2007), leadership performance (Benson & Campbell, 2007) and college GPA level (Cucina &
Vasilopoulos, 2005). This research adds to the growing evidence that a curvilinear function
has a place in personality validation however a study of specific job performance will need to
be studied in order to get accurate results of the personality-performance relationship (Hurtz
& Donovan, 2000). Since this research has taken place, there has been large debate amongst
researchers over the function of particular traits with job performance. In particular,
conscientiousness has received a lot of attention with mixed conclusions. For example; Robie
and Ryan (1999) found no evidence of a non-linear relationship between conscientiousness
and performance when they conducted research on a range of different occupations. In
contrast to this, LaHuis (2005) found a non-linear relationship between conscientiousness and
performance for clerical employees. The inconclusive results of these studies (and many
influence over the function of the relationship found. Pierce and Aguinis (2013) extend on
this to conclude that all relationships may have a curvilinear relationship within specific
contexts. Blickle et al., (2015) indicated that the type of non-linear relationship is determined
by the job context and relevance of the personality trait to that job context. This research
further enhances the need for research to be completed specifically in the air traffic control
context in order to get accurate results.
After reviewing the literature relating to both the predictor and criterion variables,
several hypotheses are relevant to the direction of this research and are outlined in detail
below.
Hypotheses: Specific personality/ performance relationships
The first hypothesis relates to distortion within the personality data. Based on the
literature by Paulhus (1991) and Edwards (1953) stating that there is commonly distortion
found in personality (self-report measures), the hypothesis is as follows
H1: A difference will exist between the scores in the low stakes personality and the
high stakes personality condition for majority of the OPQ traits.
Of the 32 OPQ traits, 10 of these will be hypothesised within this research. Some of
these traits have much clearer hypotheses and some not so depending on the amount of past
research that has been conducted. These hypotheses were generated as a result of a review of
the literature and of the validation studies completed by the Air Traffic Control Provider in
New Zealand. It is important to note that when conducting their validation studies, the
organisation considered only a linear relationship between the personality traits and air traffic
study looks at performance broken into 8 different competencies. For the purpose of these
hypotheses, the phrase ‘performance’ refers to all 8 performance competencies (i.e. all
performance competencies are expected to have the same relationship with a given
personality trait). The hypotheses are outlined in detail below.
Detail Conscious
From the organisation’s validation studies, detail conscious was identified to have a
positive linear relationship with air traffic control performance. Whetzel et al., (2010) found
no significant differences between the fit of a quadratic and linear function of the detail
conscious and performance of financial service people therefore a linear function assumed.
Perfectionism literature has also been used to shape the hypothesis for the detail conscious
trait. A quadratic relationship was shown to exist between perfectionism and performance by
Wigert et al., (2012). This idea was supported by Shoss, Callison and Witt (2014) who found
a curvilinear relationship with perfectionism and organisational citizenship behaviour
performance. The hypothesis for the detail conscious trait was generated based on the
evidence displayed by more recent research showing that it is likely for a curvilinear
relationship with performance to exist. The hypothesis for this trait is as follows.
H2: Detail Conscious will show a better fit with a curvilinear function than a linear
function with air traffic control job performance
Conscientiousness
Past research has produced mixed results for the function of the conscientiousness and
performance relationship. In early research, Robie and Ryan (1999) found evidence for a
linear relationship with employees in both the public and private sector. Le et al., (2011)
supported this through finding a linear relationship for the performance within complex jobs.
high intellectual demands (Oswald et al., 1999). These results fall in line with the results
from the organisation’s validation studies where a positive linear relationship was found with
air traffic control performance. In contrast, La Huis, Martin and Avis (2005) found non-linear
relationships between conscientiousness and clerical employee performance. For
non-complex jobs, jobs that are more routine/repetitive (Oswald et al., 1999), Le et al., (2011)
found curvilinear relationships. Through comparison of the linear and quadratic function,
Whetzel et al., (2010) found strong evidence of a quadratic function for the relationship
between conscientiousness and the performance of financial service employees. Due to the
results from the organisation’s validation studies and the fact that air traffic control is more of
a complex job, the hypothesis for the relationship between conscientiousness and air traffic
controller performance is as follows.
H3: Conscientiousness will show better fit with a linear function than a curvilinear
function for its relationship with air traffic controller performance
Adaptable
There is limited literature relating the adaptable trait to job performance however
when using psychological flexibility as the predictor, a positive linear relationship was found
with job performance for customer service entry level roles (Bond & Flaxman, 2006). These
findings supported the research done by both Hayes et al., (1999) and Bond and Bunce
(2003). Suresh et al., (2012) conducted a study on 87 controllers comparing scores on 7
personality factors with air traffic controller performance. It was found that there was a
positive relationship between adjustment and performance however the function of this
relationship was not specified (Suresh et al., 2012). Whetzel et al., (2010) found evidence for
a quadratic function being a better fit than the linear function for the adaptable trait and
al., (2010) which showed evidence of a quadratic function, the hypothesis form the adaptable
trait is as follows.
H4: Adaptable will show a better fit with a curvilinear function than a linear function
for its relationship with air traffic controller performance.
Decisive
Minimal research exists exploring the relationship between decisiveness and job
performance, however the organisation’s validation studies identified a positive linear
relationship between the decisiveness trait and air traffic controller performance. Whetzel et
al., (2010) found no significant differences between the quadratic and linear function of
decisiveness and the performance of financial employee. Assertiveness was also used to
create the hypothesis for this trait and was found to have a positive relationship with team
member performance (Pearsell, 2006). Due to this research leaning towards this trait having a
linear relationship with job performance, and no evidence to suggest the presence of a more
curvilinear relationship, the hypothesis for the decisiveness trait is as follows.
H5: Decisiveness will show a better fit for the linear function than the curvilinear
function for its relationship with air traffic controller performance.
Relaxed
The relaxed trait was identified through the validation studies to have a positive linear
relationship with air traffic control performance. Due to a lack of research, the phrase
calmness has been used in relation to job performance and creating the hypothesis. Robinson
(2009) found that a lack of calmness had a negative linear relationship with problem solving
performance therefore would indicate that being calm may have a positive relationship with
job performance. Minimal differences were identified by Whetzel et al., (2010) between the
services people. Based on the research by Robinson (2009) and the result of the validation
study by the organisation regarding the performance of air traffic controllers, the hypothesis
for the relaxed trait is as follows.
H6: Relaxed will show a better fit for the linear function than the curvilinear function
for its relationship with air traffic controller performance.
Achieving
Day and Silvermann (1989) found that higher scores in the achievement trait results in
higher overall performance in accountants (linear relationship). Alongside this, Ones et al.,
(2007) showed through a meta-analytic study involving 13 past research papers that
achievement predicts performance at 0.18. As mentioned earlier, Suresh et al., (2012) used a
sample of air traffic controllers to identify relationships between personality factors and
performance. The results indicated that ambition had a positive linear relationship with
performance (Suresh et al., 2012). Using another relevant trait, Ziegler, Knogler and Buhner
(2009) found that competitiveness within school work was found to have a curvilinear
relationship with performance. Whetzel et al., (2012) found the two functions of linear and
quadratic to be similar in their fit of the relationship between the achieving trait and
performance of financial services personnel. Therefore, it appears that there is more evidence
to indicate that the relationship will be a positive linear relationship with air traffic controller
performance.
H7: Achieving will show a better fit for the linear function than the curvilinear
function for its relationship with air traffic controller performance.
Controlling
There is minimal research exploring the relationship between the controlling
significant positive relationship between controlling and air traffic control performance.
Research between the dominant trait and job performance was also used to develop the
hypothesis for the controlling trait. Krivogorsky and Burton (2011) found a positive linear
relationship between dominance and the performance of the organisation. Whetzel et al.,
(2010) found no evidence for a difference between the linear and quadratic functions for a
relationship between controlling and performance. Due to a lack of literature regarding this
trait, the hypothesis has been based off the results found from the organisation’s validation
study.
H8: Controlling will show a better fit for the linear function than the curvilinear
function for its relationship with air traffic controller performance.
Emotional Control
As with conscientiousness, the research regarding the relationship between emotional
control and job performance has produced mixed conclusions. Le et al., (2011) found that
emotional control/stability had a positive linear relationship with complex job performance.
As stated before, a complex job encompasses no routine tasks and high intellectual strain
whereas low complex jobs involve routine tasks (Oswald et al., 1999). The organisation’s
own validation studies supported this by finding a positive linear relationship between
emotional control and air traffic controller performance. Despite this, Barrick and Mount
(1991) argued that emotional control did not produce high predictive validity due to the fact
that it was being represented by the wrong function and should actually be curvilinear. Le et
al., (2011) also found a curvilinear relationship between emotional control/stability and
non-complex job performance. When comparing the fit of a linear and quadratic function for the
relationship between emotional control and job performance of financial service people,
job could be viewed as a complex job, coupled with the result of the organisation’s validation
studies, the hypothesis for the emotional stability trait is as follows.
H9: Emotional control will show a better fit for the linear function than the curvilinear
function for its relationship with air traffic controller performance.
Innovative
There is limited literature involving the innovativeness trait however Gilson (2008)
did indicate that creativity has a positive linear relationship with job performance. This falls
in line with the organisation’s validation studies that also found a significant positive linear
relationship with air traffic controller performance. When comparing a linear and quadratic
function, Whetzel et al., (2010) found minimal evidence for a quadratic fit as better than a
linear for the relationship between innovativeness and the performance of financial services
personnel. Based on the lack of research results indicating a curvilinear relationship, the
hypothesis for this trait is as follows.
H10: Innovative will show a better fit for the linear function than the curvilinear
function for its relationship with air traffic controller performance.
Vigorous
There is limited literature regarding the relationship between the vigorous trait and
job performance, however it was identified as having a significant positive linear relationship
with air traffic controller job performance through the organisation’s validation studies. Little
et al., (2011) found that higher vigour at work had a positive, linear relationship with job
performance in terms of organisational citizenship behaviours. Carmeli et al., (2009) also
found a significant 0.22 relationship between vigour and job performance within a sample of
290 managers from community centres. Whetzel et al., (2010) found no significant
differences between the fit of the linear and quadratic functions for the relationship between
overwhelming evidence shown for a linear relationship, the hypothesis for this trait is as
follows.
H11: Vigorous will show a better fit for the linear function than the curvilinear
function for its relationship with air traffic controller performance.
As well as testing the hypotheses, a further aim of this research is to create expectancy
tables to predict performance based on the personality traits that show a significant
relationship with air traffic control performance at the competency. An expectancy table has
been defined as a graphic display of the probabilities of successfulness of an applicant given
a score within a specific data set (Lawshe & Bolda, 1958). This will look to support the
selection process of the air traffic control provider in selecting the correct applicant for the air
traffic control job and predicting a high level of performance from the successful candidates.
In summary, this research is focused on validating the use of personality in selection
methods and identifying the most effective function for the personality-performance
relationship. Relevant literature has been reviewed and multiple hypotheses proposed that
will guide the direction of the research. The following sections will detail the method used
for the current study, as well as outline the results found, and discuss the implications of
Method Design
This study has one set of predictor variables, personality traits, and a set of criterion
variables measuring ATC performance. Both the predictor and criterion variable are broken
into multiple sub-variables. The personality variable consists of 32 traits that are classified as
sub-variables, whilst the performance measure has 8 different performance competencies as
its sub-elements. These sub-elements are treated individually for all analyses in the current
study. The study is a correlational study between personality and air traffic controller
performance.
Participants
The author was given access to three data sets: OPQ High Stakes, OPQ Low Stakes
and Performance Ratings. The number of participants within the data sets varied. Within the
high stakes personality data, the number of participants ranged from 21-60. This was due to
missing data occurring in some traits where participants had missed entire sections of the
OPQ measure. The low stakes personality data contained 117 participants whilst the
performance data gathered had 112 participants. Matching the data resulted in a combined
data set of N=90. Thus, during the second stage of analysis between personality and
performance, there were 90 participants with full data for both datasets therefore the sample
size for the regression analysis was 90. The missing data issue was remedied by excluding
cases list wise (i.e. remove if any data was missing). The tenure of participants ranged from
2.88 years to 48.41 years as at June 20th 2016. Gender was not measured as it is not
considered relevant to the current study.
The data was gathered through the author being given access to the data. This was
and the Air Traffic Control Union. All of the data used in the current study was from people
who were already employed as an air traffic controller within the Air Traffic Control provider
in New Zealand.
Materials
Personality
The same OPQ scales were used within both the low and high stakes conditions to
assess the air traffic controller’s personality. The OPQ contains 104 questions/items which
load onto 3 categories. Within each item, the participants were presented with 4 statements
from which they had to indicate which statement most accurately described them and which
was the least. Each participant received a sten score of between 1 and 10 for each personality
trait.
Performance
The type of performance measure being used is typical performance (Iddekinge &
Ployhart, 2008) as it is taken at only one-time point. To assess air traffic control performance,
eight performance competencies have been identified and are classified as second order
factors. These competencies are planning and time management, problem identification and
analysis, contextual decisions, communication, customer service, positive attitude towards
learning and change, teamwork and responsible and reliable. Within each of these
competencies, there are a number of behavioural indicators which are referred to as first order
factors. These behavioural indicators are the areas that are being rated/assessed by the
The first question within this performance measure assesses how well the manager
knew the performance of the employee they were assessing. This familiarity question was
measured using the scale displayed in Figure 3.
The remaining performance behavioural indicators were measured using the scale outlined in Figure 4.
Procedure
This study gained ethics approval from the Human Ethics Committee with the reference
number HEC 2016/39/LR.
Personality was measured within both the high stakes (recruitment) and low stakes (in
the year 2014) conditions using the OPQ personality measure. Within the high stakes
condition, the participants completed this within the pre-screening phase of the selection
process alongside aptitude testing and a screening interview. This was completed in a
controlled environment and standardised instructions were displayed on the computer of
which they completed the test on. In the low stakes condition, participants were asked to
complete the OPQ on its own and given standardised instructions prior to beginning the test.
3
1 2 4 5
Not well Somewhat well Well Very Well Extremely well
3
1 2 4 5
Much worse than required
Worse than required
Slightly worse than required
Slightly better than required
Better than required
6
Much better than required Figure 3. Performance rating – familiarity scale
The participants were told they were completing this in order to help validate and improve
the selection process. This has been classified as low stakes due to no outcome for the
individual being dependent on the outcome. All 32 traits were measured within both
conditions.
The performance data was collected in the year 2014 alongside the personality data from the
same year. Each appropriate manager was asked to rate each employee on the scale above
(Figure 4) against the behavioural indicators in Table 1. This was done individually without
Data Analysis
In order to conduct the analyses, version 22 of IBM SPSS was utilised. A detailed
data analysis plan was developed to guide the results of this study. The first part of the
analysis will focus on the accuracy of both the personality and the performance data. The
accuracy of the personality data will be assessed through a comparison of the data from the
high and low stake conditions. This will look to identify any possible response distortion and
will result in a final personality data selected and used in further analysis.
The performance data descriptive statistics will then be analysed with a focus on
identifying range restriction in the data. Significant correlations between any personality
traits and performance competencies will be found. These significant correlations will be
carried forward into a regression which will examine which function (linear or curvilinear) is
a better fit for each of the personality traits against each of the performance competencies.
Expectancy tables will be developed for each of the significant relationships and will identify
the likelihood of an applicant producing adequate ATC performance given a certain
Results
Personality Data Assessment
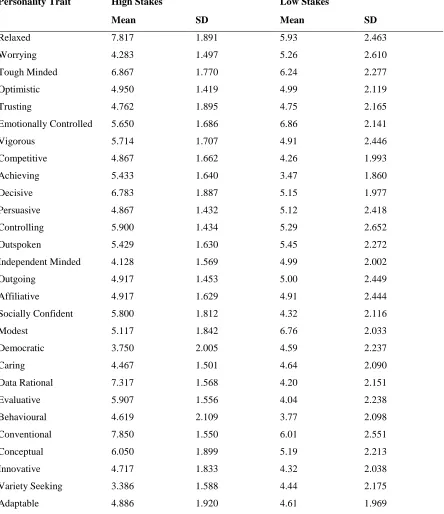
Table 2 displays the descriptive statistics for the 32 personality traits within both the
[image:37.595.80.524.245.759.2]high stakes (recruitment) and the low stakes (2014-time point) conditions.
Table 2. Means and standard deviations for the 32 personality traits at both time points
Personality Trait High Stakes Low Stakes
Mean SD Mean SD
Relaxed 7.817 1.891 5.93 2.463
Worrying 4.283 1.497 5.26 2.610
Tough Minded 6.867 1.770 6.24 2.277
Optimistic 4.950 1.419 4.99 2.119
Trusting 4.762 1.895 4.75 2.165
Emotionally Controlled 5.650 1.686 6.86 2.141
Vigorous 5.714 1.707 4.91 2.446
Competitive 4.867 1.662 4.26 1.993
Achieving 5.433 1.640 3.47 1.860
Decisive 6.783 1.887 5.15 1.977
Persuasive 4.867 1.432 5.12 2.418
Controlling 5.900 1.434 5.29 2.652
Outspoken 5.429 1.630 5.45 2.272
Independent Minded 4.128 1.569 4.99 2.002
Outgoing 4.917 1.453 5.00 2.449
Affiliative 4.917 1.629 4.91 2.444
Socially Confident 5.800 1.812 4.32 2.116
Modest 5.117 1.842 6.76 2.033
Democratic 3.750 2.005 4.59 2.237
Caring 4.467 1.501 4.64 2.090
Data Rational 7.317 1.568 4.20 2.151
Evaluative 5.907 1.556 4.04 2.238
Behavioural 4.619 2.109 3.77 2.098
Conventional 7.850 1.550 6.01 2.551
Conceptual 6.050 1.899 5.19 2.213
Innovative 4.717 1.833 4.32 2.038
Variety Seeking 3.386 1.588 4.44 2.175
Table 2 continued.
Personality Trait High Stakes Low Stakes
Mean SD Mean SD
Forward Thinking 5.083 1.889 4.34 1.839
Detail Conscious 7.783 1.075 5.86 2.105
Conscientiousness 6.650 1.338 4.27 1.910
Rule Following 8.810 1.327 6.02 2.084
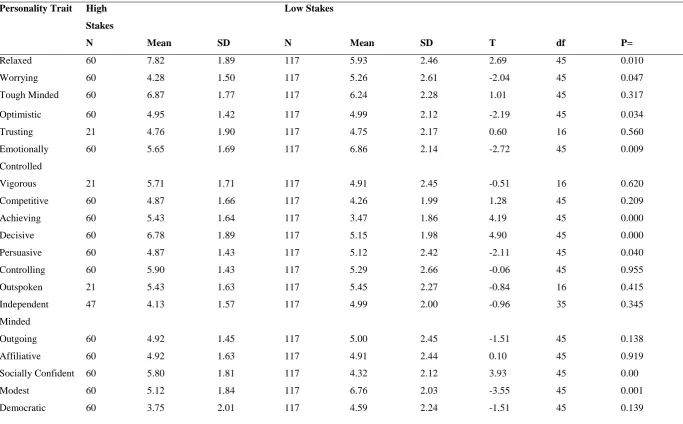
To test hypothesis 1 (presence of response distortion), and minimise any form of this
distortion within the current study, a paired (within sample) t test was completed for each of
the 32 personality traits across the two time points (high and low stakes). This aligns with the
ideologies put forward by Dunlap, Cortina, Vaslow and Burke (1996) (cited in Ellingson et
al., 2007) regarding using a within sample t test to avoid confounding variable issues. This
will identify whether any significant differences exist between the high and low stake
conditions within each of the 32 personality traits and, if significant difference are shown,
displays that there is the potential for response distortion to be present. It is important to
identify this prior to further analysis due to the potential for response distortion in a measure
to result in inaccurate information (Barrick et al., 1996). The idea involved in distorting data
is for the applicant to make themselves appear more favourable whilst compromising
accuracy (Paulhus, 1991), and is particularly prominent in personality measures (Edwards,
1953). Table 3 shows the results of this analysis.
To determine any differences, a visual analysis of the means of each trait within the
two conditions shown in Table 2 was conducted. From this, it appears that means are higher
in the high stakes condition for positive traits (i.e. Rule following) and lower in the high
stakes condition for negative traits (i.e. Worrying). This early analysis supports findings by
Hurtz and Alliger (2002) and indicates that within the data, participants were attempting to
display themselves more favourably by subconsciously scoring higher in the positive traits
results of the paired t test showed significant differences between the high and low stakes
condition for 17 of the traits and no significant differences in 15 traits at the 0.05 level. Due
to the visual analysis displaying potential for response distortion and the fact that 17 traits are
showing statistically significant differences between low and high stakes, the low stakes
personality data will be used for the remainder of analysis. This will look to decrease the
effect of inaccurate information (Barrick et al., 1996) that response distortion can have on the
rest of the analyses. The descriptive statistics for the low stakes personality data can be found
Table 3. The results of the paired sample t test for the OPQ personality measure across two different time points
Personality Trait High
Stakes
Low Stakes
N Mean SD N Mean SD T df P=
Relaxed 60 7.82 1.89 117 5.93 2.46 2.69 45 0.010
Worrying 60 4.28 1.50 117 5.26 2.61 -2.04 45 0.047
Tough Minded 60 6.87 1.77 117 6.24 2.28 1.01 45 0.317
Optimistic 60 4.95 1.42 117 4.99 2.12 -2.19 45 0.034
Trusting 21 4.76 1.90 117 4.75 2.17 0.60 16 0.560
Emotionally
Controlled
60 5.65 1.69 117 6.86 2.14 -2.72 45 0.009
Vigorous 21 5.71 1.71 117 4.91 2.45 -0.51 16 0.620
Competitive 60 4.87 1.66 117 4.26 1.99 1.28 45 0.209
Achieving 60 5.43 1.64 117 3.47 1.86 4.19 45 0.000
Decisive 60 6.78 1.89 117 5.15 1.98 4.90 45 0.000
Persuasive 60 4.87 1.43 117 5.12 2.42 -2.11 45 0.040
Controlling 60 5.90 1.43 117 5.29 2.66 -0.06 45 0.955
Outspoken 21 5.43 1.63 117 5.45 2.27 -0.84 16 0.415
Independent
Minded
47 4.13 1.57 117 4.99 2.00 -0.96 35 0.345
Outgoing 60 4.92 1.45 117 5.00 2.45 -1.51 45 0.138
Affiliative 60 4.92 1.63 117 4.91 2.44 0.10 45 0.919
Socially Confident 60 5.80 1.81 117 4.32 2.12 3.93 45 0.00
Modest 60 5.12 1.84 117 6.76 2.03 -3.55 45 0.001
Table 3 continued.
Personality Trait High
Stakes
Low Stakes
N Mean SD N Mean SD T df Sig.
Caring 60 4.47 1.50 117 4.64 2.09 -2.06 45 0.045
Data Rational 60 7.32 1.57 117 4.20 2.151 9.36 45 0.000
Evaluative 43 5.91 1.56 117 4.04 2.24 3.89 32 0.00
Behavioural 21 4.62 2.11 117 3.77 2.10 1.45 16 0.167
Conventional 60 7.85 1.55 117 6.01 2.55 4.63 45 0.00
Conceptual 60 6.05 1.90 117 5.19 2.21 1.59 45 0.118
Innovative 60 4.72 1.83 117 4.32 2.04 1.62 45 0.113
Variety Seeking 44 3.38 1.59 117 4.44 2.18 -3.52 33 0.001
Adaptable 44 4.89 1.92 117 4.61 1.97 1.26 33 0.218
Forward Thinking 60 5.08 1.90 117 4.34 1.84 0.76 45 0.452
Detail Conscious 60 7.78 1.08 117 5.86 2.11 6.45 45 0.00
Conscientiousness 60 6.65 1.34 117 4.27 1.91 6.99 45 0.00
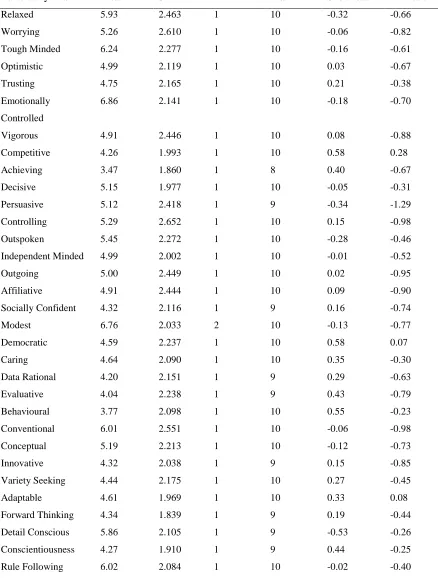
Table 4. Descriptive Statistics for the low stakes personality data
Personality Trait Mean SD Min Max Skewness Kurtosis
Relaxed 5.93 2.463 1 10 -0.32 -0.66
Worrying 5.26 2.610 1 10 -0.06 -0.82
Tough Minded 6.24 2.277 1 10 -0.16 -0.61
Optimistic 4.99 2.119 1 10 0.03 -0.67
Trusting 4.75 2.165 1 10 0.21 -0.38
Emotionally
Controlled
6.86 2.141 1 10 -0.18 -0.70
Vigorous 4.91 2.446 1 10 0.08 -0.88
Competitive 4.26 1.993 1 10 0.58 0.28
Achieving 3.47 1.860 1 8 0.40 -0.67
Decisive 5.15 1.977 1 10 -0.05 -0.31
Persuasive 5.12 2.418 1 9 -0.34 -1.29
Controlling 5.29 2.652 1 10 0.15 -0.98
Outspoken 5.45 2.272 1 10 -0.28 -0.46
Independent Minded 4.99 2.002 1 10 -0.01 -0.52
Outgoing 5.00 2.449 1 10 0.02 -0.95
Affiliative 4.91 2.444 1 10 0.09 -0.90
Socially Confident 4.32 2.116 1 9 0.16 -0.74
Modest 6.76 2.033 2 10 -0.13 -0.77
Democratic 4.59 2.237 1 10 0.58 0.07
Caring 4.64 2.090 1 10 0.35 -0.30
Data Rational 4.20 2.151 1 9 0.29 -0.63
Evaluative 4.04 2.238 1 9 0.43 -0.79
Behavioural 3.77 2.098 1 10 0.55 -0.23
Conventional 6.01 2.551 1 10 -0.06 -0.98
Conceptual 5.19 2.213 1 10 -0.12 -0.73
Innovative 4.32 2.038 1 9 0.15 -0.85
Variety Seeking 4.44 2.175 1 10 0.27 -0.45
Adaptable 4.61 1.969 1 10 0.33 0.08
Forward Thinking 4.34 1.839 1 9 0.19 -0.44
Detail Conscious 5.86 2.105 1 9 -0.53 -0.26
Conscientiousness 4.27 1.910 1 9 0.44 -0.25
Rule Following 6.02 2.084 1 10 -0.02 -0.40
Despite some large skewness and kurtosis statistics, after analysing the data in Table
traits were reasonably centralised. This along with the standard deviation values being
Performance Scale Assessment
Before the analysis of the relationship between the personality measure and
performance, the performance data needs to be analysed to ensure it is an accurate measure of
ATC performance. The first step in this is ensuring that the performance scales and their sub
elements (behavioural indicators) are contributing to the overall performance between
personality and performance.
Within the performance measures there are 8 different competencies with each
competency being made up of numerous behavioural indicators (see Appendix A). As part of
the process for validating the performance competency scales and to reduce any redundancy
in these scales, the extent to which the scales contribute to the overall relationship with the
personality traits was analysed. Point-to-point correspondence will be tested and achieved
through ensuring that there is a relationship between each part of the performance measure
and at least one personality trait. To indicate this, the relationship between all personality
traits and all behavioural indicators (as well as the overall competency) was calculated and
can be seen in Tables 5-12. Overall, there were 97 significant linear relationships found
between personality traits and behavioural indicators and 15 at the overall competency level.
Within these tables, the overall performance competency is separated from the subsequent