ANALYSIS OF NITROGEN BASES ALTERATIONS IN DNA AND RNA
CAUSED BY AIR POLLUTANTS BY QUANTUM METHODS
María Deyanira Loya-Vargas1, Lázaro Balan-Rodríguez2, Leonardo Tejero-Jiménez2, Manuel González-Pérez3*
1
Instituto Tecnológico de Ciudad Madero
2
Universidad Juárez Autónoma de Tabasco (UJAT), División Académica Multidisciplinaria
de los Ríos (DAMR) 3
Universidad Popular Autónoma del Estado de Puebla (UPAEP) S.N.I.-1.
ABSTRACT
Currently, air pollution is a worldwide problem, where the main air
pollutants are sulfur dioxide (SO2), nitrogen oxides (NxOx), carbon
oxides (COx), particulate matter (PM), ozone (O3) and Pb due its high
concentration and impact they cause. The relation of the bases is the
key, and the structure of DNA has important implications, allowing
processes such as DNA replication and RNA translation into protein.
The formation of protein-nucleic acid associations proceeds through
hydrogen bonds. The simulations realized with molecular simulator
Hyper Chem (HC). We performed electronic interactions between
molecules of the same, the interactions of cross-bands of the
nitrogenous bases and the interactions of cross-bands of air pollutants. From these
simulations we infer as the principal contribution of this study, that C can be confused with
the N2O3, G can be confused with SO2; CO2; CO; O3 and with the Pb in the genesis of RNA.
Because the similar value of ETC of C:G. With these findings, another avenue to explain the
oncogenic and mutagenic effects of N2O3, SO2, CO2, CO, O3 and the Pb on the human body
are proposed in conjunction with the novel ETC method.
KEYWORDS: Air pollutants, Nitrogenous bases, Cancer, Quantum Methods.
Volume 5, Issue 8, 249-262. Research Article ISSN 2277– 7105
*Corresponding Author
Dr. Manuel
González-Pérez
Universidad Popular Autónoma del Estado de Puebla (UPAEP) S.N.I.-1. Article Received on 14 June 2016,
Revised on 03 July 2016, Accepted on 24 July 2016
INTRODUCTION a. Air pollutants
Currently, air pollution is a worldwide problem, caused by a lot of amount of pollutants
emitted by fossil combustion processes, from the chemical industry, thermoelectric [1], and
overexploitation of natural resources. The main air pollutants are sulfur dioxide (SO2),
nitrogen oxides (NxOx), carbon oxides (COx), particulate matter (PM), ozone (O3) and Pb
[2-5]
due its high concentration and impact they cause. In investigations, it has shown that air
pollutants cause diseases respiratory, diseases skin diseases cardiovascular [6-11]. Fine
particles and sulfur dioxide increase the risk of heart disease among people of low social
class especially African Americans [12]. The main air pollutants that cause effects in the skin
are solar UV, HAP, VOC, NOx, PM, O3, radiation and cigarette smoke can contribute to skin
aging, atopic dermatitis, skin cancer, psoriasis and acne [13]. Epidemiological studies show
that long-term exposure to particulate matter is related to an increased risk of cancer [14].
Research conducted they found evidence that exposure to fine particles has a significant
increase in mortality from lung cancer, even after controlling for smoking, occupational
exposure, and other risk factors [15].
b. Nitrogenous bases
The form double helical from DNA in its more common forms gives stability to preserve the
genetic information of this vital molecule of Life [16-17].
Nitrogenous bases are those that contain genetic information. In the case of DNA, are bases
purines and pyrimidines. Purines are adenine (A) and guanine( G). Pyrimidines are thymine
(T) and cytosine (C). In the case of RNA are also four bases, two purines, and two
pyrimidines. Purines are A and G and pyrimidines are cytosine (C) and uracil (U).
The nitrogenous bases are complementary to each other, form pairs just as they would a key
and a lock. Adenine and thymine are complementary (A-T), as guanine and cytosine (G-C),
in the RNA is not exists the thymine, complementarity is between adenine and uracil (A-U).
The relation of the bases is the key, and the structure of DNA has important implications,
allowing processes such as DNA replication and RNA translation into protein. The formation
c. Quantum computational methodology
Quantum chemistry it is a science that expresses the fundamental behavior of matter at the
molecular scale mathematically [19]. Quantum chemistry has several uses one of them is the
study of the behavior of atoms and molecules in their optical, electrical, magnetic,
mechanical properties, chemical reactivity, its redox properties, and so on. Friedrich Hund
and Robert S. Mulliken developed the molecular orbital theory, an alternative method in
where described the electrons by mathematical functions delocalized throughout the
molecule. The method Hund-Mulliken (or molecular orbital) virtually, is the most widely
used in recent years as the most powerful predictor properties. Computational quantum
chemistry-based methods identify identity also more stable molecular systems which
tautomers for the common chemical knowledge is not enough to make definitive
predictions[20].
Computational methods are imperative in predicting chemical and biochemical reactions.
These methods can save time, materials and reagents in laboratory experiments[21].
For this work, we explored the molecular interactions of air pollutions and the nitrogenous
bases of DNA and RNA by the quantum method SE-PM3.
II. METHODOLOGY a. Abbreviations
Occupied Molecular Orbital higher (HOMO). Molecular lowest unoccupied orbital (LUMO).
Band Gap (BG). Negative energy (E). Positive energy (E+). Electrostatic potential (EP).
Electronic transfer coefficient (ETC).
b. Computational methods
The simulations realized with molecular simulator Hyper Chem (HC). (Hyper Chem.
Hypercube, MultiON for Windows. Serial #12-800-1501800080. MultiON. Insurgentes Sur
1236 - 301 Tlacoquemecatl Col. del Valle, Delegación Benito Juárez, D. F., México CP.
03200) [22].
The computational model used was; HC Semi-Empirical Parameterized Model number 3
(SE- PM3) to draw the corresponding molecules. These were then processed using SE-PM3
We calculate the computational quantum chemistry variables: HOMO-LUMO, BG, EP and
other properties, resulting in a Tab-delimited Table for BG and EP.
The specific parameters selected for each of the simulations were as follows: SET UP.
Semi-Empirical Method: PM3. Semi-Semi-Empirical Options: Charge and Spin. Total Charge 0. Spin
Multiplicity 1. SCF Control. Converge limit 0.01. Interaction limit 1000. Accelerate converge
Yes. Spin Pairing Lowest. Overlap Weighting Factors Sigma-Sigma 1, Pi-Pi 1.
Polarizabilities do not calculate.
Computation 1. Geometry Optimization. Algorithm Polak Ribiere (conjugate gradient).
Options Termination conditions. RMS gradient of 0.1 kcal/mol or 1000 maximum cycles. In
vacuo yes. Screen refresh period one cycles [22].
Computation 2. Orbitals. Plot Orbital Options Isosurface Rendering. Orbital Contour Value
0.05. Rendering Wire meshes Isosurface Grid. Grid meshes size Coarse. Grid layout Default.
Gird contour Default. Transparency level Default [22].
Computation 3. Plot Molecular Graphs. Plot Molecular Options. Molecular Properties.
Properties. Electrostatic Potential Yes. Representations. 3D Mapped Isosurface. Grid Mesh
Size Coarse. Grid layout Default. Contour gird Default. Isosurface Rereading. Total Charge
Density Contour Value (TCDCV) 0.015. Rendering Wire mesh [22]. Transparency level
Default. Mapped Options Functions Default.
c. Formulas
The calculations based on the theory of ETC [23]. This theory is calculating the ratio of
dividing the BG / EP. This ratio Indicates the multiples of the EP ITS That the electron jumps
BG [19].
(1)
The EP is equal to the absolute value of the difference (E+) – (E-).
(2)
The BG is equal to the absolute value of the difference (HOMO) – (LUMO) [22-24].
III. RESULT AND DISCUSSION
Table 1 shows the results obtained. We performed electronic interactions between molecules
of the same column sorted by ETC; this order indicates the stability of substances. The
interplay 1 (G:G) is the most stable, and interaction 12 (Pb) is the least stable. The most
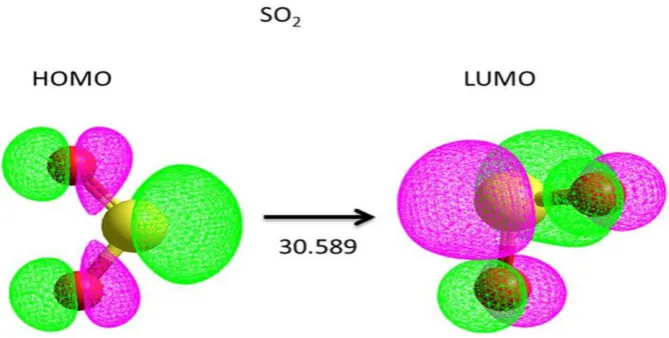
[image:5.595.133.468.192.361.2]unstable molecule is the O3.
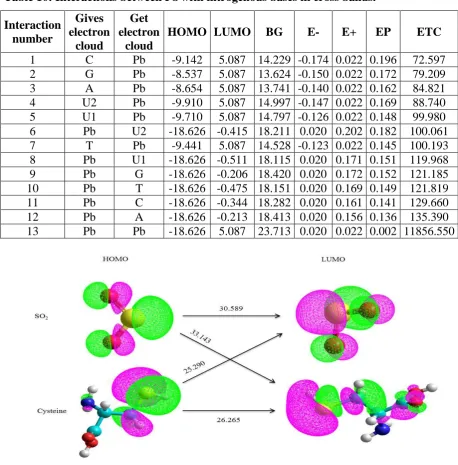
[image:5.595.45.558.420.650.2]Fig. 1 interaction between two molecules of Sulfur dioxide
Table 1. Electronic interactions between molecules of the same chemical species. Interaction
number
Gives electron
cloud
Get electron
cloud
HOMO (eV)
LUMO (eV)
BG (eV)
E- (eV/a0)
E+ (eV/a0)
EP
(eV/a0) ETC*
1 G G -8.537 -0.206 8.331 -0.150 0.172 0.322 25.872
2 C C -9.142 -0.344 8.799 -0.174 0.161 0.335 26.265
3 U2 U2 -9.910 -0.415 9.495 -0.147 0.202 0.349 27.208
4 A A -8.654 -0.213 8.441 -0.140 0.156 0.296 28.518
5 SO2 SO2 -10.551 1.530 12.082 -0.147 0.248 0.395 30.589
6 T T -9.441 -0.475 8.966 -0.123 0.169 0.292 30.707
7 U1 U1 -9.710 -0.511 9.200 -0.126 0.171 0.297 30.975
8 N2O3 N2O3 -11.108 -0.799 10.309 -0.051 0.188 0.239 43.135
9 CO2 CO2 -12.735 1.036 13.772 -0.072 0.164 0.236 58.356
10 CO CO -13.027 1.000 14.027 -0.057 0.131 0.188 74.616
11 O3 O3 -13.007 -0.616 12.391 -0.034 0.075 0.109 113.682
12 Pb Pb -18.626 5.087 23.713 0.020 0.022 0.002 11856.55
*The ETC is considered dimensionless. Energy unit is the electron volt (eV).
The unit of Electrostatic Potential is (electron - volt) / Angstroms.
The reactivity behaves in the opposite direction. From the least to ETC = 113.682 are the
highest among all substances in Table 1. This interaction 11 belongs to the molecule of O3
Therefore; the order of the ETCs indicates that the Pb, O3, CO, N2O3 attacks anyone of
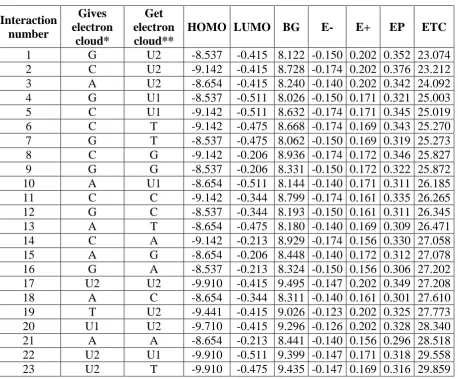
Table 2 shows the interactions of cross-bands of the nitrogenous bases. We tabulated by the
ETC values (last column). It was according to the Lane prediction [25].
The lower ETC = 23.074 belong to the interaction G:U2. This interaction is a mispair
occurring DNA or RNA. G:U1 or G:U2. The glycosylase removed mispairs from DNA by
uracil-DNA (UDG) [26-28] UDG is highly specific for U and shows no activity towards any
other base. Specifics for U and shows no activity towards any other based [28-29].
In general, the base pair partner of the U is not recognized, and the enzyme also acts on A:U
base pairs that arise through misincorporation during DNA replication [29-30].
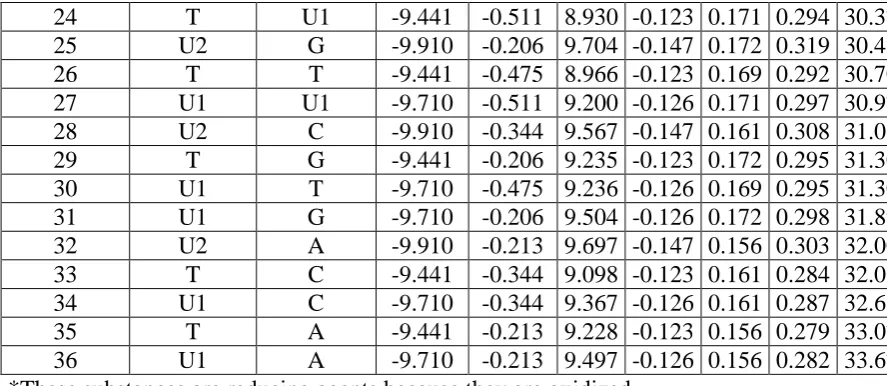
Furthermore, we can speculate that the small differences between the bases ETCs indicate
that the probability of unwanted combined pairs of both DNA and RNA are high. Therefore,
[image:6.595.72.531.379.758.2]mutations are very likely in different directions of flow of electrons [23].
Table 2. Electronic interactions between molecules nitrogenized bases. Cross band.
Interaction number
Gives electron
cloud*
Get electron cloud**
HOMO LUMO BG E- E+ EP ETC
1 G U2 -8.537 -0.415 8.122 -0.150 0.202 0.352 23.074
2 C U2 -9.142 -0.415 8.728 -0.174 0.202 0.376 23.212
3 A U2 -8.654 -0.415 8.240 -0.140 0.202 0.342 24.092
4 G U1 -8.537 -0.511 8.026 -0.150 0.171 0.321 25.003
5 C U1 -9.142 -0.511 8.632 -0.174 0.171 0.345 25.019
6 C T -9.142 -0.475 8.668 -0.174 0.169 0.343 25.270
7 G T -8.537 -0.475 8.062 -0.150 0.169 0.319 25.273
8 C G -9.142 -0.206 8.936 -0.174 0.172 0.346 25.827
9 G G -8.537 -0.206 8.331 -0.150 0.172 0.322 25.872
10 A U1 -8.654 -0.511 8.144 -0.140 0.171 0.311 26.185
11 C C -9.142 -0.344 8.799 -0.174 0.161 0.335 26.265
12 G C -8.537 -0.344 8.193 -0.150 0.161 0.311 26.345
13 A T -8.654 -0.475 8.180 -0.140 0.169 0.309 26.471
14 C A -9.142 -0.213 8.929 -0.174 0.156 0.330 27.058
15 A G -8.654 -0.206 8.448 -0.140 0.172 0.312 27.078
16 G A -8.537 -0.213 8.324 -0.150 0.156 0.306 27.202
17 U2 U2 -9.910 -0.415 9.495 -0.147 0.202 0.349 27.208
18 A C -8.654 -0.344 8.311 -0.140 0.161 0.301 27.610
19 T U2 -9.441 -0.415 9.026 -0.123 0.202 0.325 27.773
20 U1 U2 -9.710 -0.415 9.296 -0.126 0.202 0.328 28.340
21 A A -8.654 -0.213 8.441 -0.140 0.156 0.296 28.518
22 U2 U1 -9.910 -0.511 9.399 -0.147 0.171 0.318 29.558
*These substances are reducing agents because they are oxidized.
[image:7.595.68.512.71.264.2]**These substances are oxidizing agents because they are reduced.
Table 3 shows the possible “allowed interactions” between the nitrogenous bases in DNA and
RNA. The difference between ETCs interactions cross bands is minimum. This affirmation
leads us to say that any of them occurs easily and reaffirms the formation of hydrogen bond
of low energy.
The ETC = 24.092 corresponding to the interaction A:U2 is the lowest of the table. This
lowest ETC means that is the most likely to occur under these conditions.
Table 3. Possibles pairs interactions between the nitrogenous bases in DNA and RNA.
This table is a part of Table 2.
Table 4 shows the lowest energy interactions of the four hydrogen bonds of the nitrogenous
bases in DNA and RNA. The divergence between the highest and the lowest value for the
ETCs in Table 4 is 2.38; The interactions 3, 10 and 13 show the best affinity of the A for the
U2 and U1 than the T.
24 T U1 -9.441 -0.511 8.930 -0.123 0.171 0.294 30.375
25 U2 G -9.910 -0.206 9.704 -0.147 0.172 0.319 30.420
26 T T -9.441 -0.475 8.966 -0.123 0.169 0.292 30.707
27 U1 U1 -9.710 -0.511 9.200 -0.126 0.171 0.297 30.975
28 U2 C -9.910 -0.344 9.567 -0.147 0.161 0.308 31.061
29 T G -9.441 -0.206 9.235 -0.123 0.172 0.295 31.305
30 U1 T -9.710 -0.475 9.236 -0.126 0.169 0.295 31.307
31 U1 G -9.710 -0.206 9.504 -0.126 0.172 0.298 31.894
32 U2 A -9.910 -0.213 9.697 -0.147 0.156 0.303 32.004
33 T C -9.441 -0.344 9.098 -0.123 0.161 0.284 32.033
34 U1 C -9.710 -0.344 9.367 -0.126 0.161 0.287 32.637
35 T A -9.441 -0.213 9.228 -0.123 0.156 0.279 33.076
36 U1 A -9.710 -0.213 9.497 -0.126 0.156 0.282 33.679
Interaction number
Gives electron
cloud
Get electron
cloud
HOMO LUMO BG E- E+ EP ETC
3 A U2 -8.654 -0.415 8.240 -0.140 0.202 0.342 24.092
8 C G -9.142 -0.206 8.936 -0.174 0.172 0.346 25.827
10 A U1 -8.654 -0.511 8.144 -0.140 0.171 0.311 26.185
12 G C -8.537 -0.344 8.193 -0.150 0.161 0.311 26.345
13 A T -8.654 -0.475 8.180 -0.140 0.169 0.309 26.471
32 U2 A -9.910 -0.213 9.697 -0.147 0.156 0.303 32.004
35 T A -9.441 -0.213 9.228 -0.123 0.156 0.279 33.076
Table 4. The lowest energy interactions of the four hydrogen bonds of the nitrogenous bases in DNA and RNA.
This table is a part of Table 3.
* The Interactions of lower energy (more stable) for the DNA.
* *The Interactions of less energy (more stable) for the RNA.
The next tables show the interactions between the principal air pollutants with nitrogenous
bases in crossbands.
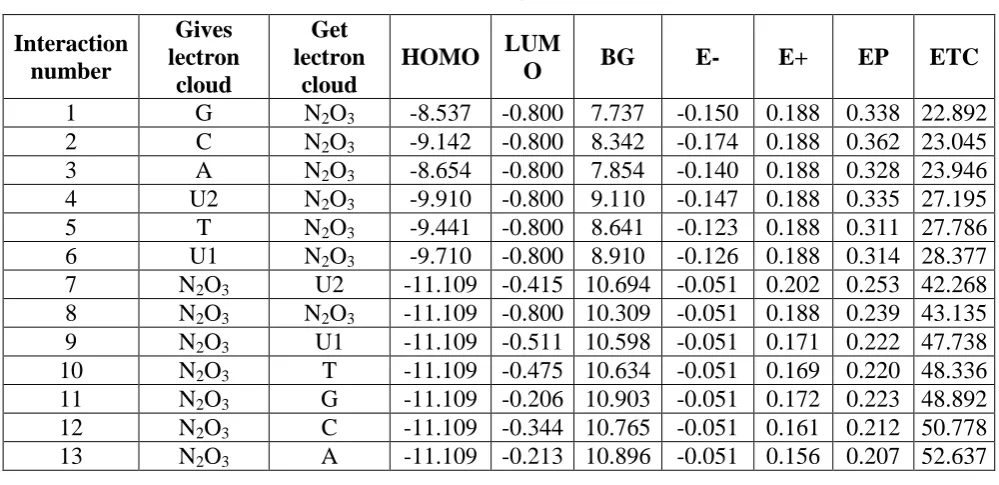
Table 5 lists the interactions between N2O3 with nitrogenous bases in crossbands. The ETC =
24.092 (Table 4 A:U2) and ETC = 22.892 of (Table 5 G:N2O3) are nearly equal. This
comparison indicates that the N2O3 competes with A by U2. This competition allows N2O3
can be confused with the A. The probability of that this confusion causes a mutation, is very
high.
The ETC = 26.471, (Table 4 A:T) and ETC = 27.195 (Table 5 U2: N2O3) are similar and can
[image:8.595.48.548.530.772.2]also cause confusion.
Table 5. Interactions between N2O3 with nitrogenous bases in cross bands.
Interaction number
Gives lectron
cloud
Get lectron
cloud
HOMO LUM
O BG E- E+ EP ETC
1 G N2O3 -8.537 -0.800 7.737 -0.150 0.188 0.338 22.892
2 C N2O3 -9.142 -0.800 8.342 -0.174 0.188 0.362 23.045
3 A N2O3 -8.654 -0.800 7.854 -0.140 0.188 0.328 23.946
4 U2 N2O3 -9.910 -0.800 9.110 -0.147 0.188 0.335 27.195
5 T N2O3 -9.441 -0.800 8.641 -0.123 0.188 0.311 27.786
6 U1 N2O3 -9.710 -0.800 8.910 -0.126 0.188 0.314 28.377
7 N2O3 U2 -11.109 -0.415 10.694 -0.051 0.202 0.253 42.268
8 N2O3 N2O3 -11.109 -0.800 10.309 -0.051 0.188 0.239 43.135
9 N2O3 U1 -11.109 -0.511 10.598 -0.051 0.171 0.222 47.738
10 N2O3 T -11.109 -0.475 10.634 -0.051 0.169 0.220 48.336
11 N2O3 G -11.109 -0.206 10.903 -0.051 0.172 0.223 48.892
12 N2O3 C -11.109 -0.344 10.765 -0.051 0.161 0.212 50.778
13 N2O3 A -11.109 -0.213 10.896 -0.051 0.156 0.207 52.637
Interaction number
Gives electron
cloud
Get electron
cloud
HOMO LUMO BG E- E+ EP ETC
3** A U2 -8.654 -0.415 8.240 -0.140 0.202 0.342 24.092
8* C G -9.142 -0.206 8.936 -0.174 0.172 0.346 25.827
10* A U1 -8.654 -0.511 8.144 -0.140 0.171 0.311 26.185
Table 6. Interactions between SO2 with nitrogenous bases in cross bands.
Interactio n number
Gives lectron
cloud
Get lectron
cloud
HOMO LUMO BG E- E+ EP ETC
1 C SO2 -9.142 1.531 10.673 -0.174 0.248 0.422 25.290
2 G SO2 -8.537 1.531 10.068 -0.15 0.248 0.398 25.295
3 A SO2 -8.654 1.531 10.185 -0.14 0.248 0.388 26.249
4 U2 SO2 -9.910 1.531 11.441 -0.147 0.248 0.395 28.964
5 SO2 U2 -10.552 -0.415 10.137 -0.147 0.202 0.349 29.045
6 T SO2 -9.441 1.531 10.972 -0.123 0.248 0.371 29.573
7 U1 SO2 -9.710 1.531 11.241 -0.126 0.248 0.374 30.056
8 SO2 SO2 -10.552 1.531 12.083 -0.147 0.248 0.395 30.589
9 SO2 U1 -10.552 -0.511 10.041 -0.147 0.171 0.318 31.575
10 SO2 T -10.552 -0.475 10.077 -0.147 0.169 0.316 31.888
11 SO2 G -10.552 -0.206 10.346 -0.147 0.172 0.319 32.432
12 SO2 C -10.552 -0.344 10.208 -0.147 0.161 0.308 33.143
13 SO2 A -10.552 -0.213 10.339 -0.147 0.156 0.303 34.122
Table 6 shows the interactions between SO2 with nitrogenous bases in cross bands. The ETC
= 26.471, (Table 4 A:T) and ETC = 26.249 (Table 6 A: SO2) are nearly equal. This
comparison indicates that the SO2 competes with A by T. This competition allows SO2 can be
confused with the A. The probability of that this confusion causes a mutation, is very high.
The ETC = 25.827 (Table 4 C:G) and ETC = 25.290 of (Table 6 C:SO2) are similar and can
[image:9.595.69.528.491.726.2]also cause confusion.
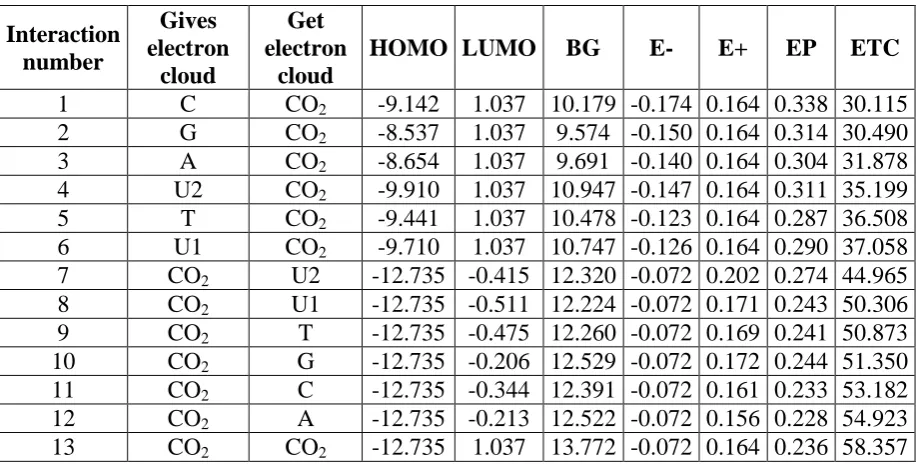
Table 7 Interactions between CO2 with nitrogenous bases in cross bands.
Interaction number
Gives electron
cloud
Get electron
cloud
HOMO LUMO BG E- E+ EP ETC
1 C CO2 -9.142 1.037 10.179 -0.174 0.164 0.338 30.115
2 G CO2 -8.537 1.037 9.574 -0.150 0.164 0.314 30.490
3 A CO2 -8.654 1.037 9.691 -0.140 0.164 0.304 31.878
4 U2 CO2 -9.910 1.037 10.947 -0.147 0.164 0.311 35.199
5 T CO2 -9.441 1.037 10.478 -0.123 0.164 0.287 36.508
6 U1 CO2 -9.710 1.037 10.747 -0.126 0.164 0.290 37.058
7 CO2 U2 -12.735 -0.415 12.320 -0.072 0.202 0.274 44.965
8 CO2 U1 -12.735 -0.511 12.224 -0.072 0.171 0.243 50.306
9 CO2 T -12.735 -0.475 12.260 -0.072 0.169 0.241 50.873
10 CO2 G -12.735 -0.206 12.529 -0.072 0.172 0.244 51.350
11 CO2 C -12.735 -0.344 12.391 -0.072 0.161 0.233 53.182
12 CO2 A -12.735 -0.213 12.522 -0.072 0.156 0.228 54.923
13 CO2 CO2 -12.735 1.037 13.772 -0.072 0.164 0.236 58.357
= 26.471, (Table 4 A:T) and ETC = 30.115 (Table 7 A: CO2) are nearly equal. This
comparison indicates that the CO2 competes with A by T. This competition allows CO2 can
be confused with the A. The probability of that this confusion causes a mutation, is very high.
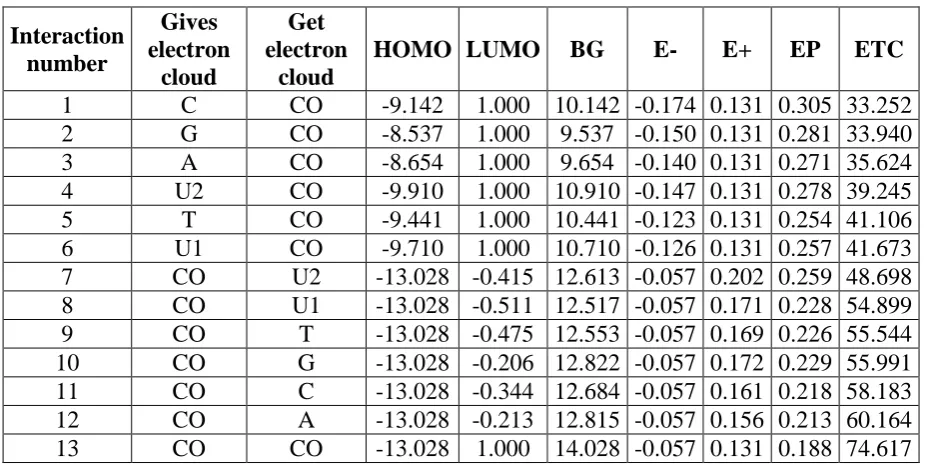
Table 8 shows the interactions between CO with nitrogenous bases in cross bands. The ETC
= 26.471, (Table 4 A:T) and ETC = 33.252 (Table 8 C:CO) are the option more probable.
This comparison indicates that the CO competes with A by T. This competition allows CO
[image:10.595.67.530.262.495.2]can be confused with the A. The probability of that this confusion causes a mutation, is high.
Table 8 Interactions between CO with nitrogenous bases in cross bands. Interaction
number
Gives electron
cloud
Get electron
cloud
HOMO LUMO BG E- E+ EP ETC
1 C CO -9.142 1.000 10.142 -0.174 0.131 0.305 33.252
2 G CO -8.537 1.000 9.537 -0.150 0.131 0.281 33.940
3 A CO -8.654 1.000 9.654 -0.140 0.131 0.271 35.624
4 U2 CO -9.910 1.000 10.910 -0.147 0.131 0.278 39.245
5 T CO -9.441 1.000 10.441 -0.123 0.131 0.254 41.106
6 U1 CO -9.710 1.000 10.710 -0.126 0.131 0.257 41.673
7 CO U2 -13.028 -0.415 12.613 -0.057 0.202 0.259 48.698
8 CO U1 -13.028 -0.511 12.517 -0.057 0.171 0.228 54.899
9 CO T -13.028 -0.475 12.553 -0.057 0.169 0.226 55.544
10 CO G -13.028 -0.206 12.822 -0.057 0.172 0.229 55.991
11 CO C -13.028 -0.344 12.684 -0.057 0.161 0.218 58.183
12 CO A -13.028 -0.213 12.815 -0.057 0.156 0.213 60.164
13 CO CO -13.028 1.000 14.028 -0.057 0.131 0.188 74.617
Table 9 shows the interactions between O3 with nitrogenous bases in cross bands. The ETC
= 26.471, (Table 4 A:T) and ETC = 34.240 (Table 9 C: O3) are the option more probable.
This comparison indicates that the O3 competes with A by T. This competition allows O3 can
[image:10.595.66.530.619.772.2]be confused with the A. The probability of that this confusion causes a mutation, is high.
Table 9 Interactions between O3 with nitrogenous bases in cross bands.
Interaction number
Gives electron
cloud
Get electron
cloud
HOMO LUMO BG E- E+ EP ETC
1 C O3 -9.142 -0.616 8.526 -0.174 0.075 0.249 34.240
2 G O3 -8.537 -0.616 7.921 -0.150 0.075 0.225 35.203
3 A O3 -8.654 -0.616 8.038 -0.140 0.075 0.215 37.385
4 U2 O3 -9.910 -0.616 9.294 -0.147 0.075 0.222 41.864
5 T O3 -9.441 -0.616 8.825 -0.123 0.075 0.198 44.569
6 U1 O3 -9.710 -0.616 9.094 -0.126 0.075 0.201 45.242
8 O3 U1 -13.008 -0.511 12.497 -0.034 0.171 0.205 60.960
9 O3 T -13.008 -0.475 12.533 -0.034 0.169 0.203 61.737
10 O3 G -13.008 -0.206 12.802 -0.034 0.172 0.206 62.144
11 O3 C -13.008 -0.344 12.664 -0.034 0.161 0.195 64.942
12 O3 A -13.008 -0.213 12.795 -0.034 0.156 0.190 67.341
13 O3 O3 -13.008 -0.616 12.391 -0.034 0.075 0.109 113.683
Table 10 shows the interactions between Pbwith nitrogenous bases in cross bands. The ETC
= 26.471, (Table 4 A:T) and ETC = 72.597 (Table 10 C:Pb) are the option more probable.
This comparison indicates that the Pbcompetes with A by T. This competition allows Pb can
[image:11.595.68.527.279.744.2]be confused with the A. The probability of that this confusion causes a mutation, is high.
Table 10: Interactions between Pbwith nitrogenous bases in cross bands. Interaction
number
Gives electron
cloud
Get electron
cloud
HOMO LUMO BG E- E+ EP ETC
1 C Pb -9.142 5.087 14.229 -0.174 0.022 0.196 72.597
2 G Pb -8.537 5.087 13.624 -0.150 0.022 0.172 79.209
3 A Pb -8.654 5.087 13.741 -0.140 0.022 0.162 84.821
4 U2 Pb -9.910 5.087 14.997 -0.147 0.022 0.169 88.740
5 U1 Pb -9.710 5.087 14.797 -0.126 0.022 0.148 99.980
6 Pb U2 -18.626 -0.415 18.211 0.020 0.202 0.182 100.061
7 T Pb -9.441 5.087 14.528 -0.123 0.022 0.145 100.193
8 Pb U1 -18.626 -0.511 18.115 0.020 0.171 0.151 119.968
9 Pb G -18.626 -0.206 18.420 0.020 0.172 0.152 121.185
10 Pb T -18.626 -0.475 18.151 0.020 0.169 0.149 121.819
11 Pb C -18.626 -0.344 18.282 0.020 0.161 0.141 129.660
12 Pb A -18.626 -0.213 18.413 0.020 0.156 0.136 135.390
[image:11.595.67.530.287.733.2]13 Pb Pb -18.626 5.087 23.713 0.020 0.022 0.002 11856.550
IV. CONCLUSIONS
We calculated the electronic interactions between molecules of the same chemical species of
air pollutants, Nitrogen bases or DNA and RNA. The interplay G:G is the most stable (ETC =
25.872) of all (Table 1) in concordance with the research by Lane [25]. The interaction Pb:Pb
is the least stable (ETC = 11856.550). The major unstable interactions are the Pb, CO and O3,
because of this instability can attack anyone of nitrogenous bases, mainly.
We calculated the interactions of cross-bands (Table 2) of the nitrogenous bases. This
calculation was according to with the Lane prediction in 1995[20]. We observed the lower
ETC = 25.872 belongs to the interaction G:G. This interaction is a mispair occurring DNA or
RNA.
As the principal contribution of this study, it can be inferred that C can be confused with the
N2O3, G can be confused with SO2; CO2; CO; O3 and with the Pb in the genesis of RNA.
Because the similar value of ETC of C:G.
With these findings, another avenue to explain the oncogenic and mutagenic effects of N2O3,
SO2, CO2, CO, O3 and the Pb on the human body are proposed in conjunction with the novel
ETC method.
REFERENCES
1. Muriel-García, M., Cerón-Bretón, R. M., & Cerón-Bretón, J. G. (2016). Air Pollution in
the Gulf of Mexico. Open Journal of Ecology, 6(01): 32.
2. Takeshita, T. (2011). Global scenarios of air pollutant emissions from road transport
through to 2050. International journal of environmental research and public health, 8(7):
3032-3062.
3. Rocha, S. N. G., Pérez, J. C., & Recio, J. M. B. (2016). Air Quality Trends in
Metropolitan Zones in Veracruz, México. Open Journal of Air Pollution, 5(02): 64.
4. Syed, A., Hew, K., Kohli, A., Knowlton, G., & Nadeau, K. C. (2013). Air pollution and
epigenetics. Journal of Environmental Protection, 4(08): 114.
5. Jinl, W. Status of air pollution in Beijing.
6. San José, R., Pérez, J. L., Pérez, L., González, R. M., Pecci, J., Garzón, A., & Palacios,
M. (2016). Impacts on the Urban Air Quality and Health of Global Climate Scenarios
Using Different Dynamical Downscaling Approaches. Journal of Geoscience and
7. Weli, V. E., Adegoke, J. O., & Kpang, M. B. (2016). The Epidemiology of
Cardio-Vascular Diseases in Relation to the Air Quality of Abattoirs in Port Harcourt,
Nigeria. World Journal of Cardiovascular Diseases, 6(04): 94.
8. Anderson, F. (2015). Assessing the Association between Heart Attack, High Blood
Pressure, and Heart Disease Mortality Rates and Particulate Matter and Socioeconomic
Status Using Multivariate Geostatistical Model. Occupational Diseases and
Environmental Medicine, 4(01): 8.
9. Cohen, A. J., ARDEN POPE III, C., & Speizer, F. E. (1997). Ambient air pollution as a
risk factor for lung cancer. Salud pública de México, 39(4): 346-355.
10.Nachman, K. E., & Parker, J. D. (2012). Exposures to fine particulate air pollution and
respiratory outcomes in adults using two national datasets: a cross-sectional
study. Environmental Health, 11(1): 1.
11.Moghtaderi, M., Zarei, M., Farjadian, S., & Shamsizadeh, S. (2016). Prediction of the
impact of air pollution on rates of hospitalization for asthma in Shiraz based on air
pollution indices in 2007-2012. Open Journal of Air Pollution, 5(02): 37.
12.Anderson, F., & Al-Thani, N. N. (2016). Female Head, Food Stamps, Ethnicity and Air
Pollution: Confounders or Causes of Heart Disease in Texas. Open Journal of
Epidemiology, 6(02): 146.
13.Drakaki, E., Dessinioti, C., & Antoniou, C. V. (2014). Air pollution and the skin.
Frontiers in Environmental Science, 2: 11.
14.Borgini, A., Ricci, C., Bertoldi, M., Crosignani, P., & Tittarelli, A. (2015). The
EuroLifeNet Study: How Different Microenvironments Influence Personal Exposure to
PM 2.5 among High-School Students in Milan. Open Journal of Air Pollution, 4(01): 16.
15.Hu, D., & Jiang, J. (2014). PM^ sub 2.5^ Pollution and Risk for Lung Cancer: A Rising
Issue in China. Journal of Environmental Protection, 5(8): 731.
16.Alberts, B., Johnson, A., Lewis, J., Raff, M., Roberts, K., & Walter, P. (1997). Molecular
Biology of the Cell (Garland Science, New York, 2002). There is no corresponding
record for this reference.
17.Manghi, M., & Destainville, N. (2016). Physics of base-pairing dynamics in
DNA. Physics Reports, 631: 1-41.
18.Sułkowska, A. (2002). Physical aspects of the interaction of pyrimidine and purine bases
with proteins. Journal of Spectroscopy, 16(3-4): 379-385.
19.Quantum Chemistry. The NIH Guide to Molecular Modeling. National Institutes of
20.Haranczyk, M., Urbaszek, P., Ng, E. G., & Puzyn, T. Combinatorial× computational×
cheminformatics (C3) approach to characterization of congeneric libraries of organic
pollutants. Journal of chemical information and modeling, 2012; 52(11): 2902-2909.
21.Perez, M. G., Barrera, F. A. G., Diaz, J. F. M., Torres, M. G., & Oglesby, J. M. L. (2014).
Theoretical calculation of electron transfer coefficient for predicting the flow of electrons
by PM3, using 20 amino acids and nicotine. European Scientific Journal, 10(27).
22.González-Pérez, M. (2015). Applied quantum chemistry. Analysis of the rules of
Markovnikov and anti-Markovnikov. International Journal of Science and Advanced
Technology, 5(5).
23.Perez, M. G., Barrera, F. A. G., Diaz, J. F. M., Torres, M. G., & Oglesby, J. M. L.
Theoretical calculation of electron transfer coefficient for predicting the flow of electrons
by pm3, using 20 amino acids, and nicotine. European Scientific Journal, 2014; 10(27).
24.González-Pérez, M. (2015) Methyl chloride vs. Ethyl Chloride. A demonstration of
quantum chemical theory by the experimental chemical. Volume 5 No 2 February.
25.Lane, A. N., & Peck, B. Conformational flexibility in DNA duplexes containing single G·
G mismatches. European Journal of Biochemistry, 1995; 230(3): 1073-1087.
26.Krokan HE, Bjoras M Base excision repair. Cold Spring Harb Perspect Biol, 2013; 5:
a012583.
27.Friedman JI, Stivers JT Detection of damaged DNA bases by DNA glycosylase enzymes.
Biochemistry, 2010; 49: 4957–4967.
28.Zharkov DO, Mechetin GV, Nevinsky GA Uracil-DNA glycosylase: Structural,
thermodynamic and kinetic aspects of lesion search and recognition. Mutat Res, 2010;
685: 11–20.
29.Lindahl T An N-glycosidase from Escherichia coli that releases free uracil from DNA
containing deaminated cytosine residues. Proc Natl Acad Sci USA 1974; 71: 3649–3653.
30.Tye BK, Nyman PO, Lehman IR, Hochhauser S, Weiss B Transient accumulation of
Okazaki fragments as a result of uracil incorporation into nascent DNA. Proc Natl Acad