www.wjpr.net Vol 6, Issue 17, 2017. 706
DEVELOPMENT AND VALIDATION OF STABILITY INDICATING
UPLC METHOD FOR ESTIMATION OF APIXABAN AND ITS
PROCESS RELATED IMPURITIES IN TABLET DOSAGE FORM
M. Madan Mohan Reddy*, D. Gowri Sankar and J. V. L. N. Seshagiri Rao
Department of Pharmaceutical Analysis, College of Pharmaceutical Sciences, Andhra
University, Visakhapatnam, Andhra Pradesh, Pin Code: 530003, India.
ABSTRACT
A validated Ultra Performance Liquid Chromatography (UPLC)
stability indicating method has been developed for determination of
Apixaban (APB) and its process related impurities as per ICH
guidelines in bulk and solid oral dosage forms in the presence of
degradation products. Reversed-phase chromatography was performed
on a UPLC BEH Waters C18 (50 x 2.1 mm; 1.7 m) with mobile phase
consists of phosphate buffer (pH 3.0), Acetonitrile in a gradient
proportion of 30:70 v/v respectively at a flow rate of 0.3 mL min-1.
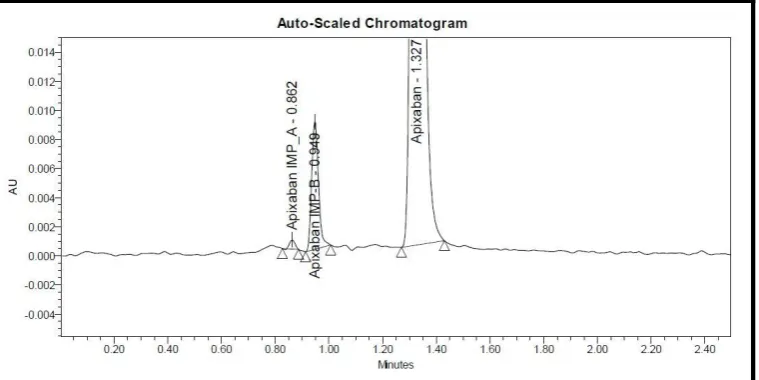
Detection was performed at 220 nm and a sharp peak was obtained for
Imp-A, Imp-B and APB at a retention time of 0.862, 0.953, 1.325
minutes respectively. Linear regression analysis data for the calibration
plot showed there was a good linear relationship between response and
concentration in the range 10-60 μg/mL for APB with regression
coefficient 0.9999 and for Imp-A and Imp-B is 0.625-3.75 μg/mL with the regression
coefficients 0.9994 and 0.9999 respectively. The LOD values for APB and Imp-A & B were
found to be 0.12 μg/mL, 0.06 μg/mL, 0.05 μg/mL & the LOQ values 0.40 μg/mL, 0.20
μg/mL, 0.16 μg/mL respectively. In order to determine whether the analytical method and
assay were stability-indicating, APB and Impurities was stressed under various conditions to
conduct forced degradation studies. Stability indicating forced degradation established studies
showed results that there is no interference of any degraded products and there is no
intererence from the excipients in the formulation. The detection of APB and the performed
assay is thus specific stability- indicating. The wide linearity range, sensitivity, accuracy,
*Corresponding Author M. Madan Mohan Reddy
Department of
Pharmaceutical Analysis, College of Pharmaceutical Sciences, Andhra
University, Visakhapatnam, Andhra Pradesh, Pin Code: 530003, India.
Volume 6, Issue 17, 706-726. Research Article ISSN 2277– 7105
Article Received on 26 October 2017,
Revised on 16 Nov. 2017, Accepted on 06 Dec. 2017
www.wjpr.net Vol 6, Issue 17, 2017. 707 short retention time, and simple mobile phase composition imply the method is suitable for
routine quantification of APB with high precision and accuracy.
KEYWORDS: Apixaban; Impurity A & B, Stability Indicating, UPLC.
INTRODUCTION
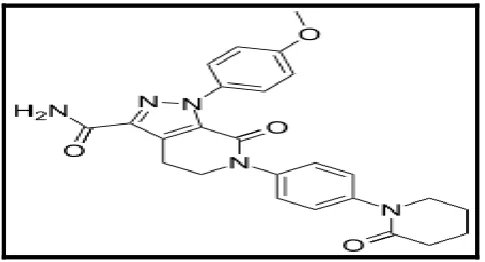
Apixaban is an specific novel anticoagulant drug chemically known as
l-(4-
methoxyphenyl)7-oxo-6-[4-(2-oxopiperidin-l-yl)phenyl]-4,5,6,7-tetrahydro-lH-pyrazolo[3,4-c]pyridine-3 carboxamide [Fig.1] and its process related impurities
1-(4-methoxyphenyl)-6-
[4-(2-methyl-6-oxopiperidin-1-yl)phenyl]-7-oxo-1H,4H,5H,6H,7H-pyrazolo[3,4-c]pyridine-3carboxamide. [Fig.2] And Isopropyl
1-(4-methoxyphenyl)-7-oxo-6-(4-(2-oxopiperidin-1-yl)phenyl)-4,5,6,7-tetrahydro-1H-pyrazolo[3,4-c]pyridine-3-carboxylate;4,5,6,7-Tetrahydro-1
(methoxyphenyl)-7-oxo-6-[4-(2-oxo-1-piperidinyl)
phenyl]-1H-pyrazolo[3,4-c]pyridine-3-carboxylic Acid [Fig.3] and sold under the brand name “Eliquis” to treat the people with
atrial fibrillation to lower the risk of stroke caused by a blood clot disorders. It was invented
by Aderis pharmaceuticals and was developed jointly by Pfizer and Bristol-Myers Squibb.
Apixaban is a selective, reversible, direct inhibitor of factor Xa indicated to reduce the risk of
stroke and systemic embolism in patients with non-valvular atrial fibrillation. “Eliquis” was
approved both in US and Europe on Dec 2012 and Jan 2010 respectively. “Eliquis” is also
used after hip or knee replacement surgery to prevent a type of blood clot called deep vein
thrombosis (DVT), which can lead to blood clots in the lungs (pulmonary embolism).[1-3]
Several analytical methods reported in the literature describe the investigation of
pharmacokinetics of Apixaban wherein the content of Apixaban and/or its metabolites were
studied in human plasma by liquid chromatography-mass spectrometry method[4-6] but failed
to provide the details of process-related impurities and degradation related impurities formed
under the stress conditions employed. One of the articles reported on stability indicating
HPLC method for Apixaban bulk drug sample has been found to be non-selective at our
end.[7-8]
Further, Apixaban is not yet official in any of the pharmacopoeia. Hence, we felt the need for
the development of a selective, fast and stability-indicating RP-UPLC method. To the best of
our knowledge, no proved stability indicating method has been reported for the determination
www.wjpr.net Vol 6, Issue 17, 2017. 708 quality control laboratory. The core-objective of this research work was to develop a fast,
precise, sensitive and stability-indicating RP-UPLC method for the determination of process
related impurities of Apixaban and its degradation behaviour process was studied at each
[image:3.595.177.420.167.298.2]level for understanding its degradation nature in all angles.[9-13]
Fig. 1: Chemical structure of Apixaban.
Fig. 2: Chemical structure of Apixaban Impurity-A.
Fig. 3: Structure of Apixaban Impurity-B.
MATERIALS AND METHODS
Experimental
Materials and methods
Pure sample of Apixaban (APB) and two impurities A and B were obtained from Eisai
[image:3.595.179.416.500.627.2]www.wjpr.net Vol 6, Issue 17, 2017. 709 HPLC grade. All other chemicals used were of AR grade. Apixaban (APB) Tablets were
purchased from local pharmacy.
Instrumentation
The analysis was performed using waters-2695(Model alliance) Ultra Performance liquid
chromatography Waters auto sampler–PDA detector by using, Empower-software version-2,
analytical balance (Mettler Toledo) UV/Visible-Detector (Standard cell) and data handling
system (Autochrome-3000), pH meter (lab India) and Sonicator. The column used is UPLC
BEH WATERS C18 (50 x 2.1 mm; 1.7 m) with the flow rate 0.3 ml/min.
Preparation of Potassium dihydrogen phosphate buffer (pH 3.0)
Accurately weighed 6.8 grams of KH2PO4 was taken in a 1000 ml volumetric flask, dissolved
and diluted to 1000 ml with HPLC water and the volume was adjusted to pH 3.0 with
orthophosphoric acid.
Preparation of Mobile phase
700 mL of acetonitrile (Phase A) and 300 mL of phosphate buffer (pH 3.0) (Phase B) were
mixed and degassed in an ultrasonic water bath for 10 min and then filtered through 0.45 µ
filter.
Preparation of Placebo Solution
The placebo solution was prepared by dissolving the specified amount excipients in mobile
phase.
Preparation of Standard solution
10 mg of apixaban was accurately weighed and transferred in to a 10 mL clean dry
volumetric flask and about 40 mL of diluent was added and sonicated to dissolve it
completely. The volume was made up to the mark with diluent (Stock solution).
3 mL of the above stock solution was pipette out into a 10 mL volumetric flask and the
contents diluted up to the mark with the diluent. This solution makes the working standard
(300 µg/mL of Apixaban).
Impurity stock solution preparation
25 mg each of Impurity –A and Impurity-B was accurately weighed and transferred into a
www.wjpr.net Vol 6, Issue 17, 2017. 710 each flask and sonicated to dissolve it completely. The volume was made up to the mark with
the diluent, then it was filtered through 0.44 micron Injection filter. This contains 250 µg/ml
of each impurity A and impurity B.
Impurity standard solution
1 ml each from the above standard solution of impurity A and B was pipetted out in to 10 ml
volumetric flask separately and the contents diluted up to the mark with the diluent. This
solution makes the impurity standard (25 µg/ml of each impurity A and B).
Preparation of binary mixture of apixaban, impurity A and impurity B
1 mL of standard solution (300 µg/mL of APB) and 1 mL each of impurity standard solution
(25 µg/mL of each Impurity standard A and B) into a 10 ml volumetric flask and make up
with the diluent. This solution gives apixaban 30 µg/mL and 2.5 µg/mL of each Impurity A
and B.
Preparation of sample solution
Ten tablets of each containing 2.5 mg apixaban were weighed and ground to a fine powder.
From this an amount equivalent to about 10 mg Apixaban was transferred into a 50 mL clean
dry volumetric flask. About 30 mL of diluent was added and sonicated it up to 30 mins to
dissolve it completely and volume made up to the mark with the same. Then it is filtered
through a 0.45 µm injection filter. Further, 1.5 mL of Apixaban from the above solution was
pipetted into a 10 mL volumetric flask and to it 1 mL of each Impurity A and Impurity B
added from their stock solutions (25 µg/ml). The content in the flask was mixed well and
diluted up to the mark with the diluent to get a concentration of 30 µg/mL of Apixaban, 2.5
µg/mL of Impurity A and B respectively.
Method validation
The method validation was done according to the ICH guidelines. The following validation
parameters i.e accuracy, precision, linearity, and specificity, LOD, LOQ and robustness and
Ruggedness were studied.
Forced degradation study
Forced degradation or Stress testing of a drug substance will help to identify the degradation
products, which can help to establish the intrinsic stability of the molecule. All stress
www.wjpr.net Vol 6, Issue 17, 2017. 711 along with impurity A and B. For the stability indicating study the Apixaban (APB)
undergoes acid, alkali and oxidation degradation, photolysis and heat condition.
RESULTS AND DISCUSSIONS
Method Development and Optimization
The UPLC procedure was optimized with a view to develop a suitable LC method for the
analysis of APB in fixed dose for bulk and combined dosage form and its impurities A and B.
It was found that mobile phase consists of potassium dihydrogen phosphate with buffer (pH
3.0), Acetonitrile in a gradient in proportion 30: 70 v/v and given acceptable retention time
for APB and impurity A and B, the theoretical plates, and good resolution for APB along
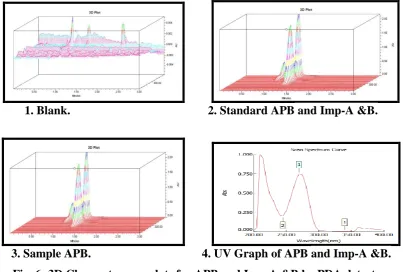
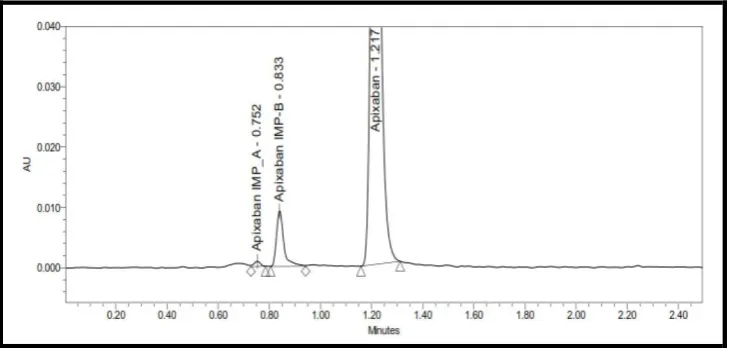
[image:6.595.103.493.307.491.2]with impurity A and B at the flow rate of 0.3 ml/min (Table.1; Fig. 4-6).
Fig. 4: Chromatogram of APB at 220 nm from bulk drug spiked with Imp-A &B.
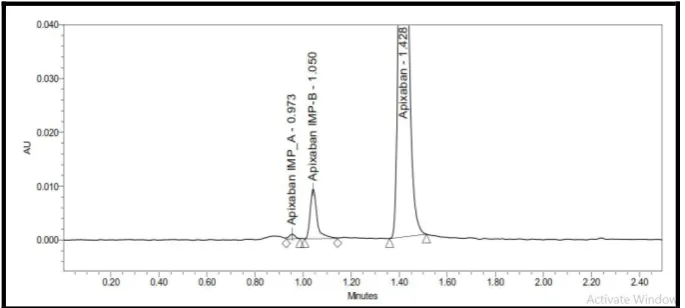
Fig. 5: Chromatogram of APB at 220 nm from pharmaceutical tablet formulation
[image:6.595.97.496.536.713.2]www.wjpr.net Vol 6, Issue 17, 2017. 712
1. Blank. 2. Standard APB and Imp-A &B.
[image:7.595.96.500.72.344.2]
3. Sample APB. 4. UV Graph of APB and Imp-A &B.
Fig. 6: 3D Chromatogram plots for APB and Imp-A &B by PDA detector.
Table 1: Optimized Chromatographic Conditions.
Column UPLC BEH WATERS C18 (50x 2.1mm;1.7 m)
Mobile Phase Acetonitrile –Phosphate Buffer (pH 3.0)-Gradient programing
Flow rate (mL/min) 0.3 mL/min
Run time (minutes) 3 min
Column temperature (°C) 30 °C
Volume of injection loop (l) 4 µL
Detection wavelength (nm) 220 nm
Retention time of Impurity A 0.862 min
Retention time of Impurity B 0.953 min
Retention time of Apixaban 1.325 min
Validation of Developed Method
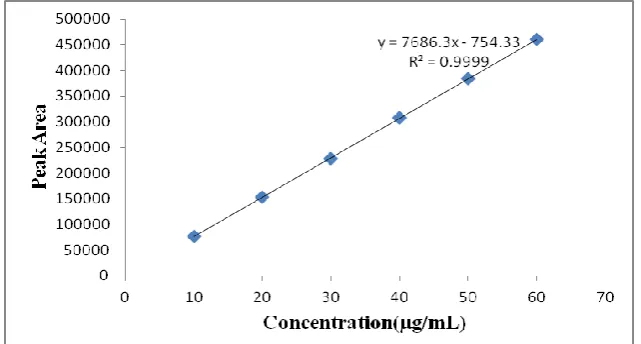
Linearity
For linearity study, standard apixaban solution with impurities A and B were taken at six
concentration levels and analysed. A linear plot was constructed between peak area versus
concentration. The corresponding regression coefficients were obtained from the plots and
the conc. range were found as for APB 10-60 µg/mL, for Imp. A and Imp. B 0.625 -3.75
µg/mL. The reports of drug were found to be linear in prepared concn range & a correlation
regression equation of APB was y= 7686.3x-754.33 with correlation coefficient 0.9999(Fig
7), Imp. A was y=1271 x +70.6 with correlation coefficient 0.9994 (Fig.8) and Imp.B was y =
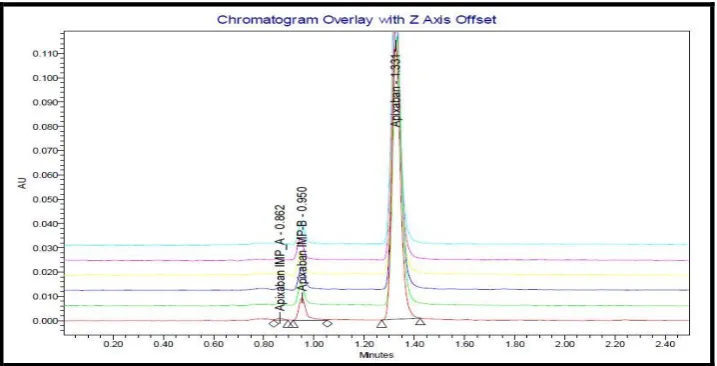
www.wjpr.net Vol 6, Issue 17, 2017. 713 y was area of the peak. The linearity data was shown in Table 2-4. The overlain
chromatogram obtained during the linearity is shown in the Fig.10.
Fig. 7: Linearity curve of standard Apixaban.
[image:8.595.138.459.127.299.2]Fig. 8: Linearity curve of standard Imp-A.
www.wjpr.net Vol 6, Issue 17, 2017. 714 Fig. 10: Overlay linearity Chromatogram for Apixaban, Imp-A & B.
Table 2: Linearity data of Apixaban.
Linearity level
Conc. (µg/mL) Mean Peak Area
I 10 76737
II 20 153276
III 30 227712
IV 40 307545
V 50 383875
VI 60 460452
Correlation co-efficient 0.9999
Slope 7686.3
Intercept -754.33
Table 3: Linearity data of Imp-A.
S. No Linearity Level Concentration(µg/mL) Mean Peak Area
1 I 0.625 824
2 II 1.25 1686
3 III 1.875 2486
4 IV 2.5 3260
5 V 3.125 4026
6 VI 3.75 4827
Correlation Coefficient 0.999
Table 4: Linearity data of Imp-B.
S. No Linearity Level Concentration(µg/mL) Mean Peak Area
1 I 0.625 4735
2 II 1.25 9452
3 III 1.875 14754
4 IV 2.5 18976
5 V 3.125 23578
6 VI 3.75 28964
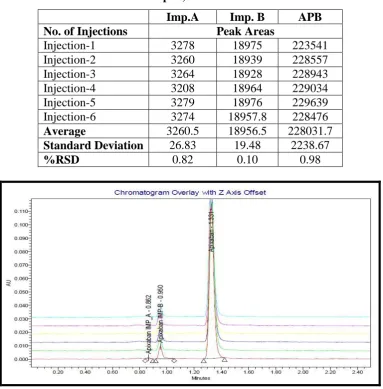
www.wjpr.net Vol 6, Issue 17, 2017. 715 Precision
The precision was evaluated by injecting six times (n=6) of the working standard solution
APB (30 µg/ml) spiked with working standard solution of impurity A (2.5 µg/mL) and
impurity B (2.5 µg/mL) and the percent RSD was calculated. The % RSD values of the
precision study were < 2.0 % for APB, Imp A and Imp B. This confirms that the method is
precise, The overlain chromatogram is shown in Fig. 11 and the results of precision study are
given in the Table 5.
Table 5: Precision data of APB and Imp-A, B.
Imp.A Imp. B APB
No. of Injections Peak Areas
Injection-1 3278 18975 223541
Injection-2 3260 18939 228557
Injection-3 3264 18928 228943
Injection-4 3208 18964 229034
Injection-5 3279 18976 229639
Injection-6 3274 18957.8 228476
Average 3260.5 18956.5 228031.7
Standard Deviation 26.83 19.48 2238.67
[image:10.595.107.491.242.632.2]%RSD 0.82 0.10 0.98
Fig. 11: Overlay precision Chromatogram for Apixaban, Imp-A & B.
LOD and LOQ
Limit of detection (LOD) & the limit of quantifications (LOQ) are evaluated by the serial
dilutions of APB and Imp-A&B stock solutions in the ordered to be obtaining the signal to
the noise ratio 3:1 for the LOD & 10:1 for the LOQ. Then the LOD value for APB and Imp-A
www.wjpr.net Vol 6, Issue 17, 2017. 716 0.20 μg/mL, 0.16 μg/mL respectively. The chromatogram of the LOD and LOQ were shown
[image:11.595.110.490.128.318.2]in the (Fig. 12 & 13).
Fig. 12: Chromatogram of LOD study of APB, Imp-A & B.
Fig. 13: Chromatogram of LOQ study of APB, Imp-A&B.
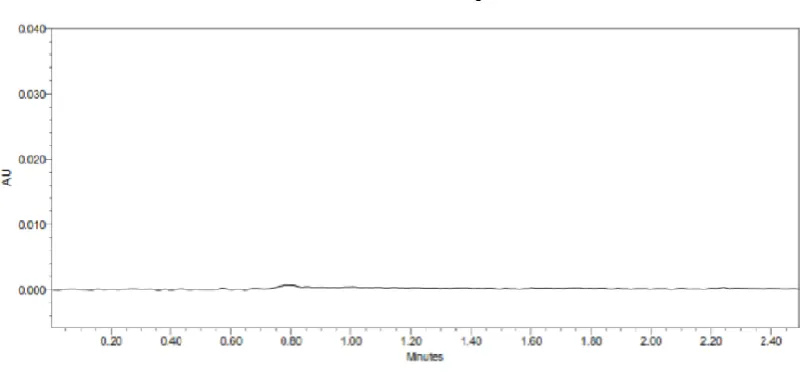
Specificity
A study to establish the interference of Blank and Placebo was conducted. Chromatograms of
Blank and Placebo solutions show no peaks at the retention times of APB and its related
impurities A and B. This indicates that the excipients used in the formulation do not interfere
in the estimation of APB in the tablets.
The corresponding chromatogram of blank, and standard APB solution and standard APB
[image:11.595.107.492.362.560.2]www.wjpr.net Vol 6, Issue 17, 2017. 717 Fig.14: Chromatogram of Blank.
Fig. 15: Chromatogram of standard APB.
[image:12.595.102.498.543.699.2]www.wjpr.net Vol 6, Issue 17, 2017. 718 Robustness
The robustness is studied by the evaluating effects of small but the deliberate differences in
method condition. The condition is variation in flow rate (± 0.03/min) and wavelength
(altered by ± 3 wavelength). During all the different conditions of the test solution results
wasn’t effected & in the accordance with an actual one. The system suitability also found
better; hence this method was conformed as robust. The chromatograms were obtained during
the robustness were shown in the (Fig. 17-20).
Fig. 17: Chromatogram of APB and Imp-A&B (0.27 mL/min flow rate).
[image:13.595.127.470.230.384.2]Fig. 18: Chromatogram of APB and Imp-A&B (0.33 mL/min flow rate).
www.wjpr.net Vol 6, Issue 17, 2017. 719 Fig. 20: Chromatogram of APB and Imp-A&B (223 nm).
Ruggedness
The ruggedness was studied by evaluating by different analysts but in the same
chromatographic conditions. The results of ruggedness of developed method are started in the
(Table 6). The results are shown during by different analysts but in the same chromatographic
condition of the test solution wasn’t affected & in the accordance with the actual. The
suitability parameters are also been found good; hence this method was concluded as rugged.
Table 6: Results of Ruggedness data for APB and Imp- A, B.
Analyst-II
Imp. A Imp. B APB No. of Injections Peak Areas
Injection-1 3268 18703 228674
Injection-2 3296 18967 229834
Injection-3 3257 18856 228436
Injection-4 3286 18964 229463
Injection-5 3296 18907 229867
Injection-6 3260 18356 229765
Average 3277.2 18792.17 229339 Standard Deviation 17.73 234.75 629.03
%RSD 0.54 1.24 0.27
Solution stability study
Sample Stability was evaluated at the ambient temp & analysis was done in initial time, after
3 hrs, 6 hrs, 12 hrs and 24 hrs. The analysis of the reports from all aged solutions was
compared with those of from the freshly prepared solution (initial solution). The test solutions
were stable upto the 24 hrs at the ambient temp, because difference in the measured & the
www.wjpr.net Vol 6, Issue 17, 2017. 720 Recovery Studies (Accuracy)
Therecovery of APB and Imp-A & B was determined at three conc. levels. The % recoveries
were shown in Table 7-9. The mean recoveries of APB, Imp A and Imp B from spiked
samples were found to be in the range of 99.60-100.85 % for APB, 99.86-101.40 % for Imp
A and 98.96-99.80 % for Imp B. The percentage recoveries were found to be within the limit
[image:15.595.57.539.212.804.2]indicates the accuracy of the method.
Table 7: Accuracy study Results of Apixaban.
%Concentration
(at specification Level) Peak Area
Amount Added (mg) Amount Found (mg) % Recovery % Mean Recovery
50%-1 115573 15 15.16 101.07
100.85
50%-2 114599 15 15.08 100.55
50%-3 115447 15 15.14 100.93
100%-1 227420 30 29.99 99.96
99.98
100%-2 226696 30 29.93 99.76
100%-3 227754 30 30.07 100.23
150%-1 348990 45 44.88 99.74
150%-2 347750 45 44.70 99.35
99.60
150%-3 349564 45 44.86 99.69
Table 8: Accuracy Study results for Impurity A. %Concentration
(at specification Level)
Peak Area Amount Added (µg/ml) Amount Found (µg/ml) % Recovery % Mean Recovery
50%-1 1644 1.25 1.258 100.64
101.40%
50%-2 1667 1.25 1.275 102.05
50%-3 1659 1.25 1.269 101.52
100%-1 3264 2.5 2.49 99.60
99.86
100%-2 3285 2.5 2.51 100.40
100%-3 3258 2.5 2.49 99.60
150%-1 4916 3.75 3.76 100.26
100.88
150%-2 4953 3.75 3.79 101.07
150%-3 4976 3.75 3.80 101.33
Table 9: Accuracy Study results for Impurity B. %Concentration
(at specification Level) Area
Amount Added (µg/ml) Amount Found (µg/ml) % Recovery
% Mean Recovery
50%-1 9483 1.25 1.249 99.92
99.53
50%-2 9428 1.25 1.241 99.28
50%-3 9427 1.25 1.241 99.28
100%-1 18946 2.5 2.473 98.99
98.96
100%-2 18923 2.5 2.471 98.87
100%-3 18953 2.5 2.475 99.03
150%-1 28639 3.75 3.77 100.53
99.80
150%-2 28396 3.75 3.70 98.86
www.wjpr.net Vol 6, Issue 17, 2017. 721 Analysis of a commercial formulation
Experimentally the results for the amount of APB in tablets, expressed as a percentage of
label claims were in good agreement with the label claims thereby suggesting that there is no
interaction from the excipients which are commonly present in formulation of tablets. The
results are shown in Table 10.
Table 10: Application of method in commercial formulation.
Formulation Labeled Amount (mg)
Amount* Found (mg)
% Recovery ± SD Eliquis
Tablets 2.5 2.46 99.54 % ± 0.985
Forced Degradation study
For this study, apixaban tablet formulation spiked with impurity A and impurity B was
subjected to various stress conditions like acid, alkali, oxidation, photolytic and thermal. The
active pharmaceutical ingredient in the tablet formulation is well resolved from degradation
products obtained during stress studies. The guidelines are expressed in ICH Q2A, Q3B, Q2B
& FDA 21 CFR section of 211 all the required for development & for the validation of
stability study.
Acid degradation
For acid degradation 10 tablets were accurately weighed and triturated to a fine powder.
From this tablet powder equivalent to 10 mg of apixaban was accurately weighed, mixed with
a 8.34 mg impurity A and impurity B and transferred into a 50 mL volumetric flask.
To it 3 mL of 1N hydrochloric acid was added and kept for 10 hrs at 60 ºC. After 10 hrs the
solution was neutralized with 3 mL of 1N sodium hydroxide and the volume was made with
the mobile phase, filtered and volume was made up with the same. From this 1.5 ml was
transferred into 10 ml volumetric flask and diluted with mobile phase. In acid degradation
study, it was found that the 9.56 % of the drug and 1.12 %, 2.01 % Imp A and Imp.B were
www.wjpr.net Vol 6, Issue 17, 2017. 722 Fig. 21: Chromatogram of acidic forced degradation of APB, Imp-A&B.
Alkaline degradation
For alkaline degradation 10 tablets were accurately weighed and triturated to a fine powder.
From this tablet powder equivalent to 10 mg of apixaban was accurately weighed, mixed with
a 8.34 mg impurity A and impurity Band transferred into a 50 mL volumetric flask.
To it 3 mL of 1N sodium hydroxide was added and kept for 10 hrs at 60 ºC. After 10 hrs the
solution was neutralized with 3 mL of 1N hydrochloric acid and the volume was made with
the mobile phase, filtered and volume was made up with the same. From this 1.5 ml was
transferred into 10 ml volumetric flask and diluted with mobile phase. In alkaline degradation
study, it was found that the 8.04 % of the drug and 0.91 %, 6.17 % Imp A and Imp.B were
degraded. The alkaline degradation chromatogram is shown in Fig.22.
[image:17.595.121.476.514.709.2]www.wjpr.net Vol 6, Issue 17, 2017. 723 Oxidative degradation
For oxidative degradation 10 tablets were accurately weighed and triturated to a fine powder.
From this tablet powder equivalent to 10 mg of apixaban was accurately weighed, mixed with
a 8.34 mg impurity A and impurity B and transferred into a 50 mL volumetric flask. To it 3
mL of 30 % v/v aqueous hydrogen peroxide was added and kept for 10 hrs. After 10 hrs the
solution was filtered and volume was made up with the mark. From this 1.5 ml was
transferred into 10 ml volumetric flask and diluted with mobile phase. In oxidative
degradation study, it was found that the 2.83 % of the drug and 1.92 %,6.74 % Imp A and
[image:18.595.120.478.287.480.2]Imp.B were degraded. The oxidative degradation chromatogram is shown in Fig 23.
Fig. 23: Chromatogram of oxidative forced degradation of APB, Imp-A&B.
Photolytic degradation
For photolytic degradation 10 tablets were accurately weighed and triturated to a fine
powder. From this, tablet powder equivalent to 10 mg apixaban was accurately weighed and
transferred into a petri dish and mixed with 8.34 mg each of impurity A and impurity B. The
drug was exposed at 1.2 million lux hr for 7 days. The exposed drug was dissolved in mobile
phase, filtered and diluted upto the mark. In photolytic degradation study, it was found that
the 4.46 % of the drug and 1.60 %, 7.21 % Imp A and Imp.B were degraded. The
www.wjpr.net Vol 6, Issue 17, 2017. 724 Fig. 24: Chromatogram of UV-light degradation of APB, Imp-A&B.
Thermal degradation
For Thermal degradation 10 tablets were accurately weighed and triturated to a fine powder.
From this, tablet powder equivalent to 10 mg apixaban was accurately weighed and
transferred into a petri dish and mixed with 8.34 mg each of impurity A and impurity B. The
mixture exposed at constant temperature of 80°C for 60 min by keeping it in an oven. The
exposed drug was dissolved in mobile phase, filtered and volume made upto the mark with
mobile phase. In thermal degradation study, it was found that the 1.05 % of the drug and 2.20
%, 12.41 % Imp A and Imp. B were degraded. The chromatogram is shown in Fig.25.
[image:19.595.84.513.468.682.2]www.wjpr.net Vol 6, Issue 17, 2017. 725 ACKNOWLEDGEMENTS
The author wish to acknowledge Eisai Pharmaceuticals for providing gratis samples of
Impurities and infrastructural facility to carry out this work and also special thanks to my
mentors Dr.D.Gowri Sankar,and Dr.JVLN Seshagiri Rao for their excellent advise valuable
help, support and inspiration on this work. I am also thankful and also acknowledge the
immense help received from the scholars whose articles are cited and included in references
of this manuscript. The author is also grateful to authors / editors / publishers of all those
articles, journals and books from where the literature for this article has been reviewed and
discussed.
CONCLUSION
A new RP-UPLC stability indicating method for Apixaban and its related substances is
developed for analysis in pharmaceutical formulation. Satisfactory results are obtained from
validation of the method. The run time (3 min) enabled rapid determination of APB along
with RS. This method exhibited an excellent performance in terms of sensitivity and speed.
This stability-indicating method can be applied for the routine analysis of production samples
and to check the stability of APB along with selected related substances in bulk drug and
formulation. Moreover, it can be applied for determination of assay, blend uniformity,
content uniformity and in vitro dissolutions of pharmaceutical products, where sample load is
higher and high throughput is essential for faster delivery of results.
COMPETING INTERESTS
The author declares that he has no competing interest.
REFERENCES
1. B. Hechman; B. Greenfield. J. Chemist., 2005; 5(2): 107-121.
2. BE Leonard; MC Cartan; DJ White; DJ King. J. Biomed Analysis., 2004: 19: 151-80.
3. A. Gilmore; R Milne. J.Pharma Drug Saf., 2001; 10(2): 85–94.
4. TF Mott; L Leach; L Johnson. J.of Chemical Practice., 2004; 53(8): 659–61.
5. BA Faraj; ZH Israeli; JM Perel. J.Pharm Exp Ther., 1974; 23(6): 191-199.
6. MF Bartlett; HP Egger. Academic J. Exp chrom., 1972; 31(4): 537.
7. PK Capp; PL Pearl. J.Rev Neurother., 2005; 5(3): 325–31.
8. H Shepard; T Sein; W Rodegker; A Plummer. J.Toxicol Appi Pharmacology., 1960; 2(3);
353-356.
www.wjpr.net Vol 6, Issue 17, 2017. 726 10.MP Sharon. J.Chromatography B., 2012; 23(2): 20-28.
11.CF Maria; ZM Lepnardo; GR Luciana; PL Renata. J. Chroma Suppl., 2009; 69(3):
143-148.
12.SJ Soldin; YP Chan; BM Hill; JM Swanson. Academic J. Child Psych., 1982; 21(2):
19-26.