Acta Cryst.(2001). E57, o633±o635 DOI: 10.1107/S1600536801010042 M. Subha Nandhiniet al. C3H8NO2+C2HO4ÿ
o633
organic papers
Acta Crystallographica Section E Structure Reports
Online
ISSN 1600-5368
L
-Alaninium oxalate
M. Subha Nandhini,aR. V.
Krishnakumarband S.
Natarajana*
aDepartment of Physics, Madurai Kamaraj
University, Madurai 625 021, India, and
bDepartment of Physics, Thiagarajar College,
Madurai 625 009, India
Correspondence e-mail: xray@mrna.tn.nic.in
Key indicators
Single-crystal X-ray study T= 293 K
Mean(C±C) = 0.003 AÊ Rfactor = 0.030 wRfactor = 0.083 Data-to-parameter ratio = 7.8
For details of how these key indicators were automatically derived from the article, see http://journals.iucr.org/e.
#2001 International Union of Crystallography Printed in Great Britain ± all rights reserved
In the title compound, C3H8NO2+C2HO4ÿ, the alanine
molecule exists in the cationic form and the oxalic acid molecule in the mono-ionized state. The alaninium and semi-oxalate ions form alternate columns leading to a layered
arrangement parallel to theac plane and each such layer is
interconnected to the other through NÐH O hydrogen
bonds. The overall aggregation pattern is distinctly different from that observed in the glycine±oxalic acid complex.
Comment
X-ray studies on crystalline complexes of amino acids with carboxylic acids have provided a wealth of information regarding intermolecular interactions and biomolecular aggregation patterns (Vijayan, 1988; Prasad & Vijayan, 1993). The crystal structures of glycinium oxalate (Subha Nandhiniet
al., 2001) and sarcosinium oxalate monohydrate
(Krishna-kumar et al., 1999) were elucidated in our laboratory. The
present study reports the crystal structure of l-alaninium
oxalate, (I), as part of a series of investigations being carried out to observe conformational changes in amino acid mol-ecules and characteristic hydrogen-bonding patterns in their crystal structures.
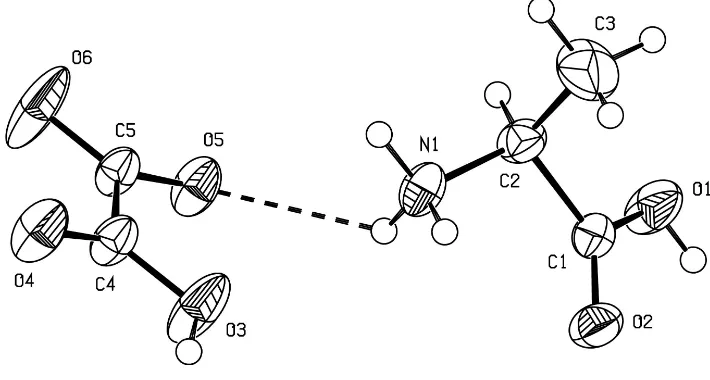
Fig. 1 shows the molecular structure with the numbering scheme. The alanine molecule exists in the cationic form with a protonated amino group and an uncharged carboxylic acid group. The oxalic acid molecule exists in a mono-ionized state.
The conformation of thel-alaninium cation about the NÐC
bond corresponds to the staggered ethane-type. A common feature between the crystal structures of glycinium oxalate and (I) is that the shortest cell dimensions are similar, 5.650 (2) and 5.6304 (15) AÊ, respectively. The semi-oxalate ions form hydrogen-bonded strings along the shortest cell axis, generated by translation, as in the structures of oxalic acid complexes of glycine (Subha Nandhiniet al., 2001) and lysine (Venkatramanet al., 1997).
In the asymmetric unit, thel-alaninium cation and the
semi-oxalate anion are linked to each other through a NÐH O
hydrogen bond (Fig. 1). The head-to-tail hydrogen bond, with
organic papers
o634
M. Subha Nandhiniet al. C3H8NO2+C2HO4ÿ Acta Cryst.(2001). E57, o633±o635O2 of the carboxyl group as acceptor, observed among the amino acid molecules in the crystal structure may be described as a zigzag sequence along the 21screw axis along the direction
of the a axis. The alaninium and semi-oxalate ions form
alternate columns leading to a layered arrangement parallel to theacplane and each such layer is interconnected to the other
through NÐH O hydrogen bonds. Two short C O
contacts involving the carboxyl oxygen of the alaninium ion [C1 O2(ÿ1
2+x, 32ÿy, ÿz) = 2.931 (3) AÊ and
C2 O2(ÿ1
2+x,32ÿy,ÿz) = 2.977 (3) AÊ] are also observed in
these layers. The slight difference observed in the bond lengths of C5ÐO5 and C5ÐO6 in the carboxylate group of the semi-oxalate ion may be attributed to the difference in the
strengths of the NÐH O hydrogen bonds in which both O5
and O6 are involved (Table 2). The overall aggregation pattern is distinctly different from that observed in the glycine±oxalic acid complex.
Experimental
Crystals of (I) were grown from a saturated aqueous solution containingl-alanine and oxalic acid in a ratio of 1:1.
Crystal data
C3H8NO2+C2HO4ÿ
Mr= 179.13
Orthorhombic,P212121
a= 5.6304 (15) AÊ
b= 7.2353 (15) AÊ
c= 19.597 (3) AÊ
V= 798.3 (2) AÊ3
Z= 4
Dx= 1.490 Mg mÿ3 Dm= 1.49 Mg mÿ3
Dmmeasured by ¯otation in a
mixture of carbon tetrachloride and xylene
CuKradiation Cell parameters from 25
re¯ections
= 4±68 = 1.23 mmÿ1
T= 293 (2) K Needle, colourless 0.200.150.11 mm
Data collection
Enraf±Nonius CAD-4 diffrac-tometer
!±2scans
Absorption correction: scan (Northet al., 1968)
Tmin= 0.79,Tmax= 0.87
879 measured re¯ections 879 independent re¯ections 853 re¯ections withI> 2(I)
max= 67.9
h= 0!6
k= 0!8
l= 0!23
2 standard re¯ections every 25 re¯ections frequency: 60 min intensity decay: 0.1%
Re®nement
Re®nement onF2
R[F2> 2(F2)] = 0.030
wR(F2) = 0.083
S= 1.09 879 re¯ections 112 parameters
H-atom parameters constrained
w= 1/[2(F
o2) + (0.0481P)2
+ 0.1739P]
whereP= (Fo2+ 2Fc2)/3
(/)max< 0.001
max= 0.14 e AÊÿ3
min=ÿ0.14 e AÊÿ3
Extinction correction:SHELXL97 Extinction coef®cient: 0.040 (3) Absolute structure: see below
Table 1
Selected geometric parameters (AÊ,).
N1ÐC2 1.483 (3) O1ÐC1 1.303 (2) O2ÐC1 1.205 (2) O3ÐC4 1.297 (2) O4ÐC4 1.199 (2)
O5ÐC5 1.219 (2) O6ÐC5 1.235 (2) C1ÐC2 1.508 (3) C2ÐC3 1.522 (3) C4ÐC5 1.548 (3)
O2ÐC1ÐC2ÐN1 ÿ29.3 (3)
O1ÐC1ÐC2ÐN1 153.29 (18) O2ÐC1ÐC2ÐC3O1ÐC1ÐC2ÐC3 ÿ90.4 (3)87.0 (2)
Table 2
Hydrogen-bonding geometry (AÊ,).
DÐH A DÐH H A D A DÐH A
N1ÐH1A O6i 0.89 1.91 2.728 (2) 152
N1ÐH1B O4ii 0.89 2.28 3.085 (2) 150
N1ÐH1C O2iii 0.89 2.30 2.978 (2) 133
N1ÐH1C O5 0.89 2.35 2.896 (2) 120 O1ÐH1 O5iv 0.82 1.76 2.575 (2) 170
O3ÐH3 O6v 0.82 1.73 2.545 (2) 172
Symmetry codes: (i) ÿx;1
2y;12ÿz; (ii) 1ÿx;12y;21ÿz; (iii)xÿ12;32ÿy;ÿz; (iv) 1
2x;32ÿy;ÿz; (v) 1x;y;z.
The absolute structure of (I) was not established by the analysis but is known from the con®guration of the starting reagents. The H atoms were placed at calculated positions and were allowed to ride on their respective parent atoms with HFIX instructions using
SHELXL97 (Sheldrick, 1997) defaults.
Data collection: CAD-4 Software (Enraf±Nonius, 1989); cell re®nement: CAD-4 Software; data reduction: CAD-4 Software; program(s) used to solve structure: SHELXS97 (Sheldrick, 1990); program(s) used to re®ne structure:SHELXL97 (Sheldrick, 1997); molecular graphics:PLATON(Spek, 1999); software used to prepare material for publication:SHELXL97.
Two of the authors, MSN and SN, thank the Council of Scienti®c and Industrial Research (CSIR), India, for ®nancial assistance. The authors also thank the Bio-informatics Centre, Madurai Kamaraj University, for providing the Cambridge Structural Database and the Regional Sophisticated Instru-mentation Centre (RSIC), Indian Institute of Technology, Chennai, for X-ray data collection.
References
Enraf±Nonius (1989).CAD-4Software. Version 5.0. Enraf±Nonius, Delft, The Netherlands.
Krishnakumar, R. V., Subha Nandhini, M. & Natarajan, S. (1999).Acta Cryst.
C55, IUC9800063.
North, A. C. T., Phillips, D. C. & Mathews, F. S. (1968).Acta Cryst.A24, 351± 359.
Figure 1
Prasad, G. S. & Vijayan, M. (1993).Acta Cryst.B49, 348±356. Sheldrick, G. M. (1990).Acta Cryst.A46, 467±473.
Sheldrick, G. M. (1997).SHELXL97. University of GoÈttingen, Germany. Spek, A. L. (1999). PLATON for Windows. Utrecht University, The
Netherlands.
Subha Nandhini, M., Krishnakumar, R. V. & Natarajan, S. (2001).Acta Cryst.
C57, 115±116.
Venkatraman, J., Prabu, M. M. & Vijayan, M. (1997).J. Pept. Res.50, 77± 87.
Vijayan, M. (1988).Prog. Biophys. Mol. Biol.52, 71±99.
supporting information
sup-1
Acta Cryst. (2001). E57, o633–o635supporting information
Acta Cryst. (2001). E57, o633–o635 [doi:10.1107/S1600536801010042]
L
-Alaninium oxalate
M. Subha Nandhini, R. V. Krishnakumar and S. Natarajan
S1. Comment
X-ray studies on crystalline complexes of amino acids with carboxylic acids have provided a wealth of information
regarding intermolecular interactions and biomolecular aggregation patterns (Vijayan, 1988; Prasad & Vijayan, 1993).
The crystal structures of glycinium oxalate (Subha Nandhini et al., 2001) and sarcosinium oxalate monohydrate
(Krishnakumar et al., 1999) were elucidated in our laboratory. The present study reports the crystal structure of L
-alaninium oxalate, (I), as part of a series of investigations being carried out to observe conformational changes in amino
acid molecules and characteristic hydrogen-bonding patterns in their crystal structures.
Fig. 1 shows the molecular structure with the numering scheme. The alanine molecule exists in the cationic form with a
positively charged amino group and an uncharged carboxylic acid group. The oxalic acid molecule exists in a
mono-ionized state. The conformation of the L-alaninum cation about the N—Cα bond corresponds to the staggered ethane-type.
A common feature among the crystal structures of glycinium oxalate and (I) is that the shortest cell dimensions are
similar, 5.650 (2) and 5.6304 (15) Å, respectively. The semi-oxalate ions form hydrogen-bonded strings along the shortest
cell axis, generated by translation, as in the structures of oxalic acid complexes of glycine (Subha Nandhini et al., 2001)
and lysine (Venkatraman et al., 1997).
In the asymmetric unit, the L-alaninium cation and the semi-oxalate anion are linked to each other through a N—H···O
hydrogen bond (Fig. 1). The head-to-tail hydrogen bond, with O2 of the carboxyl group as acceptor, observed among the
amino acid molecules in the crystal structure may be described as a zigzag sequence along the 21 screw axis along the
direction of the a axis. The alaninium and semi-oxalate ions form alternate columns leading to a layered arrangement
parallel to the ac plane and each such layer is interconnected to the other through N—H···O hydrogen bonds. Two short
C···O contacts involving the carboxyl oxygen of the alaninium ion [C1···O2(-1/2 + x, 3/2 - y, -z) = 2.931 (3) Å and
C2···O2(-1/2 + x, 3/2 - y, -z) = 2.977 (3) Å] is also observed among these layers. The slight difference observed in the
bond lengths of C5—O5 and C5—O6 in the carboxylate group of the semi-oxalate ion may be attributed to the difference
in the strengths of the N—H···O hydrogen bonds in which both O5 and O6 are involved (Table 2). The overall
aggregation pattern is distinctly different from that observed in the glycine–oxalic acid complex.
S2. Experimental
Crystals of (I) were grown from a saturated aqueous solution containing L-alanine and oxalic acid in a stoichiometric
ratio.
S3. Refinement
The absolute structure of (I) was not established by the analysis but is known from the configuration of the starting
reagents. The H atoms were placed at calculated positions and were allowed to ride on their respective parent atoms with
supporting information
[image:5.610.126.481.74.264.2]sup-2
Acta Cryst. (2001). E57, o633–o635Figure 1
The molecular structure of with the atom-numbering scheme and 50% probability displacement ellipsoids.
L-alaninium oxalate
Crystal data
C3H8NO2+·C2HO4− Mr = 179.13
Orthorhombic, P212121 a = 5.6304 (15) Å
b = 7.2353 (15) Å
c = 19.597 (3) Å
V = 798.3 (2) Å3 Z = 4
F(000) = 376
Dx = 1.490 Mg m−3 Dm = 1.49 Mg m−3
Dm measured by flotation in a mixture of carbon
tetrachloride and bromoform Cu Kα radiation, λ = 1.54180 Å Cell parameters from 25 reflections
θ = 4–68°
µ = 1.23 mm−1 T = 293 K Needle, colourless 0.2 × 0.15 × 0.11 mm
Data collection
Enraf-Nonius sealed tube diffractometer
Radiation source: fine-focus sealed tube Graphite monochromator
ω–2θ scans
Absorption correction: ψ scan (North et al., 1968)
Tmin = 0.79, Tmax = 0.87
879 measured reflections
879 independent reflections 853 reflections with I > 2σ(I)
Rint = 0.000
θmax = 67.9°, θmin = 4.5° h = 0→6
k = 0→8
l = 0→23
2 standard reflections every 25 reflections intensity decay: 0.1%
Refinement
Refinement on F2
Least-squares matrix: full
R[F2 > 2σ(F2)] = 0.030 wR(F2) = 0.083 S = 1.09 879 reflections 112 parameters 0 restraints
Primary atom site location: structure-invariant direct methods
Secondary atom site location: difference Fourier map
Hydrogen site location: inferred from neighbouring sites
supporting information
sup-3
Acta Cryst. (2001). E57, o633–o635w = 1/[σ2(F
o2) + (0.0481P)2 + 0.1739P]
where P = (Fo2 + 2Fc2)/3
(Δ/σ)max < 0.001
Δρmax = 0.14 e Å−3
Δρmin = −0.14 e Å−3
Extinction correction: SHELXL97, Fc*=kFc[1+0.001xFc2λ3/sin(2θ)]-1/4
Extinction coefficient: 0.040 (3) Absolute structure: see text
Special details
Geometry. All e.s.d.'s (except the e.s.d. in the dihedral angle between two l.s. planes) are estimated using the full covariance matrix. The cell e.s.d.'s are taken into account individually in the estimation of e.s.d.'s in distances, angles and torsion angles; correlations between e.s.d.'s in cell parameters are only used when they are defined by crystal symmetry. An approximate (isotropic) treatment of cell e.s.d.'s is used for estimating e.s.d.'s involving l.s. planes.
Refinement. Refinement of F2 against ALL reflections. The weighted R-factor wR and goodness of fit S are based on F2,
conventional R-factors R are based on F, with F set to zero for negative F2. The threshold expression of F2 > σ(F2) is used
only for calculating R-factors(gt) etc. and is not relevant to the choice of reflections for refinement. R-factors based on F2
are statistically about twice as large as those based on F, and R- factors based on ALL data will be even larger.
Fractional atomic coordinates and isotropic or equivalent isotropic displacement parameters (Å2)
x y z Uiso*/Ueq
N1 0.2644 (3) 0.8562 (2) 0.10946 (7) 0.0359 (4)
H1A 0.1867 0.8789 0.1481 0.054*
H1B 0.4196 0.8708 0.1163 0.054*
H1C 0.2356 0.7408 0.0962 0.054*
O1 0.1991 (3) 0.9924 (3) −0.06326 (7) 0.0511 (5)
H1 0.2798 0.9719 −0.0973 0.077*
O2 0.5153 (3) 0.8816 (2) −0.00816 (7) 0.0411 (4)
O3 0.4157 (3) 0.5324 (4) 0.21396 (8) 0.0623 (7)
H3 0.5443 0.5063 0.2311 0.093*
O4 0.2719 (3) 0.4667 (3) 0.31722 (7) 0.0489 (5)
O5 −0.0096 (3) 0.5505 (2) 0.16329 (6) 0.0410 (4)
O6 −0.1695 (3) 0.4814 (4) 0.26207 (8) 0.0760 (8)
C1 0.3174 (3) 0.9450 (3) −0.00888 (9) 0.0322 (5)
C2 0.1832 (4) 0.9866 (3) 0.05590 (9) 0.0342 (5)
H2 0.0125 0.9702 0.0481 0.041*
C3 0.2320 (7) 1.1841 (3) 0.07866 (13) 0.0664 (9)
H3A 0.1459 1.2093 0.1199 0.100*
H3B 0.1820 1.2683 0.0436 0.100*
H3C 0.3990 1.1993 0.0868 0.100*
C4 0.2478 (4) 0.5021 (4) 0.25784 (10) 0.0344 (4)
C5 0.0000 (3) 0.5137 (3) 0.22394 (9) 0.0314 (5)
Atomic displacement parameters (Å2)
U11 U22 U33 U12 U13 U23
supporting information
sup-4
Acta Cryst. (2001). E57, o633–o635O6 0.0203 (7) 0.172 (2) 0.0361 (8) −0.0033 (13) 0.0015 (6) 0.0402 (12) C1 0.0353 (10) 0.0340 (9) 0.0271 (9) 0.0027 (8) 0.0044 (8) 0.0029 (8) C2 0.0350 (10) 0.0404 (10) 0.0273 (9) 0.0051 (11) 0.0042 (8) −0.0018 (8) C3 0.105 (3) 0.0392 (11) 0.0552 (14) 0.0083 (17) 0.0140 (18) −0.0081 (11) C4 0.0212 (8) 0.0548 (11) 0.0273 (9) −0.0004 (9) −0.0006 (8) 0.0063 (9) C5 0.0222 (9) 0.0469 (11) 0.0252 (8) −0.0011 (10) −0.0007 (7) 0.0060 (8)
Geometric parameters (Å, º)
N1—C2 1.483 (3) O5—C5 1.219 (2)
N1—H1A 0.8900 O6—C5 1.235 (2)
N1—H1B 0.8900 C1—C2 1.508 (3)
N1—H1C 0.8900 C2—C3 1.522 (3)
O1—C1 1.303 (2) C2—H2 0.9800
O1—H1 0.8200 C3—H3A 0.9600
O2—C1 1.205 (2) C3—H3B 0.9600
O3—C4 1.297 (2) C3—H3C 0.9600
O3—H3 0.8200 C4—C5 1.548 (3)
O4—C4 1.199 (2)
C2—N1—H1A 109.5 C1—C2—H2 109.6
C2—N1—H1B 109.5 C3—C2—H2 109.6
H1A—N1—H1B 109.5 C2—C3—H3A 109.5
C2—N1—H1C 109.5 C2—C3—H3B 109.5
H1A—N1—H1C 109.5 H3A—C3—H3B 109.5
H1B—N1—H1C 109.5 C2—C3—H3C 109.5
C1—O1—H1 109.5 H3A—C3—H3C 109.5
C4—O3—H3 109.5 H3B—C3—H3C 109.5
O2—C1—O1 125.65 (18) O4—C4—O3 126.7 (2)
O2—C1—C2 121.97 (18) O4—C4—C5 122.01 (18)
O1—C1—C2 112.32 (17) O3—C4—C5 111.32 (15)
N1—C2—C1 108.33 (16) O5—C5—O6 126.65 (19)
N1—C2—C3 109.50 (18) O5—C5—C4 118.05 (17)
C1—C2—C3 110.07 (19) O6—C5—C4 115.29 (15)
N1—C2—H2 109.6
O2—C1—C2—N1 −29.3 (3) O4—C4—C5—O5 180.0 (2)
O1—C1—C2—N1 153.29 (18) O3—C4—C5—O5 −1.0 (3)
O2—C1—C2—C3 90.4 (3) O4—C4—C5—O6 −1.0 (4)
O1—C1—C2—C3 −87.0 (2) O3—C4—C5—O6 178.1 (3)
Hydrogen-bond geometry (Å, º)
D—H···A D—H H···A D···A D—H···A
N1—H1A···O6i 0.89 1.91 2.728 (2) 152
N1—H1B···O4ii 0.89 2.28 3.085 (2) 150
N1—H1C···O2iii 0.89 2.30 2.978 (2) 133
supporting information
sup-5
Acta Cryst. (2001). E57, o633–o635O1—H1···O5iv 0.82 1.76 2.575 (2) 170
O3—H3···O6v 0.82 1.73 2.545 (2) 172