IMPACT OF SALT CRYSTAL SIZE ON IN-MOUTH DELIVERY OF
SODIUM AND SALTINESS PERCEPTION FROM SNACK FOODS
RUBEN RAMA1, NATALIE CHIU, MARGARIDA CARVALHO DA SILVA, LOUISE HEWSON, JOANNE HORT and IAN D. FISKDivision of Food Sciences, University of Nottingham, Sutton Bonington Campus, Sutton Bonington, Leicestershire, LE12 5RD, U.K.
This article originated from a presentation given during the conference, “Food Oral Processing – Physics, Physiology, and Psychology of Eating”, held in Beaune (France) on July 1–5, 2012.
KEYWORDS
Salt reduction, sodium chloride, sodium concentration, time–intensity
1Corresponding author. TEL:
+44-0-115-951-6037; FAX:
+44-0-115-951-6142; EMAIL: stxrr8@nottingham.ac.uk
Received for Publication September 30, 2012 Accepted for Publication February 1, 2013
doi:10.1111/jtxs.12017
Re-use of this article is permitted in accordance with the Terms and Conditions set out at http://wileyonlinelibrary.com/ onlineopen#OnlineOpen_Terms
ABSTRACT
Fried, sliced potato crisps were flavored with sodium chloride of varying size frac-tions to investigate the impact of salt crystal size on the delivery rate of sodium to the tongue and resultant saltiness, measured over 65 s with a defined chew proto-col (three chews, then holding the bolus in the mouth without swallowing). Salt crystal size impacted upon the delivery rate and perceived saltiness. The smallest crystal size fraction dissolved and diffused throughout the mouth to the tongue saliva faster than the medium and the largest ones; the smallest crystal size frac-tion also had the highest maximum concentrafrac-tion and greatest total sodium. These results correlated well with the sensory perceived saltiness, where the small-est crystal size fraction resulted in the fastsmall-est Tmax, highest maximum saltiness
intensity and maximum total saltiness. The different delivery rates can be explained by differential dissolution kinetics and enhanced mass transfer of sodium across the saliva.
PRACTICAL APPLICATIONS
Sodium reduction is a major challenge for the global food industry. The results of this work illustrate how modification of salt crystal size fraction might impact sensory perceived saltiness, and that a smaller crystal size fraction can achieve a greater maximum saltiness per unit of sodium consumed. There are a number of technical hurdles to be overcome before implementation of this approach, both practical (limitations in processability) and sensorial (changes in the time– intensity profile), but the results do demonstrate that enhanced dissolution and diffusion kinetics can be achieved through modification of salt crystal size, which should be seriously considered by snack food manufacturers when approaching product reformulation.
INTRODUCTION
There is a proven association between excessive sodium intake and the development of hypertension (MacGregor and Sever 1996); the causal link between dietary sodium and hypertension-derived cardiovascular disease has prompted public health bodies and regulatory authorities to recommend reducing dietary salt intake to 5 g/day (WHO 2007). Currently, the average daily salt intake from foods in
U.K. adults is 8.1 g (DOH 2011). Further reductions, although being attempted, are technically challenging and new approaches are therefore needed.
Salt has a variety of functions in food including improv-ing the sensory properties of foods by providimprov-ing saltiness, as the prototypical stimulus for salt taste (Dötsch et al. 2009), decreasing bitterness, increasing sweetness, masking processed notes and other congruent flavor effects (Keast and Breslin 2003). It also acts as a preservative, enhances
functionality and controls fermentation (Gelabert et al. 2003). In snack foods, salt has a variety of functions: it can act as a process aid generating structure and color in pro-cessed snacks and as a topical tastant either on its own or in combination with other flavors (Miller and Barringer 2002). The removal, or reduction, of sodium from snack foods is technically challenging and requires all aspects of the func-tionality of sodium containing ingredients to be addressed. Recent studies have shown that reductions of the sodium content in some solid foods (2–5%) were not noticeable by consumers (Drakeet al. 2011); that in crisps, normal eating patterns would not release the majority of the added topical salt (Xian and Fisk 2012); and that the complexity of the food matrix influences the perception of saltiness (Drake
et al. 2011). In this study, the focus will be on the topical application of sodium chloride to crisps (fried, sliced potato of ca. 1 mm thick) where the sodium chloride not only enhances the flavor of the snack food but also contributes saltiness.
The temporal delivery of flavor has been widely studied in recent years and strongly depicts the overall sensory per-ception of a food (Buschet al. 2009; van Ruth and Roozen 2010). During mastication, the delivery of odorants and tastants is affected by several factors, such as the nature and physicochemical properties of the flavor compounds under study (Bolandet al. 2006), the structure and breakdown of the food matrix (Wilson and Brown 1997), and oral pro-cessing (Buettneret al. 2002). If we specifically consider the temporal delivery of sodium from a topically applied crystal on the surface of a crisp, the process of eating crisps can be separated into a number of phases: chewing, hydration, bolus formation and swallowing (Rosenthal 1999). During chewing, the crisp is physically broken down and the topi-cally applied salt is mixed, forming a bolus. Saliva hydrates the salt, which dissolves and becomes locally distributed throughout the mouth by a tongue mixing phenomenon. Finally, the bolus is swallowed and the tongue cleans the palate, removing any residual particles of crisp that remains on the mouth surface.
Sodium is only perceived when the saliva concentration of sodium is significantly higher than the resting saliva con-centration, or exceeds the residual concentration from a previous stimulus (Delwiche and O’Mahony 1996). Sodium is perceived via receptor cells located close to taste pores on the tongue. Sodium ions pass through sodium specific ion channels on the apical end of the taste cells, leading to cell depolarization, neural transduction via nerve pathways to the nucleus of the solitary tract where neurons synapse at the base of the brain and then further synapse to link to the frontal cortex via the thalamus. Owing to the specificity of the ion channels, alternative “salts” are less effective. There-fore, if sodium reduction is required without modifying perception, one has to address either the availability of
sodium (molecular binding) or the delivery of sodium (dis-solution, diffusion, mixing kinetics).
It was then hypothesized that sodium delivery is depen-dent on both effective mixing (oral processing) and effective delivery (dissolution and diffusion), and that if one removes the uncontrollable oral processing factor (artificially by experimental design), the delivery of sodium remains the limiting step. Delivery is dependent on two factors: first, the dissolution of salt from its crystal form, and, second, the diffusion of free sodium through the static saliva barrier layer on the surface of the tongue. As the static diffusion cannot be influenced, the remaining factor is dissolution from crystal to liquid form and one route to control this would be through the reduction of crystal size based on an increase in the surface area.
The objective of this study was therefore to evaluate the impact of various salt crystal size fractions on the delivery of sodium from sliced fried potato crisps to the oral saliva and perception of saltiness over time.
MATERIALS AND METHODS
Salt (98.2%, SAXA, Ashford, U.K.) was ground by hand using a mortar and pestle and mechanically sieved using nickel sieves (Fisher, Loughborough, U.K.) into four differ-ent fractions:<106, 106–425, 425–710 and >710mm. The
>710mm was discarded and the remaining three fractions were loaded onto crisps and labeled as S1, S2 and S3, respectively.
Crisps were purchased from a local supermarket and were within recommended use by date and manufac-turer specifications. They contained no added sodium chloride and were individually prescreened by hand to uniform size and shape (weight of 0.9⫾0.1 g, diameter of 50⫾5 mm).
Sample Preparation
Chewing and Swabbing Protocol
Assessors (n=8, aged 42–72 years, 2 male, 6 female) from the University of Nottingham external trained panel volun-teered to take part in the study and were trained in the use of a standard chewing protocol during two training ses-sions. The different crisp samples were offered in identical pots labeled with random three-digit codes and were pre-sented in random balanced order across the panel: false chew, blank, salted with S1, S2 and S3. At time 0, the panel-ists swabbed their tongue with a preweighed cotton bud (VWR, Vienna, Austria) and placed an individual crisp (1⫾0.1 g) at the back of the tongue. A clock was started; the crisp was chewed three times with free tongue move-ment. No more chewing, tongue movement or saliva swal-lowing was allowed. The bolus was moved to one side of the mouth and the tongue was cleaned by the front teeth and swabbed every 5 s for 65 s using preweighed cotton buds. Subsequently, these were placed in preweighed 15-mL sample tubes (Sarstedt, Nümbrecht, Germany). After 65 s, the panelists were allowed to swallow the samples. All panel-ists were required to palate cleanse using plain unsalted crackers (99% crackers, Rakusen’s, Leeds, U.K.), green apple (Granny Smith variety, U.K.) and bottled water (Evian, Danone, Evian-les-Bains, France) prior to sample tasting with a 5-min break between samples, a 15-min break every 3 samples, doing 6 and 7 samples/day, respectively. In addi-tion, 65 s was chosen as an artificial endpoint as it offered sufficient data points without inducing panel boredom.
Isolated cotton buds were weighed to calculate saliva weight, diluted with 6 mL of diluent (ultrapure water and diluent; Sherwood Scientific Ltd., Cambridge, U.K.) and 2 mL of methanol (ACROS, Geel, Belgium) and mixed using a D-91126 vortex (Heidolph Instruments, Schwabach, Germany) for 1 min. Furthermore, 2 mL of solution was extracted using a 2-mL plastic syringe (BD Plastipak, NJ, USA), and passed through a 0.45-mm filter (Sartorius Stedim Biotech Minisart, Göttingen, Germany) into a poly-styrene 10¥10¥45 mm cuvette (Sarstedt).
Sodium Concentration
Sodium concentration of diluted isolate of saliva collected was analyzed using a model 410 Sherwood flame photo-meter (Sherwood Scientific Ltd.). The concentration of sodium in the samples was evaluated at a wavelength of 589 nm against control standards at 0, 2, 4, 6 and 10 ppm. The calibrating curve showed repeatability with anR2>0.99
and linearity in the region of 0–10 ppm.
Sensory Evaluation
An experienced panel, same as in previous experiment, was trained (two sessions of 2 h each) on time–intensity
evalua-tion of saltiness and using time–intensity scales using the computerized data acquisition system FIZZ 2.46 (Biosys-tems, Couternon, France) at an acquisition rate of one data point per second. The perceived intensity was recorded on an unstructured category scale anchored at the extremes by the numbers “0” and “10.” Panelists were presented with four different crisp samples labeled with random three-digit codes: unsalted, salted with S1, S2 and S3 salt crystals, respectively. Each sample weighed 1⫾0.1 g and was pre-sented in quintuplicate for evaluation of saltiness by time– intensity. At time 0, preweighed individual crisps were placed by the panelist at the back of their tongue. The crisp was chewed three times with free tongue movement and the panelist was able to use the mouse to start the rating. No more chewing, tongue movement or saliva swallowing was allowed. After 65 s, the panelists were allowed to swallow the sample, but no more rating was recorded. The order of pre-sentation of samples was randomized within a session and across the panel. All assessors were required to palate cleanse using plain unsalted crackers (99% crackers; Rakus-en’s), green apple (Granny Smith variety) and bottled water (Evian) prior to sample tasting with a 5-min break between samples.
Judges differed significantly (P<0.001) in their responses to all samples but were consistent among repli-cations. A large variation between panelists was expected on time–intensity data as reported in previous studies (Heymann and Lawless 1998). In this study, each judge demonstrated a distinctive curve shape, which was repro-ducible across replicates.
Scanning Electron Microscope
For the study of the surface of the crisps, the samples were attached to the specimen holder by double-coated adhesive tape. The specimens were examined by a JEOL T-200 (Akishima, Japan) scanning electron microscope (SEM) at 8 kV for isolated S1, S2 and S3 salt particle sizes, and at 20–25 kV for the individual salted crisps.
Statistical Analysis
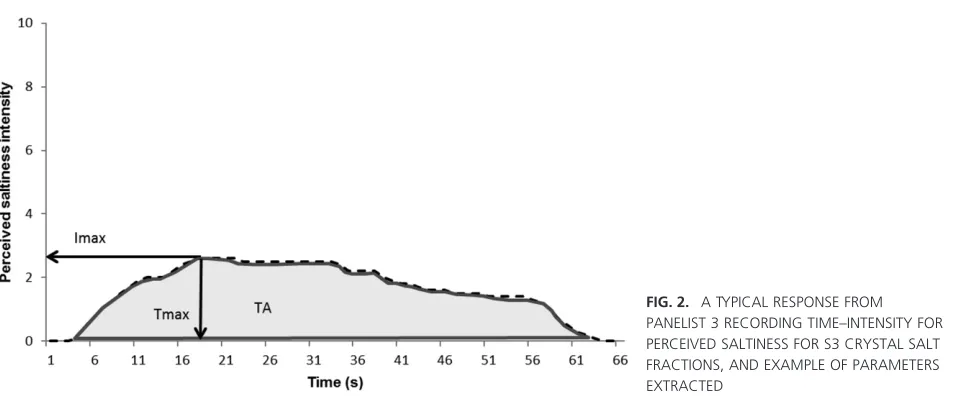
The FIZZ 2.46 software (Biosystems) normalization and computation algorithm was used for the formulation of extracted parameters from the time–intensity curves:
Tmax=time to maximum intensity and Imax=maximum
curve (TA) measuring the total perceived intensity and the total sodium concentration in saliva was determined.
All the parameters were subjected to an ANOVA (with Duncan post hoc, repeated measures, 2012), performed using R 2.15.0 (R Development Core Team) to determine whether significant differences could be found between the different salt crystal fractions (P<0.05). Data are expressed as means⫾standard deviation.
RESULTS AND DISCUSSION
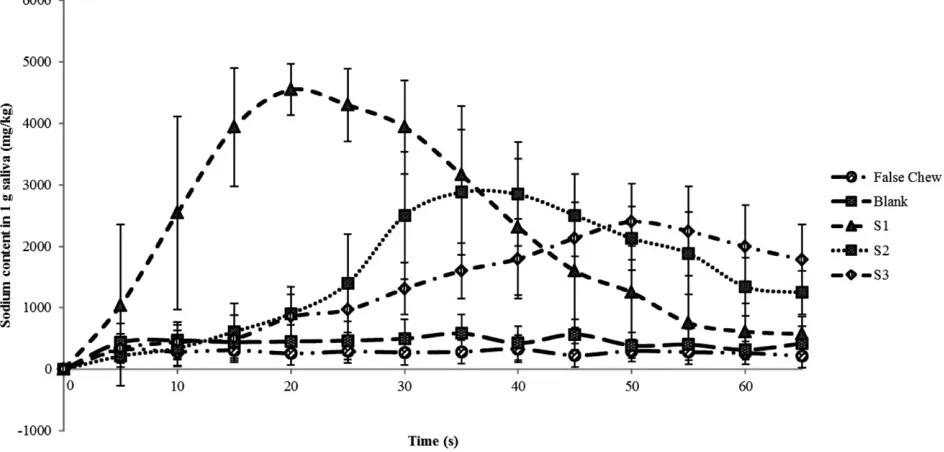
Crisps were chewed with a defined chew protocol, and saliva sodium concentration and sensory perceived saltiness were measured over 65 s. Salivary sodium concentrations are pre-sented in Table 1 and Fig. 1, and those of sensory perceived saltiness are presented in Table 2 and Fig. 2.
Temporal Delivery of Sodium to the Saliva
Sodium was steadily released into the saliva in the oral cavity over the experimental time course (Fig. 1). Initially, sodium concentration was low, and over the first 20–50 s, the concentration increased in a sigmoidal fashion, as sodium dissolved from the crisp bolus into the saliva. Saliva sodium concentration then peaked (2,713– 4,847 mg/kg) and reduced; there was a significant impact of salt crystal size on the sodium concentration over time,
the maximum sodium concentration found in the saliva and the time required to achieve the maximum sodium concentration.
To ensure a stable background was maintained through-out the experiment, a false chew (no crisps) data set was generated, which was relatively stable about the baseline (Fig. 1). Samples were then generated with no sodium and these again generated no major changes in the saliva sodium concentration. Statistically, there was no significant differ-ence in the sodium concentration over time or the maximum sodium concentration for either the false chew sample or the blank sample.
[image:4.594.300.527.103.170.2]Crisp samples containing different crystal size fractions of salt produced different temporal delivery curves. Figure 1
TABLE 1. FLAME PHOTOMETER CURVE ANALYSIS FOR SODIUM CONCENTRATION IN SALIVA AFTER CHEWING CRISPS SALTED WITH THE THREE DIFFERENT SALT CRYSTAL FACTIONS, S1, S2 AND S3
Sample
Imax Tmax TA
mg/kg (⫾SD) s (⫾SD) mg s/kg (⫾SD)
S1 4847 (⫾346)c 20 (⫾5)a 15
¥104(⫾2.1 ¥104)b S2 3481 (⫾779)b 40 (⫾5)b 10¥104(⫾2.3¥104)a S3 2713 (⫾529)a 50 (⫾5)c 9¥104(⫾2.1¥104)a
Different letters indicate significant differences within the data set. Data collected from eight assessors for 65 s in triplicate.
Imax, maximum sodium concentration; Tmax, time to Imax; TA, overall sodium concentration.
FIG. 1. SALIVA SODIUM CONCENTRATION AFTER CHEWING CRISPS SALTED WITH THREE DIFFERENT SALT CRYSTAL FRACTIONS, S1, S2 AND S3, BLANK (NO SALT) AND FALSE CHEW (n=8)
[image:4.594.56.528.436.662.2]shows the concentration of sodium over time for each sample; it can be clearly seen that there is a trend between crystal size andImaxwith the highest measured sodium
con-centration in saliva (4,847⫾346 mg/kg) achieved in the fastest rate (20 s) for the smallest salt crystal size (<106mm); the middle size crystal size fraction (106–425mm) had an intermediate Imax and Tmax and the largest (425–710mm)
crystal size fraction had the lowest maximum sodium concentration (2,713⫾529 mg/kg) and longest time to maximum concentration (50 s).
In Table 1,Imax,Tmaxand TA are summarized for all the
samples considered in this study. Salt particle size negatively correlates with the maximum sodium concentration and total area, and salt particle size positively correlates with
Tmax. For a fixed mass of sodium chloride, a reduced particle
size will result in an increase in surface area; this increase in surface area could explain the shape of the curves observed as a higher surface area will facilitate a more rapid dissolu-tion of sodium into the saliva, which would explain the more rapid increase in oral sodium concentration observed in the samples with the smallest crystal size.
Temporal Perception of Sodium
The maximum intensity of saltiness, as recorded for all assessors, is shown in Table 2 with the time to maximum intensity and total area under the saltiness–time curve also calculated for the three different crystal size fractions.
The maximum perceived intensity of sodium was signifi-cantly enhanced in the samples containing the smallest salt crystal size fraction when compared with the largest and the intermediate crystal size fraction (P<0.05). The time to maximum intensity (Tmax) was also dependent on the crystal
size fraction and the smallest salt crystal size fraction had the fastestTmax. These results are in agreement with a
previ-ous study where the intensity of saltiness was measured on pâté samples coated with different salt particle sizes (Shepherdet al. 1989), which showed that small crystals on the surface of the sample gave a maximum perceived inten-sity of sodium when compared with both larger particle sizes and the salt incorporated into the food.
[image:5.594.65.294.113.180.2]Each batch of crisp samples was prepared with an equal loading of sodium; this is important to consider when reviewing the total area under the saltiness–time intensity curve (TA), which was strongly dependent on the crystal size fraction (Table 2), with the smallest crystal size fraction having the highest total saltiness. Over the experimental time course of 65 s, the larger salt crystal size fractions did not fully equilibrate and the sodium level did not return to its baseline by the end of the experiment (Fig. 1). This can be compared with the smallest salt crystal size fraction, which reached equilibrium at 65 s. This suggests that the particle size is limiting the process of diffusion and that residual sodium is still interacting with the bolus for the larger crystal sizes, as previously demonstrated (Xian and Fisk 2012). The total saltiness values therefore cannot be
TABLE 2. TIME–INTENSITY CURVE ANALYSIS FOR SALTINESS PERCEPTION FOR THE THREE DIFFERENT SALT CRYSTAL FRACTIONS AFTER CHEWING CRISPS SALTED WITH THE THREE DIFFERENT SALT CRYSTAL FACTIONS, S1, S2 AND S3
Sample
Imax Tmax TA
(⫾) s (⫾SD) s (⫾SD)
S1 9.48 (⫾0.63)c 17 (⫾8)a 476 (⫾81)c
S2 8.10 (⫾1.24)b 22 (⫾9)b 358 (⫾85)b
S3 6.01 (⫾1.41)a 20 (⫾8)b 257 (⫾79)a
Data collected from eight assessors for 65 s in quintuplicate.
Imax, maximum perceived sensory saltiness;Tmax, time toImax; TA, overall perceived saltiness sensation.
[image:5.594.67.545.505.710.2]compared directly, but do indicate that in a realistic eating event (<65 s), the smaller salt crystals do deliver a greater total saltiness and a greater proportion of saltiness is avail-able for perception.
Link between Temporal Delivery of Sodium to the Saliva and Temporal Perception of Sodium
The maximum sodium concentration measured in saliva followed a similar trend as maximum perceived saltiness by the panelists. The time to reach the perceived maximum intensity was considerably shorter than the time it took for the maximum sodium concentration to peak, for all crystal sizes. This is probably due to a number of reasons, primarily driven by the resolution limit of the sensoryT–Iprotocol; in addition, it has been suggested previously that saltiness per-ception may not be only linked to the concentration of sodium ions in saliva, but also with difference in peak con-centration to baseline concon-centration (Bartoshuket al. 1964) and the speed of the delivery (the rate of change of concen-tration of sodium per unit time), or the sum of the sodium delivered over time (TA) (Morriset al. 2009) may contrib-ute to enhanced perception of saltiness.
If salt crystals are considered as independent three-dimensional spheres, and that the dissolution of sodium starts as soon as they are in contact with oral saliva, it can be hypothesized that there would be a causal link between surface area and dissolution. As the salt crystals dissolve, solid mass is converted into solubilized ions, which subse-quently can diffuse into the bulk saliva. The rate of change of conversion to solubilized ions will be dependent on the surface area and the differential concentration gradient, i.e., if sodium is present at a higher concentration in the saliva, the rate of dissolution will be retarded. The process of dis-solution will decrease the mass and number of salt particles, and increase the surface area to volume ratio. This will con-tinue to a point where there will be a balance between saliva being generated (Heinzerlinget al. 2011), saliva being lost though drainage and sodium equilibrating between the bolus and the saliva in the oral cavity; as this balance is reached, the concentration in the saliva will peak and then reduce, as demonstrated in Fig. 1.
Windischet al. (2013) previously looked at the solubiliza-tion of sugar into saliva and assumed that if the particle maintains its spherical shape and that the mass transfer rate is constant throughout dissolution, the following equation can be applied:
dm
dt = ⋅c s m
( )
wheres(m) is the total surface area for a fixed mass (m) over time (t) with a fixed mass transfer rate (c). In this idealized
model, the rate of loss of mass from the candy, or in our case, the salt crystal, will be directly dependent on the surface area, implying that smaller crystals will dissolve more quickly, resulting in a faster delivery to the oral saliva. This is a very idealized model as the salt crystals will not be ideal spheres, mass transfer rates will not be fixed, there will be a dependence on the diffusivity of the saliva and the saliva sodium concentration and the bolus will interact physically with the salt crystals, e.g., by physical entrapment. Once solubilized in the saliva, the local region around the salt crystal will have a higher sodium ion concentration, mass transfer will then occur through diffusion through the saliva to the regions of the tongue containing sodium ion channels; the diffusion of sodium ions through saliva could therefore be predicted to follow Fickian diffusion, where the rate of transfer (Fx) of sodium through the saliva along
directionxis directly proportional to the concentration (c) gradient per unit length (x), as shown below (whereDis the diffusion coefficient):
F D c x
x= − δ
δ
At any point in time, during early dissolution, the local con-centration around the smaller salt crystals will be higher than that around those that are larger due to the enhanced dissolution kinetics; therefore, the concentration gradient will be greater and the mass transfer rateFxwill be greater,
as observed in Fig. 1. Again, this model is idealized and may not truly represent reality, but it does serve to facilitate an explanation for the greater sodium delivery rate, higher peak sodium concentration and lower onset time for the samples containing smaller salt crystals.
It should be noted that within this controlled study, the kinetics of oral processing are slowed so that oral mixing is minimized, and dissolution and diffusion can start to be explained; as a result, there is a strong relationship between reduced crystal size fraction, reduced onset time, maximum saliva sodium concentration and maximum perceived salti-ness. In addition, other studies carried out at the University of Nottingham have further indicated that intelligent control of salt crystal size does offer an overall consumer benefit (unpublished data).
Physical Morphology of Salt Crystals and Attachment to the Sample Matrix
The images illustrating the crisp surface loaded with salt crystals clearly show the adhesion of the salt crystals to the fat coating of the crisp and the distribution of the crystals across the crisp surface (Fig. 3). Salt was applied to each batch of crisps at an identical loading rate, and as the smaller crystals were ground to a lower particle size, the ground fractions gave a broader distribution across the crisp surface, whereas the larger crystals had a more inhomoge-neous distribution. This was verified in a number of SEM images, of which six were chosen to be characteristic of the samples and are shown in Fig. 3. It is interesting to note that although the samples were loaded with, and contained, equal levels of sodium, different salt particle sizes have pre-viously been shown to have different loading abilities. The adhesion of salt to the surface of fried potato crisps has been shown to significantly increase with reduced salt size for crisps containing surface oil (Buck and Barringer 2007). Oil after frying and cooling is viscous and can hold salt par-ticles through the formation of liquid bridges. The adhesion of smaller crystals on the surface is primarily due to van der Waals forces, and as the surface area : mass increases, van der Waals forces and capillary forces per unit mass become stronger. Larger particles have higher particle contact area than smaller particles; however, van der Waals force per unit mass decreases (Niman 2000). This maybe of relevance if the results presented are taken to an industrial setting and this may result in a beneficial reduction in process/packing
salt loss. Additionally, shape may also play a role in adhe-sion, with flaked salts having a greater surface area and enhanced adhesion. In another example, the impact of salt particle size and shape on salt loading on popcorn was studied and it was concluded that the coating efficiency of salt was higher for smaller particles (Miller and Barringer 2002).
CONCLUSION
The particle size of salt crystals applied to fried potato crisps has a significant impact on the delivery rate of sodium into the saliva, the maximum concentration of sodium in the saliva, the maximum perceived saltiness and the saltiness onset time. In summary, in a controlled chewing environ-ment with controlled mixing, smaller crystals of salt (sodium chloride) gave a faster, more salty delivery of sodium per unit sodium, and therefore, modification of salt crystal size is proposed to be a viable approach to reduce sodium in crisp snacks.
[image:7.594.68.543.70.311.2]Consumer insight studies are recommended prior to adoption of this approach by the food industry, as the use of smaller crystals will not only increase the onset time and peak intensity of saltiness, but also have a much more rapid loss of saltiness after chewing, which may be of relevance in some products.
FIG. 3. SCANNING ELECTRON MICROSCOPY IMAGES OF S1 (A, D), S2 (B, E), S3 (C, F) SALT CRYSTAL FRACTIONS, AS FREE CRYSTALS (A–C) AND AFTER ADDITION TO THE SURFACE OF THE CRISPS (D–F)
REFERENCES
BARTOSHUK, L.M., MCBURNEY, D.H. and PFAFFMANN, C. 1964. Taste of sodium chloride solutions after adaptation to sodium chloride: Implications for the “water taste.” Science 143, 967–968.
BOLAND, A.B., DELAHUNTY, C.M. and VAN RUTH, S.M. 2006. Influence of the texture of gelatin gels and pectin gels on strawberry flavour release and perception. Food Chem.96, 452–460.
BUCK, V.E. and BARRINGER, S.A. 2007. Factors dominating adhesion of NaCl onto potato chips. J. Food Sci.72, E435–E441.
BUETTNER, A., BEER, A., HANNIG, C., SETTLES, M. and SCHIEBERLE, P. 2002. Physiological and analytical studies on flavor perception dynamics as induced by the eating and swallowing process. Food Qual. Prefer.13, 497–504. BUSCH, J.L.H.C., TOURNIER, C., KNOOP, J.E., KOOYMAN,
G. and SMIT, G. 2009. Temporal contrast of salt delivery in mouth increases salt perception. Chem. Sens.34, 341–348. DELWICHE, J. and O’MAHONY, M. 1996. Changes in secreted salivary sodium are sufficient to alter salt taste sensitivity: Use of signal detection measures with continuous monitoring of the oral environment. Physiol. Behav.59, 605–611.
DOH. 2011. National diet and nutrition survey – assessment of dietary sodium in adults (aged 19 to 64 years) in England, 2011. (S.N. Katharine Sadler, T. Steer, V. Fill, B. Bates, S. Tipping, L. Cox, A. Lennox and A. Prentice, eds.) In The Stationery Office, London.
DÖTSCH, M., BUSCH, J., BATENBURG, M., LIEM, G., TAREILUS, E., MUELLER, R. and MEIJER, G. 2009. Strategies to reduce sodium consumption: A food industry perspective. Crit. Rev. Food Sci. Nutr.49, 841–851.
DRAKE, S.L., LOPETCHARAT, K. and DRAKE, M.A. 2011. Salty taste in dairy foods: Can we reduce the salt? J. Dairy Sci. 94, 636–645.
GELABERT, J., GOU, P., GUERRERO, L. and ARNAU, J. 2003. Effect of sodium chloride replacement on some characteristics of fermented sausages. Meat Sci.65, 833–839.
HEINZERLING, C., STIEGER, M., BULT, J. and SMIT, G. 2011. Individually modified saliva delivery changes the perceived
intensity of saltiness and sourness. Chemosens. Percept.4, 145–153.
HEYMANN, H. and LAWLESS, H.T. 1998.Sensory Evaluation of Food: Principles and Practices, Kluwer Academic/Plenum Publishers, New York.
KEAST, R.S.J. and BRESLIN, P.A.S. 2003. An overview of binary taste–taste interactions. Food Qual. Prefer.14, 111–124. MACGREGOR, G.A. and SEVER, P.S. 1996. Salt – overwhelming
evidence but still no action: Can a consensus be reached with the food industry? BMJ312, 1287–1289.
MILLER, M.J. and BARRINGER, S.A. 2002. Effect of sodium chloride particle size and shape on nonelectrostatic and electrostatic coating of popcorn. J. Food Sci.67, 198–201.
MORRIS, C., KOLIANDRIS, A.-L., WOLF, B., HORT, J. and TAYLOR, A. 2009. Effect of pulsed or continuous delivery of salt on sensory perception over short time intervals. Chemosens. Percept.2, 1–8.
NIMAN, C. 2000. In search of the perfect salt for topping snack foods. Cereal Foods World45, 466–469.
ROSENTHAL, A.J. 1999.Food Texture: Measurement and Perception, Aspen Publishers, Gaithersburg, MD.
SHEPHERD, R., WHARF, S.G. and FARLEIGH, C.A. 1989. The effect of a surface coating of table salt of varying grain-size om perceived saltiness and liking for pate. Int. J. Food Sci. Technol.24, 333–340.
VAN RUTH, S.M. and ROOZEN, J.P. 2010. Delivery of flavours from food matrices. InFood Flavour Technology(2nd Edition) (Andrew J. Taylor and Robert S.T. Linford) Chapter 7, pp. 190–206, Wiley-Blackwell, Oxford, UK.
WHO. 2007. Reducing salt intake in populations: A report of a WHO forum and technical meeting. In World Health Organization, Geneva.
WILSON, C.E. and BROWN, W.E. 1997. Influence of food matrix structure and oral breakdown during mastication on temporal perception of flavor. J. Sensory Studies12, 69–86. WINDISCH A., WINDISCH, H. and POPESCU, A. 2013. Sticky
physics of joy: On the dissolution of spherical candies. Physics Education48, 221–226.