Gene Expression Profiles Predict Sensitivity of Prostate
Cancer to Radiotherapy
Lilach Agemy1, Itai Kela1, Tova Waks1, Raphael M. Pfeffer2, Anat Bar-Shira3, Avi Orr-Urtreger4, Eytan Domany4, Zelig Eshhar1*
1
Department of Immunology, Weizmann Institute of Science, Rehovot, Israel; 2Department of Radiation Oncology, The Sheba Medical Center, Ramat Gan, Israel; 3Genetic Institute, Tel Aviv Sourasky Medical Center, Tel-Aviv University, Tel-Aviv, Israel;
4
Physics of Complex Systems, Weizmann Institute of Science, Rehovot, Israel. Email: *zelig.eshhar@weizmann.ac.il
Received January 7th,2013; revised February 9th, 2013; accepted February 17th, 2013
Copyright © 2013 Lilach Agemy et al. This is an open access article distributed under the Creative Commons Attribution License, which permits unrestricted use, distribution, and reproduction in any medium, provided the original work is properly cited.
ABSTRACT
Ionizing radiation (IR) is the most common treatment used to control localized primary prostate cancer (PC). However, for a significant number of patients, radiotherapy fails to adequately control the tumor. Thus, a main clinical problem today is the lack of a specific marker that may be used to predict the treatment outcome and to identify prostate cancer patients who are unlikely to respond to radiation therapy. In this study, we used human PC xenografts with predeter- mined radioresistant/sensitive phenotypes, and gene expression microarrays, correlated their specific transcriptional profiles with response to radiation. Employing unsupervised two-way hierarchical clustering, we identified four gene clusters displaying different expression patterns. Two clusters showed higher expression levels in the resistant xeno- grafts and the other two clusters showed higher expression levels in the sensitive xenografts. Expression levels of 113 genes differed by at least 3 fold between sensitive and resistant xenografts. These genes represent members of several cellular pathways, some of which are known to be associated with response to radiation. All or several of these genes could serve as predictive tools to determine at biopsy the expected response of a particular tumor to radiotherapy. In- deed, the profiles we identified enabled us to predict the degree of radiosensitivity of a panel of established PC cell lines. Importantly, irradiation of the PC xenografts did not induce any significant changes in gene expression, regardless of their susceptibility phenotype. These data strongly support the first of two models: a: a random effect of irradiation on a homogeneous population of cells, rather than b: of a tumor comprised of a mixture of radioresistant and radiosensitive cell subpopulations. Our findings imply that each of the radio-phenotypes represents different intrinsic characteristics that affect the ability of a tumor to survive radiotherapy.
Keywords: Prostate Cancer; Ionizing Radiation; Radioresistance; Radiosensitive; Gene Microarray; Transcription Profiles
1. Introduction
Surgery and radiotherapy are the mainstays of treatments for localized primary prostate cancer (PC). Direct com- parisons between patients treated with ionizing radiation (IR) and prostatectomy are lacking, and there is no con- sensus regarding the relative effectiveness of these two therapies [1]. The goal of radiation therapy is to provide the highest dose to the tumor, while at the same time minimizing radiation injury to surrounding healthy tissue. One of the main problems with radiotherapy of PC is the high rate of radio-resistance amongst treated tumors. The
lack of a predictive measure to determine the outcome of radiotherapy results in administration of excessive irra- diation to a large proportion of patients, or ineffective treatment of patients with radioresistant tumors. Radia- tion therapy is delivered by either the external or internal (brachytherapy) approach. Today, external radiation ther- apy is given over a 7 to 8 week period with a total of 65 - 78 Gray (Gy) delivered in 1.8 - 2 Gy fractions to the prostate. Patients can receive low doses (<72 Gy) or high-doses (>/=72 Gy) of external-beam radiotherapy depending on disease severity [1]. Results from random- ized clinical trials showed a 45% reduction in disease recurrence among patients assigned to high dose (78 Gy)
*
radiotherapy, compared with those assigned to the stan- dard dose (70 Gy) [2]. Brachytherapy is appropriate for patients with low risk disease, and may be also added to moderate dose (45 Gy) external beam radiotherapy for patients with intermediate-risk disease.
In general, the intracellular cascade of responses to IR occurs through two pathways: 1) Radiation-induced DNA damage inducing conformational alterations and leading to recruitment of DNA repair enzymes, followed by resto- ration of the higher-order DNA structure. 2) Indirect ef- fects initiating signaling cascades of various receptors (such as EGFR, IGF1R) that stimulate translocation of various proteins from the cytoplasm to the nucleus. The outcome of this dynamic combination is arrest of the cell cycle followed by DNA repair leading to cell survival, apoptotic cell death or senescence [3,4]. In human pros- tate cancer, the mechanism determining relative sensi- tivity to irradiation has been related to modifications of a few genes: e.g. mutations in p53 [5,6] and ATM [7], and loss of PTEN [8]. However, these genotypes are found frequently in prostate cancer and do not accurately pre- dict which individual tumor will eventually fail definitive radiation therapy.
Given the complexity of radiation-induced responses, microarray analysis [9] enables to identify a wider range of genes and signaling pathways involved in the response to radiation. While many studies have analyzed the im- mediate gene-expression response to IR, only a few in- vestigated the long-term response [3]. As expected, it became apparent from these studies that there is no single response to radiation. Genetic background, cell type, IR dose, dose rate and time after IR all influence the tran- scriptional profile seen after exposure to irradiation [3].
To study the radioresistant/radiosensitive phenotype of adenocarcinoma of the prostate and to identify those pa- tients at risk of relapse after radiation therapy, we de- fined the effect of irradiation of a group of human PC xenografts grown using the SCID mouse model. Analysis of gene expression profile of these radioresistant and radiosensitive PC xenografts revealed four clusters of expressed genes that could differentiate between radia- tion resistant and sensitive phenotype. Selected genes from this cluster may be useful markers to enable predic- tion of the response patients to radiotherapy.
2. Materials and Methods
PC Cell lines and xenografts: Prostate cancer cell lines LNCaP1740, LNCaP10995, PC-3, DU-145, and 22Rv1, were purchased from American Type Culture Collection (Manassas, VA); LAPC4 was obtained from Dr. Charles L Sawyers (University of California, Los Angeles, CA, [10]); CL-1 was obtained from Dr. A. S. Belldegrun (University of California at Los Angeles, Los Angeles,
CA, [11]). Cells were grown in RPMI 1640 media sup- plemented with 2 mM glutamine, 100 u/mL penicillin, 100 g/mL streptomycin, and 10% FCS. Some cell lines were grown with additional supplements, as follows: LNCaP1740, LNCaP10995 and LAPC4 were grown with 10–9 M testosterone and 5 µg/ml insulin (Sigma-Aldrich Co. St. Louis, MO). DU-145 was grown with 5 µg/ml insulin (Sigma). Cells were incubated in a humidified 37˚C incubator in a 5% CO2 atmosphere.
The LuCaP35 human PC adenocarcinoma xenograft was provided by Dr. R. L. Vessella (University of Wash- ington School of Medicine, Seattle, Washington, USA) [12]. LAPC9 was provided by Dr. C. L. Sawyers (Univer- sity of California, Los Angeles, USA) [10,13]. CWR22 was established at the Case Western Reserve University and provided by Dr. Tom Pretlow (University of North Carolina-Chapel Hill [14]. WISH-PC14 was established in our laboratory from a patient whose PC relapsed fol- lowing radiotherapy, as described in detail elsewhere [15]. WISH-PC23 was also established by our group from prostatic adenocarcinoma harvested during pallia- tive trans urethral resection of the prostate performed in a patient with local progression of adenocarcinoma of the prostate, Gleason score 6 (3 + 3). The patient was previ- ously treated with external beam radiotherapy and total androgen blockade. At the time of tumor progression, there were symptoms of bladder outlet, urethral obstruc- tion, and a PSA rise to 18. All xenografts were main- tained by serial transfers in 4 - 10-week-old SCID mice (c.b-17/Icr Beige). Mice were grown in the pathogen-free facilities of the Weizmann Institute of Science. All of the surgical procedures were performed under ketamin + xylazine anesthesia (127.5 and 4.5 mg/kg respectively) according to the IACUC regulations.
Single dose irradiation in vitro: Single-cell suspen- sions were made by dissociating xenograft fragments by mincing them through a stainless still mesh and separa- tion over Ficoll-Paque 400. The cell suspensions were irradiated by a Cobalt 60 source, emitting 65 cGy/min (Gammabeam-150, MDS Nordion). After irradiation, cells or tissue in HBSS medium were mixed with Ma- trigel (Becton Dickinson, Bedford, MA), and were im- planted (5 × 10⁶ cells or small pieces of tumor (80 - 100 mg/mouse) subcutaneously (s.c.) in male SCID mice. Tumor growth was followed for up to a year after irra- diation.
PC cell lines cultured in 6-well culture plates at 60% to 70% confluence were irradiated at a rate of 65 cGy/ min. The cells were irradiated at 5, 10, 40, 80 or 160 Gy and incubated until colonies appeared.
150 - 200 mm3, mice were anesthetized (under ketamin + xylazine 127.5 and 4.5 mg/kg, respectively), shielded, allowing only the right hind leg to be exposed, and re- ceived fractionated radiation using a Caesium 137 source (at dose rate of 100 cGy/min (Gammacell 40 Exactor, MDS Nordion)). Irradiation was given daily for 5 con- secutive days, followed by a two day break, for the total number of fraction as indicated. Tumor growth was fol- lowed for up to 1 year after irradiation.
Measurement of tumor growth and sample collection:
Local tumor size was determined at weekly intervals by caliper measurements of length, width, and depth, and the tumor volume (mm3) was approximated using the formula: length × width × depth × 0.5236 [16].
Samples were collected from 12 tumors; either un-ir- radiated or from xenografts that relapsed (2 - 6 months) after irradiation using the highest tolerated dose. Samples analyzed include CWR22 (un-irradiated and survivors of 20 Gy), WISH PC-23 (un-irradiated and survivors of 40 Gy), LuCAP35 (un-irradiated and survivors of 20 Gy and 60 Gy), LAPC9 (un-irradiated and survivors of 80 Gy and 160 Gy) and WISH PC-14 (un-irradiated and survi- vors of 120 Gy). Samples were kept frozen in liquid ni- trogen until their processing for gene array.
Microarray experiments: Total RNA was isolated from frozen tissues using the TRI Reagent (Sigma), ac- cording to the manufacturer’s instructions and purified using RNEasy Mini kit (Qiagen, Hilden, Germany), ac- cording to the manufacturer’s instructions.
Gene expression was measured using Human Genome U133 plus 2.0 GeneChips (Affymetrix, Santa Clara, CA). Gene Chips were prepared, hybridized, and scanned ac- cording to the manufacturer’s instructions. Briefly, 10 µg total RNA was reverse transcribed with a poly-(T) primer containing a T7 promoter. The cDNA obtained was tran- scribed to produce biotinylated cRNA, which was then hybridized to the GeneChips. The chips were washed and stained with streptavidin phycoerythrin using an Affy- metrix FS-450 fluidics station, and data were collected with Affymetrix GeneChip Scanner 3000.
Clustering analysis: Clustering analysis of the gene array data was performed by first selecting probe sets that were present at least in one out of the tested samples (P </= 0.05). 31,690 (out of 54,613) probe-sets passed this filter. Next, three filtering steps were preformed:
1) Identify probe sets whose expression levels in- creased more than three fold in the irradiated samples (over their matched non-irradiated samples); 967 probe- sets passed this filter.
2) Select the 2000 most variable probe-sets measured in the tested samples.
3) Mark the 1650 probe-sets that best distinguished the sensitive from the resistant xenografts (non-parametric Wilcoxon Rank Sum test, P < 0.05, FDR 5%). For this
process, we grouped the LuCAP35 line (which demon- strated intermediate radioresistant phenotype) with the resistant xenografts (LAPC9, WISH-PC14); when Lu- CAP35 was grouped with the sensitive xenografts (CWR22 and WISH PC-23), the RankSum test yielded only 593 significant genes (P < 0.05, FDR 5%).
The clustering analysis was based on the 3730 probe sets that fulfilled at least one of the three aforementioned filtering criteria.
The gene clustering operation was done using the Super-Paramagnetic Clustering algorithm [17-20]. The samples and the genes of each cluster were sorted, using the SPIN algorithm [18].
Statistical analysis: Statistical analysis was performed using JMP statistical software (SAS Institute, Inc., Cary, NC). Tumor volume data were analyzed by the Fit model, to test the effect of different doses of irradiation during the experimental period.
3. Results
3.1. Radiosensitivity of Prostate Cancer Xenografts and Cell Lines
To determine the gene expression profile of the various human prostate cancer adenocarcinoma xenografts and cell lines, we first evaluated their ability to grow under the skin of SCID mice following either a single in vitro
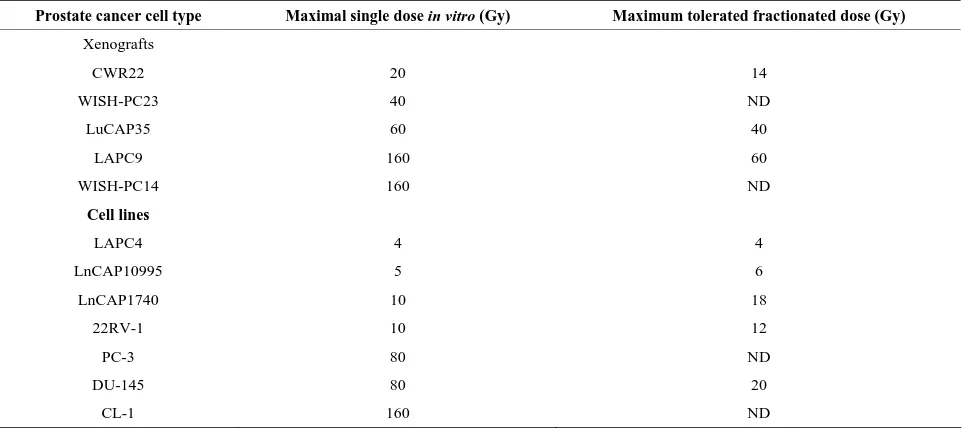
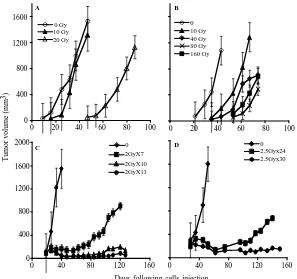
irradiation dose or fractionated irradiation in SCID mice. The range chosen for irradiation, between 4 to 160 Gy, relied on the maximal level of radiation employed in clinical practice (using bracytherapy), which is higher than 140 Gy [19]. Table 1 summarizes the highest dose of IR beyond which no tumor grew. Figure 1 describes the growth curves of representative xenografts. The tested PC xenografts and cell lines exhibited variability in their resistance to radiation, manifesting two phenol- types: IR sensitive phenotype, exemplified by the CWR22 xenograft, which grew in mice following to a single
ex-vivo dose of 20 but did not develop into a tumor for a year following their irradiation with >20 Gy (Figure 1(a)). The IR resistant phenotype is exemplified by LAPC9 (Figure 1(b)), which formed tumors even fol- lowing to a dose of 160 Gy.
In both of the phenotypes, no change in the growth rate, before or after IR, was observed. Nevertheless, in- creased doses of irradiation resulted in an increase of the lag time before tumor growth was observed in vivo. The lag time increment, as well as the fraction of mice that developed tumors following IR, are a function of the
number of cells that survived IR. The delay in tumor ap- pearance reflects a decline in the viable cell number re- sulting from the IR.
Determining the sensitivity range for a single IR dose
[image:4.595.58.541.472.686.2]ex-vivo, we next tested whether a similar phenotypic dis-tribution holds for fractionated irradiation, as is actually administered clinically. Hence, we treated the mice using a protocol similar to that applied to prostate caner pa-tients, including a total of 65 - 78 Gy delivered in 1.8 - 2 Gy doses over a 7 to 8 week period. The human PC xenografts were injected into the hind limb of SCID mice and when tumor volume reached the volume of 150-200 mm3, mice were shielded and the exposed tumor bearing limb was irradiated using the Caesium 137 source at the indicated doses (Figure 1). In view of the fact that frac- tionated radiation is more effective than a single dose, the total dose administered was close to the maximal dose obtained by single dose irradiation. For example, 80% of CWR22, a xenograft that is sensitive to a single dose of radiation (20 Gy), relapsed after fractionated ir- radiation of total dose of 14 Gy (2Gy × 7) but no relapses were observed with total doses of 20 Gy (2Gy × 10) and 26 Gy (2Gy × 13) (Figure 1(c)). Fractionated irradiation of LAPC9, the most radiation resistant xenograft, showed that following to total dose of 60 Gy (2.5 Gy × 24) tu- mors relapsed in four out of five mice, but no relapses were observed with a total dose of 75 Gy (2.5 Gy × 30) (Figure 1(d)). These data support the phenotypic classi- fication that was determined based on a single dose of irradiation.
Table 1. Effect of irradiationon the growth of prostate cancer xenografts and cell lines.
Prostate cancer cell type Maximal single dose in vitro (Gy) Maximum tolerated fractionated dose (Gy) Xenografts
CWR22 20 14
WISH-PC23 40 ND
LuCAP35 60 40
LAPC9 160 60
WISH-PC14 160 ND
Cell lines
LAPC4 4 4
LnCAP10995 5 6
LnCAP1740 10 18
22RV-1 10 12
PC-3 80 ND
DU-145 80 20
CL-1 160 ND
0 20 40 60 80 100
0 10 Gy 40 Gy 80 Gy 160 Gy
A
0 Gy 10 Gy 20 Gy
0 400 800 1200 1600
0 20 40 60 80 100
Days following cells injection
Tum
o
r vo
lu
me
(
m
m
3)
0 2GyX7 2GyX10 2GyX13
0 400 800 1200 1600 2000
0 40 80 120 160
0 2.5Gyx24 2.5Gyx30
0 40 80 120 160
B
[image:5.595.151.448.83.362.2]C D
Figure 1. PC xenograft growth in SCID mice following irradiation: The figure depicts the growth in SCID mice of represen-tative PC xenografts (shown in Table 1) with or without irradiation. (A, C) CWR22, (represents the radiosensitive and LAPC9 (B, D) represents the radioresistant xenografts. Xenografts were either irradiated ex-vivo by the indicated single dose (A, B) before their transplantation or by fractionated irradiation (C, D) in vivo. The tumor volume shown represents an av-erage of five mice/group. Kinetics of tumor growth were measured until >50% of the mice died (the values shown represent averages of mice that developed tumor).
3.2. Comparison of the Gene Transcription Profiles between the Two IR Phenotypes
To describe and compare the transcription patterns be- tween IR resistant and sensitive xenografts, we hybrid- ized cRNA from non-irradiated and irradiated xenografts to an oligonucleotide microarray (Affymetrix, U133P2), containing probes corresponding to 54,613 human tran- scripts. Gene expression profiling of 12 experimental samples was performed, four of which were derived from radiation-sensitive xenografts: CWR22 (un-irradiated and cells surviving 20 Gy) and WISH PC-23 (un-irradi- ated cells, and those surviving 40 Gy), and five sam- ples were processed from radiation-resistant xenografts: LAPC9 (un-irradiated and cells surviving of 80 Gy and 160 Gy) and WISH PC-14 (un-irradiated and cells sur- viving of 120 Gy). Another xenograft sample was Lu- CAP35 (un-irradiated and surviving of 20 Gy and 60 Gy) that represented an intermediate level of IR sensitivity (Table 1).
Unsupervised analysis of the data was conducted to search for clusters shared by either IR resistant or sensi- tive PC xenografts. We used 3730 probe-sets that passed the filtering process, as described in the Materials and
(a)
2
3
5
6
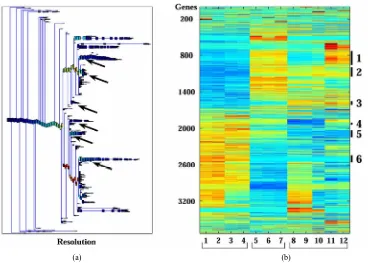
[image:6.595.83.260.86.503.2](b)
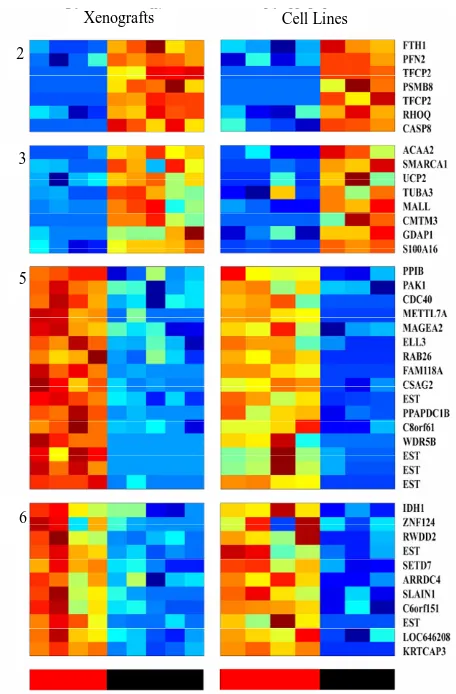
Figure 2. Clusters that separate the radio-sensitive from the radio-resistant PC phenotypes; (a) Expression matrix of 4 clusters consisting 456 probesets (corresponding to 113 genes (rows) and 12 PC xenograft samples (columns). The genes are centered and normalized, and ordered according to the sorter algorithm. The color represents increase (red) or decrease (blue) in gene expression. PC xenografts are ordered according to their sensitivity to IR (see color bar in the bottom of the expression matrix); red represents the Sensitive xenografts (WISH-PC23 in columns 1 and 2 and CWR22 in columns 3 and 4), green represents the Semi- resistant xenograft (LuCap35 in columns 5-7), and black represents the Resistant xenografts (LAPC9 in columns 8 and 9 and WISH-PC14 in columns 11 and 12). The upper color bar indicates the non-irradiated (light blue) versus the irradiated (pink) cells, and the maximal irradiation dose used. (b) Representation of the distance relationship between the 12 samples by PCA analysis. The Sensitive, Resistant and Semi-resistant samples are marked by red, black and green dots, respectively. X, Y and Z-axis represents the first, second and third principal components, respectively.
of 157 probe-sets and cluster 3 consisted of 66 probe-sets that were highly expressed in the resistant samples. We focused on a set of 87 (including 7 ESTs) probe sets (out of the 223 probe sets contained in clusters 2 and 3) that displayed at least 3-fold up-regulation in the resistant samples, compared to the average expression levels of the sensitive samples. The up-regulated genes that were highly expressed in the IR resistant samples (Supple- mentary Tables 1 and 2) included a number of genes involved in cell survival and death such as: Cell growth genes: SNN, KLK2, ACPP; angiogenesic factors AGTR1, IL1R1, ZNF323, FMNL2, KLF13 and PTK7, DNA re- pair genes, e.g. H2AFJ, HIST1H2BK, HIST1H2BD and SMARA1, Cell death genes: CASP8 and 4, LITAF, GULP and UCP2 and an inhibition of cell growth gene: IFITM3.
The opposite picture was seen in clusters 5 and 6, which consisted of 117 and 116 probe-sets, respectively, which were highly expressed in the IR sensitive cells relative to the resistant lines. We focused on a set of 71 (including 7 ESTs; (Supplementary Tables 3 and 4)that displayed up-regulation of at least 3-fold in the sensitive compared to the average expression levels of the resistant samples. These include a number of genes that are in- volved in cell death and survival, e.g.: Cell death and apoptosis genes such as TP53, PTEN, DUSP6. Interest- ingly, this group included also increased expression of genes involving in Growth and survival promotion, in- cluding ETS2, CFC1, RAB26, and ATF7.
PCA clearly shows the same differences that have been seen in the clustering analysis (Figure 2(b)). It demonstrates that the groups representing the resistant xenografts (WISH-PC14 and LAPC9), the sensitive ones (CWR22 and WISH-PC23) and LuCAP35 each differ in their gene expression profiles. This observation may re- flect the inherent properties of the response to irradiation. Altogether, the data presented so far identify 456 probe- sets (113 genes) that differentiate between the IR resis- tant and IR sensitive phenotypes. Table 2 summarizes the ratio of expression between several genes in these two IR phenotypes according to their functional affiliation.
To confirm the microarray data and to establish its re- producibility, we selected candidate genes and tested their expression using quantitative RT-PCR. We selected one gene per cluster, based on the gene expression analy- sis described above (cluster 2- H2AFJ, cluster 3-UCP2, cluster 5-RAB26, cluster 6-PTEN). The expression of these genes, when measured by Q-PCR, confirmed the Gene Chip analysis (data not shown).
3.3. Microarray Data of Radioresistant/Sensitive PC Cell Lines Shortens the List of
Phenotype-Predictive Genes
Table 2. Summary of gene expression in the radio-resistant and radio-sensitive cells. Function
Phenotype Cell Death* DNA Repair Proliferation Cell Growth Inhibition Angiogenesis Growth Arrest
CASP8 (×9) H2AFJ v2 (×104) IL1R1 (×4) IFITM3 (×29) GUCY1A3 (×10)
CASP4 (×12) HIST1H2BK (×5) NRP1 (×4)
LITAF (×5) HIST1H2BD (×8) AGTR1 (×4)
CD24 (×11)
GULP1 (×8) RESISTANT
(Resistant/Sensitive)
UCP2 (×13)
TP53 (×11) IMP3 (×49) BTG1 (×4)
PTEN (×14) RAB26 (×4)
DUSP6 (×8) SENSITIVE
(Sensitive/Resistant)
TNFRST10D (×8)
*Numbers in parenthesis represent the fold expression.
Xenografts
2
3
5
6
Cell Lines
analysis and to identify a more limited list of genes that are significantly able to differentiate between sensitive and resistant samples, we used an additional and inde- pendent set of 7 PC cell lines; four of them were shown to be radiation sensitive and three resistant (Table 1). RNA isolated from these cells was subjected to gene ar- ray on the same array used for above. The expression profile of the 456 probesets that differentiated between the IR resistant and sensitive xenografts (Figure 3) were tested on the cell-line data. Using this approach, we iden- tified 46 probe sets (corresponding to 41 genes) that best distinguished between the radioresistant/sensitive phe- notypes (using t-test, p < 0.01, FDR 10%, Figure 3). The pattern of expression of this set of 41 genes may provide a transcriptional signature to predict the response of a prostate tumor to radiotherapy, an option that should be further validated.
3.4. Irradiation Does Not Impact the Long-Time Pattern of Gene Expression.
[image:7.595.309.537.277.624.2]To explore whether irradiation affects the gene expres- sion profile of the surviving PC cells, we compared the gene expression data obtained from the xenografts before and several months after their irradiation and growth in mice. We applied two supervised approaches, both of them based on the 10,000 genes with the highest standard deviation across the 12 samples. First, we performed a RankSum test in attempt to identify genes that can dis- tinguish between non-irradiated and irradiated samples from radiation sensitive cell lines. In the second approach we carried out a Two Way ANOVA test to determine the relationships between the irradiation effects and radiation resistant/sensitive phenotype. Our analysis showed no statistically significant probe-sets, and we concluded that irradiation of the PC xenografts did not induce any sig- nificant changes in gene expression, regardless of their susceptibility phenotype (data not shown).
3.5. Models for Radioresistant/Sensitivity of Prostate Cancer
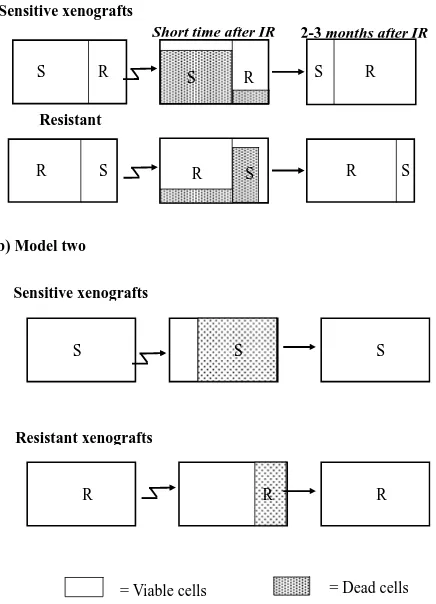
We considered two possible models for the different re- sponses seen following irradiation can be considered:
Model a (Figure 4(a)): Existence of two distinct sub- populations within a given xenograft. According to this model, the cell population within each xenograft consists of a mixture of two types- IR sensitive (S) and IR resis- tant (R) cells. Most of the sensitive cells die a short time after IR (some sensitive cells survive because of the sto- chastic effects of IR), while most of the resistant cells survive (though a small fraction will also die).
According to this model, in a sensitive xenograft, most of the population before IR consists of sensitive cells and only a small fraction contains resistant cells. A few months after exposure to IR, the ensemble of the cell population changes and the resistant population domi- nates. In the resistant xenografts, the majority of the cells resist IR. After a few months, there is a reduction in the sensitive population, but since it was small to begin with, the composition of the population before and after the IR
= Viable cells R
S R S R
R S
R S
Short time after IR 2-3 months after IR
Resistant
S R
S
(b) Model two
Sensitive xenografts
Resistant xenografts
S S S
R
S
R R
= Dead cells
[image:8.595.68.286.373.675.2]Sensitive xenografts (a) Model one
Figure 4. Two hypothetical models for radioresistance/sen- sitivity of prostate cancer xenografts: (a) Model a: two dis-tinct subpopulations within a given xenograft; (b) Model b: each xenograft contains a homogeneous population of cells that have equal chance to survive/die after irradiation.
does not change significantly. Thus, if this model is cor- rect, we predict that following irradiation, sensitive xeno- grafts will convert from dominantly sensitive (S) to dominantly resistant (R) sub-populations. This would be expected to cause a change in the gene expression profile before versus after IR. For the resistant xenografts, no significant change is expected to occur within the sub- populations after irradiation and therefore no change in gene expression is expected.
Model b (Figure 4(b)): Each xenograft is homogene- ous, and all cells within a xenograft have about the same chance to survive/die after irradiation. According to this model, each tumor contains a cell population that re- sponds uniformly to radiation. Thus, every cell in a given xenograft has nearly the same probability of dying from IR. The probability of dying is greater for a sensitive cell, than for a resistant one. Thus, a short time after radiation, most of the cells in the sensitive xenograft die, but only a small fraction of those in the resistant xenograft die. In this case, a few months after IR we expect the population ensemble of each phenotype to remain unchanged. Ac- cording to this model, no significant gene expression changes are expected in the tumors on a population level, in either the sensitive or in the resistant xenografts.
The similarity in the gene expression patterns between the non-irradiated and irradiated xenografts support
Model b (Figure 4(b)) which asserts a random effect of the irradiation on a homogeneous population of cells. Each xenograft has a different intrinsic phenotype that influences its capability to survive the IR. Model a, which suggests mixtures of resistant and sensitive cells, apparently does not accurately describe this system.
4. Discussion
In this study we have established the gene expression profile that distinguishes between radiation resistant and radiation sensitive human prostate cancer. For decades, IR has been used therapeutically to treat primary prostate tumors and its bone metastases. Because of the high fail- ure rate (5-year biochemical failure rate of 10% - 40%) after external-beam radiation therapy [22] we expect our data to help in the selection of patients who can benefit from this therapeutic approach. We hope that the genetic profile described here will provide specific parameters that can predict the long term treatment outcome, or identify prostate cancer patients who are not expected to respond to radiotherapy. Such patients could be offered alternative treatment modalities (e.g. surgery).
sentative of the patient’s than cell lines and therefore the core of our findings is based on a cohort of xenorafts. By analysis of the gene array data (Supplementary Figure 1) employing unsupervised two-way hierarchical clus- tering, we identified four gene clusters displaying differ- ent expression behavior across the resistant and the sen- sitive xenografts (Figure 2). Two clusters showed higher expression levels in the resistant xenografts and the other two clusters showed higher expression levels in the sen- sitive xenografts. The expression of 113 genes was sig- nificantly changed (p < 0.01 and at least 3 fold) in sensi- tive compared to resistant xenografts. By comparing this list of genes derived from the PC xenografts to the data obtained using PC cell lines 41 genes shared a similar pattern in distinguishing between the irradiation sensitive and resistant phenotypes (Figure 3). These genes repre- sent a primary list of genes whose expression may repre- sent a genetic signature to predict the outcome of a given prostate tumor to radiotherapy. Nonetheless, further vali- dation using clinical material is required to translate these data for patients’ diagnosis.
The genes in the list represent several cellular mecha- nisms (such as DNA repair, cell death (apoptosis, onco- sis), angiogenesis and cell growth (Supplementary Ta- bles 1-4). As such, they embody the complexity of the molecular processes involved in radioresistance/sensi- tivity. The genes whose transcription differentiates be- tween the radioresistant and radiosensitive PC xenografts do not necessarily reflect the immediate mechanisms that either doom or rescue a given cell from a given dose of irradiation. Nevertheless, considering these limitations, it is of interest to point out and describe several of the genes whose transcription pattern differentiates between the radioresistant and radiosensitve phenotypes in the context of their cellular function (summarized in Table 2). Several of these genes, such as TP53 and PTEN were previously reported to be related to radioresistance (5 - 8). These two tumor suppressor and pro-apoptotic genes are up regulated after radiotherpy, and it was found that de- regulation (or deletion in of these genes) contributes to the radiation resistance of some cancers (e.g. prostate, glioma) [23]. In our study, these two genes were down- regulated or not-expressed in the radioresistant xeno- grafts.
Comparing the data obtained in this study concerning the effect of IR on PC xenografts, with data obtained from other types of human cancerscouldidentify a com- mon set of genes related to the radiorestant/sensitive phenotypes. Several groups investigated the long-term transcriptional response to irradiation. Kitahara et al. ex- amined the molecular profiles of radioresistant cervical squamous cell carcinoma versus sensitive cancers and showed that the expression of 62 genes could predict IR resistant versus sensitive tumors [24]. Vellant et al. com-
pared the gene expression of B-cell chronic lympocytic leukemia (B-CLL) cells that were either sensitive or re- sistant to radiation. Sixteen genes were differentially regulated by at least 2 fold in the resistant cells [25]. Fu- kuda et al. studied six esophageal cancer cell lines that were treated with continuous fractionated irradiation and compared expression profiles of each parent to its radio- resistant clones using a cDNA microarray. Nineteen up-regulated and 28 down-regulated genes were common to radioresistant cell lines [26]. The study of the cervical cancer [24] response to IR, suggested that radioresistance is maintained via increased expression of a DNA repair component (XRCC5/Ku80), while in leukemia it is po- tentially mediated by up regulation of anti-apoptotic (e.g. c-IAP1, c-rel) and growth control (c-myc) gene [25]. Radiosensitivity in these studies was associated with an increased expression of MAP kinase signaling genes (24, 25) In oesophageal carcinoma cells [26], IR resistance was shown to be related to upregulation of anti-apoptotic (BIRC2 related to IAP family) and growth control (COX and CD73). Interestingly, none of these gene products were included in the short list in our screen. Since our study is based only on transcriptional analysis, it can only provide a superficial indication to the complex mechanisms that are involved in the radiorsistance/sen- sitivity of PC. Our gene expression list show an in- creased expression of DNA repair associated genes such as H2AFJ, HIST1H2BK, HIST1H2BD and loss of the two tumor suppressor genes (PTEN and p53) in the ra- dioresistant samples. In our radiosensitive PC xenografts an increase in growth factors related to the EGF gene family (CFC1), RAS oncogene family (RAB26) and IGF-2 binding protein 3 (Supplementary Table 2). Taken together, and with the reservations mentioned above, our studies indicate that several key functional pathways to be associated with the cell fate following irradiation. Resistant prostate cancer samples displayed an increase in DNA repair components and decrease in apoptotic components, both are the hallmarks of the ra- dioresistant phenotype. Similarly, in IR-sensitive tumors, a common feature is the elevation of growth factor gene expression. Apparently, such an increase is associated with enhanced cell division, thereby rendering the cell more sensitive to IR. It is likely that the end phenotype is determined by equilibrium between these gene products. Nevertheless, the exact role of these genes in the acquisi- tion of tumor resistance to radiation still remains to be elucidated.
of the cell composing the radiosensitive and radioresistat prostate tumors (Figure 4), the second model which suggests the random effect of irradiation on a homoge- neous population of cells, more accurately reflects the response of these cells. Each xenograft has a different intrinsic character that influences its capability to survive IR. Model 1, which suggests that different subpopula- tions with different sensitivities to irradiation exist within the tumor, is apparently not operative in this system. In a similar protocol to ours, yet using other systems, two groups studied the profile of gene expression between irradiated and non-irradiated normal lymphocytes and kidney, long after irradiation. However, unlike our stud- ies, these analyses showed differences in gene expression before versus after irradiation. Flats et al. [27] reported that the number of genes that were differentially ex- pressed between irradiated and non irradiated human lymphocytes was increased with time following IR. Kruse et al. [28])who studied the effect of IR on normal murine kidneys, found that with time following IR, the expression of genes that underwent down-regulation was increased and the number of genes that underwent up- regulation was decreased. A possible explanation to the discrepancy between these studies using normal tissues and ours, using malignant tissues, is that normal tissues are most likely heterogeneous in nature, while the pros-tate cancer xenografts consisted of a more homogeneous population.
Overall, the transcriptional patterns that distinguish be- tween radioresistant and radiosensitive prostate cancer xenografts hold promise, after their further validation, to serve as a predictive tool, to determine right at early diag- nosis, which PC patient will benefit from irradiation or resort to other treatment. Our finding suggests that both radioresistant and radiosensitive tumors are composed from homogeneous population in term of their response to irradiation, implies that with a proper design of the irradiation dose and schedule of its administration to the radiosensitive tumors, a complete cure of localized pri- mary tumors with less side effects is feasible.
5. Acknowledgements
We are grateful to Dr. J. Pinthus for his outstanding as- sistance in the characterization of the PC xenografts gen- erated at the Weizmann Institute of Science, Dr. Shirly Horn Saban for conducting the gene array analysis, Dr. Shelley Schwarzbaum for manuscript editing, and Dr. Tatyana Rabin for her helpful advice.
This study was supported in part by the Prostate Can- cer Foundation, the Wolfson Foundation, the Ridgefield Foundation, by research grants from Ms Marion Achten- tuch and from the Kuhn Family. We dedicate this article to the memory of Mr. Michael Dobrin.
REFERENCES
[1] T. M. Pisansky, “External-Beam Radiotherapy for Local- ized Prostate Cancer,” The New England Journal of Me- dicine, Vol. 355, No. 15, 2006, pp. 1583-1591.
doi:10.1056/NEJMct055263
[2] A. Pollack, G. K. Zagars, G. Starkschall, J. A. Antolak, J. J. Lee, E. Huang, A. C. von Eschenbach, D. A. Kuban and I. Rosen, “Prostate Cancer Radiation Dose Response: Results of the M. D. Anderson Phase III Randomized Trial,” International Journal of Radiation Oncology*Bi- ology*Physics, Vol. 53, No. 5, 2002, pp. 1097-1105. doi:10.1016/S0360-3016(02)02829-8
[3] A. R. Snyder and W. F. Morgan, “Gene Expression Pro- filing after Irradiation: Clues to Understanding Acute and Persistent Responses?” Cancer and Metastasis Reviews, Vol. 23, No. 3-4, 2004, pp. 259-268.
doi:10.1023/B:CANC.0000031765.17886.fa
[4] M. H. Bourguignon, P. A. Gisone, M. R. Perez, S. Mich- elin, D. Dubner, M. D. Giorgio and E. D. Carosella, “Ge- netic and Epigenetic Features in Radiation Sensitivity Part I: Cell Signalling in Radiation Response,”European Journal of Nuclear Medicine and Molecular Imaging, Vol. 32, No. 2, 2005, pp. 229-246.
doi:10.1007/s00259-004-1730-7
[5] P. J. Colletier, F. Ashoori, D. Cowen, R. E. Meyn, P. Tofilon, M. E. Meistrich and A. Pollack, “Adenoviral- Mediated p53 Transgene Expression Sensitizes Both Wild- Type and Null p53 Prostate Cancer Cells in Vitro to Ra- diation,” International Journal of Radiation Oncology* Biology*Physics, Vol. 48, No. 5, 2000, pp. 1507-1512. doi:10.1016/S0360-3016(00)01409-7
[6] J. M. Lee and A. Bernstein, “p53 Mutations Increase Resistance to Ionizing Radiation,” Proceedings of the National Academy of Sciences of the United States, Vol. 90, No. 12, 1993, pp. 5742-5746.
doi:10.1073/pnas.90.12.5742
[7] Z. Fan, P. Chakravarty, A. Alfieri, T. K. Pandita, B. Vik- ram and C. Guha, “Adenovirus-Mediated Antisense ATM Gene Transfer Sensitizes Prostate Cancer Cells to Radia- tion,” Cancer Gene Therapy, 7, No. 10, 2000, pp. 1307- 1314. doi:10.1038/sj.cgt.0243
[8] C. J. Rosser, M. Tanaka, L. L. Pisters, N. Tanaka, L. B. Levy, D. C. Hoover, H. B. Grossman, T. J. McDonnell, D. A. Kuban and R. E. Meyn, “Adenoviral-Mediated PTEN Transgene Expression Sensitizes Bcl-2-Expressing Pros- tate Cancer Cells to Radiation,” Cancer Gene Therapy, Vol. 11, No. 4, 2004, pp. 273-279.
doi:10.1038/sj.cgt.7700673
[9] G. Bucca, G. Carruba, A. Saetta, P. Muti, L. Castagnetta and C. P. Smith, “Gene Expression Profiling of Human Cancers,”Annals of the New York Academy of Sciences, Vol. 1028, 2004, pp. 28-37. doi:10.1196/annals.1322.003
[11] C. L. Tso, W. H. McBride, J. Sun, B. Patel, K. H. Tsui, S. H. Paik, B. Gitlitz, R. Caliliw, A. van Ophoven, L. Wu, J. deKernion and A. Belldegrun, “Androgen Deprivation In- duces Selective Outgrowth of Aggressive Hormone-Re- fractory Prostate Cancer Clones Expressing Distinct Cel- lular and Molecular Properties Not Present in Parental Androgen-Dependent Cancer Cells,” The Cancer Journal, Vol. 6, No. 4, 2000, pp. 220-233.
[12] E. Corey, J. E. Quinn, K. R. Buhler, P. S. Nelson, J. A. Macoska, L. D. True and R. L. Vessella, “LuCaP 35: A New Model of Prostate Cancer Progression to Androgen Independence,” Prostate, Vol. 55, No. 4, 2003, pp. 239- 246. doi:10.1002/pros.10198
[13] N. Craft, C. Chhor, C. Tran, A. Belldegrun, J. DeKernion, O. N. Witte, J. Said, R. E. Reiter and C. L. Sawyers, “Evidence for Clonal Outgrowth of Androgen-Indepen- dent Prostate Cancer Cells from Androgen-Dependent Tumors through a Two-Step Process,” Cancer Research, Vol. 59, No. 19, 1999, pp. 5030-5036.
[14] M. A. Wainstein, F. He, D. Robinson, H. J. Kung, S. Sch- wartz, J. M. Giaconia, N. L. Edgehouse, T. P. Pretlow, D. R. Bodner, E. D. Kursh, et al., “CWR22: Androgen-De- pendent Xenograft Model Derived from a Primary Hu- man Prostatic Carcinoma,” Cancer Research, Vol. 54, No. 23, 1994, pp. 6049-6052.
[15] A. Bar-Shira, J. H. Pinthus, U. Rozovsky, M. Goldstein, W. R. Sellers, Y. Yaron, Z. Eshhar and A. Orr-Urtreger, “Multiple Genes in Human 20q13 Chromosomal Region Are Involved in an Advanced Prostate Cancer Xeno- graft,” Cancer Research, Vol. 62, No. 23, 2002, pp. 6803- 6807.
[16] M. E. Gleave, J. T. Hsieh, H. C. Wu, A. C. von Eschen- bach and L. W. Chung, “Serum Prostate Specific Antigen Levels in Mice Bearing Human Prostate LNCaP Tumors Are Determined by Tumor Volume and Endocrine and Growth Factors,” Cancer Research, Vol. 52, No. 6, 1992, pp. 1598-1605.
[17] M. Blatt, S. Wiseman and E. Domany, “Superparamag- netic Clustering of Data,” Physical Review Letters, Vol. 76, No. 18, 1996, pp. 3251-3254.
[18] D. Tsafrir, I. Tsafrir, L. Ein-Dor, O. Zuk, D. A. Notter- man and E. Domany, “Sorting Points into Neighborhoods (SPIN): Data Analysis and Visualization by Ordering Distance Matrices,” Bioinformatics, Vol. 21, No. 10, 2005, pp. 2301-2308.
[19] S. E. Langley and R. Laing, “Prostate Brachytherapy Has Come of Age: A Review of the Technique and Results,” BJU International, Vol. 89, No. 3, 2002, pp. 241-249. doi:10.1046/j.1464-4096.2001.01610.x
[20] K. Kannan, N. Amariglio, G. Rechavi, J. Jakob-Hirsch, I. Kela, N. Kaminski, G. Getz, E. Domany and D. Givol, “DNA Microarrays Identification of Primary and Secon- dary Target Genes Regulated by p53,” Oncogene, Vol. 20, No. 18, 2001, pp. 2225-2234. doi:10.1038/sj.onc.1204319
[21] G. Getz, E. Levine and E. Domany, “Coupled Two-Way Clustering Analysis of Gene Microarray Data,” Proceed- ings of the National Academy of Sciences of the United States, Vol. 97, No. 22, 2000, pp. 12079-12084.
doi:10.1073/pnas.210134797
[22] S. L. Scott, P. H. Gumerlock, L. Beckett, Y. Li and Z. Goldberg, “Survival and Cell Cycle Kinetics of Human Prostate Cancer Cell Lines after Single- and Multifraction Exposures to Ionizing Radiation,” International Journal of Radiation Oncology*Biology*Physics, Vol. 59, No. 1, 2004, pp. 219-227. doi:10.1016/j.ijrobp.2004.01.027
[23] E. H. Chang, K. F. Pirollo and K. B. Bouker, “Tp53 Gene Therapy: A Key to Modulating Resistance to Anticancer Therapies?” Molecular Medicine Today, Vol. 6, No. 9, 2000, pp. 358-364. doi:10.1016/S1357-4310(00)01767-6
[24] O. Kitahara, T. Katagiri, T. Tsunoda, Y. Harima and Y. Nakamura, “Classification of Sensitivity or Resistance of Cervical Cancers to Ionizing Radiation According to Ex- pression Profiles of 62 Genes Selected by cDNA Mi- croarray Analysis,” Neoplasia, Vol. 4, No. 4, 2002, pp. 295-303. doi:10.1038/sj.neo.7900251
[25] L. Vallat, H. Magdelenat, H. Merle-Beral, P. Masdehors, G. P. de Montalk, F. Davi, M. Kruhoffer, L. Sabatier, T. F. Orntoft and J. Delic, “The Resistance of B-CLL Cells to DNA Damage-Induced Apoptosis Defined by DNA Mi- croarrays,” Blood, Vol. 101, No. 11, 2003, pp. 4598-4606. doi:10.1182/blood-2002-06-1743
[26] K. Fukuda, C. Sakakura, K. Miyagawa, Y. Kuriu, S. Kin, Y. Nakase, A. Hagiwara, S. Mitsufuji, Y. Okazaki, Y. Ha- yashizaki and H. Yamagishi, “Differential Gene Expres- sion Profiles of Radioresistant Oesophageal Cancer Cell Lines Established by Continuous Fractionated Irradia- tion,” British Journal of Cancer, Vol. 91, No. 8, 2004, pp. 1543-1550. doi:10.1038/sj.bjc.6602187
[27] S. Falt, K. Holmberg, B. Lambert and A. Wennborg, “Long-Term Global Gene Expression Patterns in Irradi- ated Human Lymphocytes,” Carcinogenesis, Vol. 24, No. 11, 2003, pp. 1837-1845. doi:10.1093/carcin/bgg134 [28] J. J. Kruse, J. A. te Poele, A. Velds, R. M. Kerkhoven, L.
J. Boersma, N. S. Russell and F. A. Stewart, “Identifica- tion of Differentially Expressed Genes in Mouse Kidney after Irradiation Using Microarray Analysis,” Radiation Research, Vol. 161, No. 1, 2004, pp. 28-38.
Abbreviations
IR, ionizing radiation; PC, prostate cancer; PSA, prostate specific antigen; PCA, principal component analysis.
Supplementary
[image:12.595.116.486.142.405.2](a) (b)
Figure 1. Clustering results using super-paramagnetic clustering for the 3730 probe sets that passed through one of three filters. (a) Dendrogram of the genes that includes clusters (each box represent a cluster) of size 3 and larger. The red arrows mark the six clusters analyzed; (b) Expression matrix of the 12 samples. The genes (row) are normalized and ordered ac-cording to the dendrogram on the left. The color represents induction (red) or repression (blue). The six clusters are marked by black lines at the right hand side of the matrix. The samples are divided according to their sensitivity to the IR (see bottom of the matrix). The “Sens” (sensitive samples) group includes the WISH-PC23 (columns 1 and 2) and CWR22 (columns 3 and 4) xenografts, the “Semi-Res” (Semi-resistant samples) group includes the Lucap35 (columns 5-7) xenograft, and the “Res” (Resistant samples) group includes the LAPC9 (columns 8-10) and WISH-PC14 (columns 11 and 12) xenografts.
Table 1. Probe sets of the genes in Custer 2 that are up-regulated in IR-resistant xenografts: the probe sets in the table mani-fest > 3 fold change in their expression compared to IR-sensitive samples.
LuCAP35/mean (WISH23, CWR22)
LAPC9/mean (WISH23, CWR22)
WISH14/mean (WISH23, CWR22) Apoptosis gene
213373_s_at caspase 8 CASP8 10.48 8.18 8.03
200706_s_at lipopolysaccharide-induced TNF factor LITAF 8.05 4.80 4.37
200704_at lipopolysaccharide-induced TNF factor LITAF 7.67 4.22 3.63
209310_s_at caspase 4 CASP4 9.58 13.69 13.58
209772_s_at CD24 antigen (small cell lung
carcinoma cluster 4 antigen) CD24 13.06 10.31 10.20
Apoptosis inhibitors gene
218032_at stannin SNN 4.32 4.16 3.58
Prostate cancer related genes
204393_s_at acid phosphatase, prostate ACPP 7.22 10.81 10.33
217729_s_at amino-terminal enhancer of split AES 2.09 3.95 2.99
[image:12.595.59.541.529.736.2]Continued
221882_s_at transmembrane protein 8
(five membrane-spanning domains) TMEM8 5.22 3.57 3.70
207011_s_at PTK7 protein tyrosine kinase 7 PTK7 7.04 11.02 8.62 DNA repair
225245_x_at H2A histone family, member J H2AFJ 119.21 152.88 163.13 224301_x_at H2A histone family, member J H2AFJ 46.24 70.52 71.21
208527_x_at histone 1, H2bk HIST1H2BK 2.76 6.78 6.25
222067_x_at histone 1, H2bd HIST1H2BD 4.25 14.07 13.75
Inhibition of cell growth
201315_x_at interferon induced transmembrane
protein 3 (1-8U) IFITM3 2.11 9.86 17.54
212203_x_at interferon induced transmembrane
protein 3 (1-8U) IFITM3 21.29 25.50 97.98
Angiogenesis factor and prostate cancer related genes
221942_s_at guanylate cyclase 1, soluble, alpha 3 GUCY1A3 15.00 4.92 9.68 Carbohydrate metabolism
209696_at fructose-1,6-bisphosphatase 1 FBP1 14.68 63.72 60.10 Nucleotide metabolism
204187_at guanosine monophosphate reductase GMPR 18.58 11.64 35.51
Regulation of transcription from pol ii promoter
209338_at transcription factor CP2 TFCP2 8.83 6.47 7.51
Cell growth and development
222016_s_at zinc finger protein 323 ZNF323 5.90 11.24 5.50
226473_at chromobox homolog 2 (Pc class
homolog, Drosophila) CBX2 6.18 3.23 4.18
226184_at formin-like 2 FMNL2 3.02 7.57 6.54
225390_s_at Kruppel-like factor 13 KLF13 4.67 7.74 13.52
Others
35147_at MCF.2 cell line derived transforming
sequence-like MCF2L 13.40 12.77 13.50
212935_at MCF.2 cell line derived transforming sequence-like MCF2L 88.19 60.91 84.37
209338_at transcription factor CP2 TFCP2 8.83 6.47 7.51
207627_s_at transcription factor CP2 TFCP2 16.68 8.85 15.53
202286_s_at tumor-associated calcium
signal transducer 2 TACSTD2 3.94 8.89 7.32
217025_s_at drebrin 1 DBN1 2.71 6.07 4.95
226473_at chromobox homolog 2 (Pc class homolog,
Drosophila) CBX2 6.18 3.23 4.18
215177_s_at integrin, alpha 6 ITGA6 118.81 111.52 91.35
203342_at translocase of inner mitochondrial
membrane 17 homolog B TIMM17B 7.28 5.20 6.28
209040_s_at proteasome (prosome, macropain)
subunit, beta type, 8 PSMB8 268.00 187.77 552.91
233955_x_at CXXC finger 5 CXXC5 37.53 26.35 34.26
224516_s_at CXXC finger 5 CXXC5 14.28 9.04 12.03
222996_s_at CXXC finger 5 CXXC5 6.30 5.46 5.59
203335_at phytanoyl-CoA hydroxylase
(Refsum disease) PHYH 11.80 6.82 7.80
203434_s_at membrane metallo-endopeptidase MME 15.11 12.56 16.20
203435_s_at membrane metallo-endopeptidase MME 12.50 5.92 5.43
219103_at development and differentiation
enhancing factor-like 1 DDEFL1 3.84 8.05 10.09
226361_at transmembrane protein 42 TMEM42 15.18 8.55 10.04
235247_at Grainyhead-like 2 (Drosophila) TFCP2L3 6.04 4.77 6.24
208885_at lymphocyte cytosolic protein 1 (L-plastin) LCP1 17.20 4.15 4.82
236565_s_at La ribonucleoprotein domain
family, member 6 LARP6 6.21 4.69 4.43
ESTs
226358_at hypothetical protein LOC145842 LOC145842 5.95 4.47 5.33
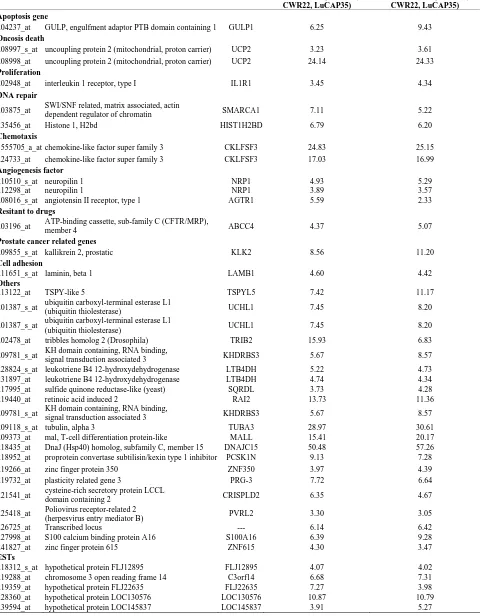
Table 2. Probe sets of the genes in Custer 3 that are up-regulated in IR-resistant xenografts: the probe sets in the table mani-fest > 3 fold change in their expression compared to IR-sensitive samples.
LAPC9/mean (WISH23, CWR22, LuCAP35)
WISH14/mean (WISH23, CWR22, LuCAP35) Apoptosis gene
204237_at GULP, engulfment adaptor PTB domain containing 1 GULP1 6.25 9.43 Oncosis death
208997_s_at uncoupling protein 2 (mitochondrial, proton carrier) UCP2 3.23 3.61 208998_at uncoupling protein 2 (mitochondrial, proton carrier) UCP2 24.14 24.33 Proliferation
202948_at interleukin 1 receptor, type I IL1R1 3.45 4.34
DNA repair
203875_at SWI/SNF related, matrix associated, actin
dependent regulator of chromatin SMARCA1 7.11 5.22
235456_at Histone 1, H2bd HIST1H2BD 6.79 6.20
Chemotaxis
1555705_a_at chemokine-like factor super family 3 CKLFSF3 24.83 25.15 224733_at chemokine-like factor super family 3 CKLFSF3 17.03 16.99 Angiogenesis factor
210510_s_at neuropilin 1 NRP1 4.93 5.29
212298_at neuropilin 1 NRP1 3.89 3.57
208016_s_at angiotensin II receptor, type 1 AGTR1 5.59 2.33
Resitant to drugs
203196_at ATP-binding cassette, sub-family C (CFTR/MRP),
member 4 ABCC4 4.37 5.07
Prostate cancer related genes
209855_s_at kallikrein 2, prostatic KLK2 8.56 11.20
Cell adhesion
211651_s_at laminin, beta 1 LAMB1 4.60 4.42
Others
213122_at TSPY-like 5 TSPYL5 7.42 11.17
201387_s_at ubiquitin carboxyl-terminal esterase L1
(ubiquitin thiolesterase) UCHL1 7.45 8.20
201387_s_at ubiquitin carboxyl-terminal esterase L1
(ubiquitin thiolesterase) UCHL1 7.45 8.20
202478_at tribbles homolog 2 (Drosophila) TRIB2 15.93 6.83
209781_s_at KH domain containing, RNA binding,
signal transduction associated 3 KHDRBS3 5.67 8.57
228824_s_at leukotriene B4 12-hydroxydehydrogenase LTB4DH 5.22 4.73
231897_at leukotriene B4 12-hydroxydehydrogenase LTB4DH 4.74 4.34
217995_at sulfide quinone reductase-like (yeast) SQRDL 3.73 4.28
219440_at retinoic acid induced 2 RAI2 13.73 11.36
209781_s_at KH domain containing, RNA binding,
signal transduction associated 3 KHDRBS3 5.67 8.57
209118_s_at tubulin, alpha 3 TUBA3 28.97 30.61
209373_at mal, T-cell differentiation protein-like MALL 15.41 20.17 218435_at DnaJ (Hsp40) homolog, subfamily C, member 15 DNAJC15 50.48 57.26 218952_at proprotein convertase subtilisin/kexin type 1 inhibitor PCSK1N 9.13 7.28
219266_at zinc finger protein 350 ZNF350 3.97 4.39
219732_at plasticity related gene 3 PRG-3 7.72 6.64
221541_at cysteine-rich secretory protein LCCL
domain containing 2 CRISPLD2 6.35 4.67
225418_at Poliovirus receptor-related 2
(herpesvirus entry mediator B) PVRL2 3.30 3.05
226725_at Transcribed locus --- 6.14 6.42
227998_at S100 calcium binding protein A16 S100A16 6.39 9.28
241827_at zinc finger protein 615 ZNF615 4.30 3.47
ESTs
218312_s_at hypothetical protein FLJ12895 FLJ12895 4.07 4.02
219288_at chromosome 3 open reading frame 14 C3orf14 6.68 7.31
219359_at hypothetical protein FLJ22635 FLJ22635 7.27 3.98
228360_at hypothetical protein LOC130576 LOC130576 10.87 10.79
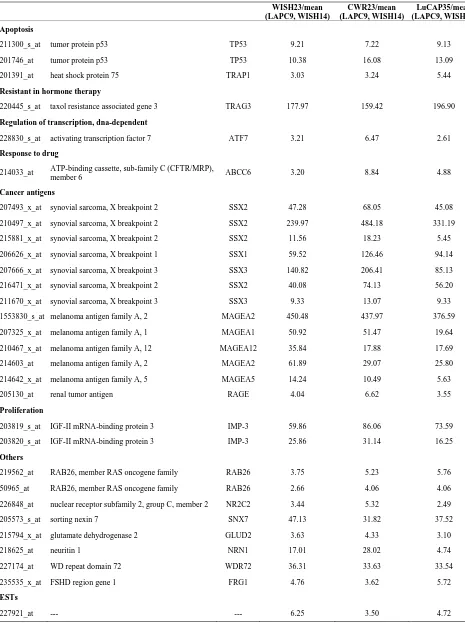
Table 3. Probe sets of the genes in Custer 5 that are up-regulated in IR-sensitive xenografts: the probe sets in the table mani-fest > 3 fold change in their expression compared to IR-resistance samples.
WISH23/mean (LAPC9, WISH14)
CWR23/mean (LAPC9, WISH14)
LuCAP35/mean (LAPC9, WISH14) Apoptosis
211300_s_at tumor protein p53 TP53 9.21 7.22 9.13
201746_at tumor protein p53 TP53 10.38 16.08 13.09
201391_at heat shock protein 75 TRAP1 3.03 3.24 5.44
Resistant in hormone therapy
220445_s_at taxol resistance associated gene 3 TRAG3 177.97 159.42 196.90
Regulation of transcription, dna-dependent
228830_s_at activating transcription factor 7 ATF7 3.21 6.47 2.61
Response to drug
214033_at ATP-binding cassette, sub-family C (CFTR/MRP),
member 6 ABCC6 3.20 8.84 4.88
Cancer antigens
207493_x_at synovial sarcoma, X breakpoint 2 SSX2 47.28 68.05 45.08
210497_x_at synovial sarcoma, X breakpoint 2 SSX2 239.97 484.18 331.19
215881_x_at synovial sarcoma, X breakpoint 2 SSX2 11.56 18.23 5.45
206626_x_at synovial sarcoma, X breakpoint 1 SSX1 59.52 126.46 94.14
207666_x_at synovial sarcoma, X breakpoint 3 SSX3 140.82 206.41 85.13
216471_x_at synovial sarcoma, X breakpoint 2 SSX2 40.08 74.13 56.20
211670_x_at synovial sarcoma, X breakpoint 3 SSX3 9.33 13.07 9.33
1553830_s_at melanoma antigen family A, 2 MAGEA2 450.48 437.97 376.59
207325_x_at melanoma antigen family A, 1 MAGEA1 50.92 51.47 19.64
210467_x_at melanoma antigen family A, 12 MAGEA12 35.84 17.88 17.69
214603_at melanoma antigen family A, 2 MAGEA2 61.89 29.07 25.80
214642_x_at melanoma antigen family A, 5 MAGEA5 14.24 10.49 5.63
205130_at renal tumor antigen RAGE 4.04 6.62 3.55
Proliferation
203819_s_at IGF-II mRNA-binding protein 3 IMP-3 59.86 86.06 73.59
203820_s_at IGF-II mRNA-binding protein 3 IMP-3 25.86 31.14 16.25
Others
219562_at RAB26, member RAS oncogene family RAB26 3.75 5.23 5.76
50965_at RAB26, member RAS oncogene family RAB26 2.66 4.06 4.06
226848_at nuclear receptor subfamily 2, group C, member 2 NR2C2 3.44 5.32 2.49
205573_s_at sorting nexin 7 SNX7 47.13 31.82 37.52
215794_x_at glutamate dehydrogenase 2 GLUD2 3.63 4.33 3.10
218625_at neuritin 1 NRN1 17.01 28.02 4.74
227174_at WD repeat domain 72 WDR72 36.31 33.63 33.54
235535_x_at FSHD region gene 1 FRG1 4.76 3.62 5.72
ESTs
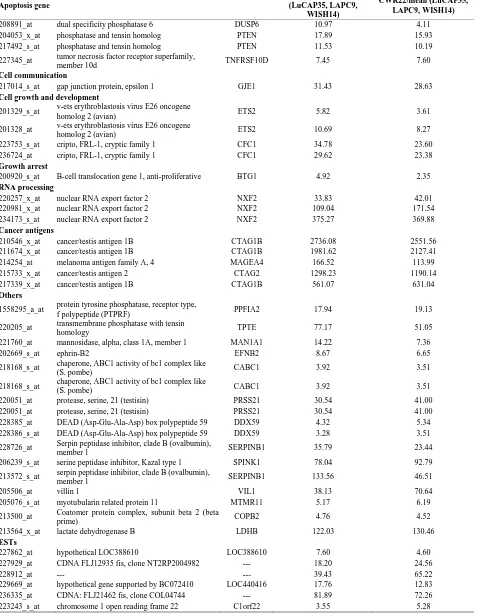
Table 4. Probe sets of the genes in Custer 6 that are up-regulated in IR-sensitive xenografts: the probe sets in the table mani-fest > 3 fold change in their expression compared to IR-resistance samples.
Apoptosis gene
WISH23/mean (LuCAP35, LAPC9,
WISH14)
CWR22/mean (LuCAP35, LAPC9, WISH14)
208891_at dual specificity phosphatase 6 DUSP6 10.97 4.11
204053_x_at phosphatase and tensin homolog PTEN 17.89 15.93
217492_s_at phosphatase and tensin homolog PTEN 11.53 10.19
227345_at tumor necrosis factor receptor superfamily,
member 10d TNFRSF10D 7.45 7.60
Cell communication
217014_s_at gap junction protein, epsilon 1 GJE1 31.43 28.63
Cell growth and development
201329_s_at v-ets erythroblastosis virus E26 oncogene
homolog 2 (avian) ETS2 5.82 3.61
201328_at v-ets erythroblastosis virus E26 oncogene
homolog 2 (avian) ETS2 10.69 8.27
223753_s_at cripto, FRL-1, cryptic family 1 CFC1 34.78 23.60
236724_at cripto, FRL-1, cryptic family 1 CFC1 29.62 23.38
Growth arrest
200920_s_at B-cell translocation gene 1, anti-proliferative BTG1 4.92 2.35 RNA processing
220257_x_at nuclear RNA export factor 2 NXF2 33.83 42.01
220981_x_at nuclear RNA export factor 2 NXF2 109.04 171.54
234173_s_at nuclear RNA export factor 2 NXF2 375.27 369.88
Cancer antigens
210546_x_at cancer/testis antigen 1B CTAG1B 2736.08 2551.56
211674_x_at cancer/testis antigen 1B CTAG1B 1981.62 2127.41
214254_at melanoma antigen family A, 4 MAGEA4 166.52 113.99
215733_x_at cancer/testis antigen 2 CTAG2 1298.23 1190.14
217339_x_at cancer/testis antigen 1B CTAG1B 561.07 631.04
Others
1558295_a_at protein tyrosine phosphatase, receptor type,
f polypeptide (PTPRF) PPFIA2 17.94 19.13
220205_at transmembrane phosphatase with tensin
homology TPTE 77.17 51.05
221760_at mannosidase, alpha, class 1A, member 1 MAN1A1 14.22 7.36
202669_s_at ephrin-B2 EFNB2 8.67 6.65
218168_s_at chaperone, ABC1 activity of bc1 complex like
(S. pombe) CABC1 3.92 3.51
218168_s_at chaperone, ABC1 activity of bc1 complex like
(S. pombe) CABC1 3.92 3.51
220051_at protease, serine, 21 (testisin) PRSS21 30.54 41.00
220051_at protease, serine, 21 (testisin) PRSS21 30.54 41.00
228385_at DEAD (Asp-Glu-Ala-Asp) box polypeptide 59 DDX59 4.32 5.34 228386_s_at DEAD (Asp-Glu-Ala-Asp) box polypeptide 59 DDX59 3.28 3.51
228726_at Serpin peptidase inhibitor, clade B (ovalbumin), member 1 SERPINB1 35.79 23.44
206239_s_at serine peptidase inhibitor, Kazal type 1 SPINK1 78.04 92.79
213572_s_at serpin peptidase inhibitor, clade B (ovalbumin),
member 1 SERPINB1 133.56 46.51
205506_at villin 1 VIL1 38.13 70.64
205076_s_at myotubularin related protein 11 MTMR11 5.17 6.19
213500_at Coatomer protein complex, subunit beta 2 (beta
prime) COPB2 4.76 4.52
213564_x_at lactate dehydrogenase B LDHB 122.03 130.46
ESTs
227862_at hypothetical LOC388610 LOC388610 7.60 4.60
227929_at CDNA FLJ12935 fis, clone NT2RP2004982 --- 18.20 24.56
228912_at --- --- 39.43 65.22