http://dx.doi.org/10.4236/jmp.2013.42032 Published Online February 2013 (http://www.scirp.org/journal/jmp)
On the Usage of the Faraday Effect as an Authentication
Technique for Vegetable Oils
M. I. Abu-Taha*, M. A. Halasa, M. M. Abu-Samreh
Physics Department, College of Science and Technology, Al-Quds University, Jerusalem, Palestine Email: *[email protected]
Received October 3, 2012; revised November 15, 2012; accepted November 29,2012
ABSTRACT
In this study we report on the measurements of the Verdet constant for olive and other vegetable oils. Study of samples stored for different periods at different storage conditions showed that each olive oil sample has a Verdet constant value depending on: production year, history of the sample (i.e. storage conditions) and geographical region. Photo and auto oxidations are found to have reverse effects on the value of the measured Verdet constant, on the one hand, photo-oxi- dation tends to decrease the Verdet constant, but on the other hand auto-oxidation tends to increase it. It is known that oils stored in room light had significantly lower tocopherol, carotenoid, and chlorophyll contents than did the same oils kept in the dark. For other vegetable oil samples, each vegetable oil was found to have a distinct Verdet constant value. Thus it is possible to differentiate vegetable oils making use of their respective Verdet constants. Preliminary results indicated the possibility to detect olive oil adulteration using the Faraday Effect, i.e. the effect could be suggested as a food authentication technique if calibration curves and standard Verdet constants values could be prepared for com-parison with those of samples under investigation.
Keywords: Olive Oil; Oil Content; Oil Adulteration; Photo-Oxidation; Auto-Oxidation; Magneto-Optics; Food Authentication
1. Introduction
Food authentication techniques have been evolving con- tinually to deal with global market demands. Analytical techniques have been developed or modified to give plausible solutions to possible adulteration at each stage of production. Oils and fats constitute one of the three major classes of food products, the others being proteins and carbohydrates. Consumers are demanding food pro- ducts that combine a pleasant flavor with nutritional be- nefits. On the basis of the expanding market for vegeta- ble oils, their authenticity has become an important sub- ject from both a commercial and a health perspective. The difference between the price of olive oil and other edible oils, for example, can mean that large amounts of money can be made by adding cheaper oils to virgin olive oil, i.e. adulteration. This harmful act constitutes a health hazard, and an example, was the toxic oil syn- drome resulting from consumption of olive oil spiked with aniline-denatured rapeseed oil that affected more than 20,000 people [1].
Most of the current work on edible oil adulteration is based on chromatographic analysis. High performance liquid chromatography (HPLC) [2] and high resolution
gas chromatography (HRGC) [3] analysis have been ap- plied to the quantification of fatty acids, triglycerols, ste- rols, tocopherols and hydrocarbons. HPLC has been used increasingly over the last decade and it is still the most widely used technique. However, these seperative tech- niques have been complemented with or substituted by, many other modern techniques, such as supercritical fluid chromatography (SFC) [4], Chiral chromatography, silver ion chromatography, stable carbon isotope ratio analysis (SCIRA) [5,6], mass spectrometry (MS), nuclear magnetic resonance spectrometry (NMR) [7], near-in- frared spectroscopy (NIR) [8], Fourier transform infrared spectroscopy (FT-IR) and FT-Raman spectroscopy [9].
This work attempts to employ Faraday effect as a sampling technique. It is a magneto-optical effect that deals with phenomena arising from the interaction be-tween light and matter that occur in liquids, gases, as well as solids. When light propagates along the axis of a transparent medium of length L, the application of an axial magnetic field B to the medium causes a rotation
of the plane of polarization of the light beam such that [10]:
VBL (1)
Here V is the Verdet constant, which measures the strength of the effect and has different values for differ-
ent materials, and varies with the wavelength of the light used in the study [10]. The Faraday Effect is attri- buted to the symmetry breaking of the propagating left- handed and right-handed circularly polarized light in the presence of the magnetic field, i.e., the index of refrac- tion for light of the two polarizations becomes different in the presence of the field. A simple semi-classical ap- proach that incorporates the essential physics and retains the right order of magnitude for the effect, the Verdet constant can be written as [11,12]:
2
2mc d dn
V K e (2)
where,eis the charge of the electron, m it’s mass, c is the speed of the light, is the wavelength of the light beam, and n is the index of refraction of the medium. The dimensionless constant, K, measures the deviation of the Verdet constant from the value predicted by the simple semi-classical theory.
It is worth mentioning here that the Verdet constant and the wavelength dependence of the index of refraction relationship depend mainly on the nature of the medium, i.e. whether it is semiconducting, diamagnetic, paramag- netic ferromagnetic. Thus, correct calculations can be at- tained by making use of the quantum theory methods.
Accordingly, there are several analytical procedures that have been employed to identify and quantify the components of vegetable oils. In this work we propose the Faraday effect as a new nondestructive technique for testing vegetable oils through measurement of Verdet constant. To our knowledge there is no reported data in the literature on the measured values of Verdet constant for vegetable oils.
2. Experimental
2.1. Set-Up and New Improvements
The basic setup of the Faraday Effect shown in Figure 1 [13] was used with some improvements on the Faraday rotation-angle measurement and the detection scheme.
The normal procedure used [13] for calculating the Verdet constant employs measuring the rotation-angle directly using the circular scale of the analyzer graduated in degrees, and magnetic field value responsible for cer- tain angle of rotation that causes light extinction. This method is totally dependent on the experimenter’s eye sight. Hence, the result is considered a crude measure- ment. An improvement on the experimental technique was found necessary and introduced to improve meas- urement sensitivity. The circular scale giving angle mea- surements in degrees is transferred to a linear micrometer scale. This is an achieved by introducing the new design shown in Figure 2. The corresponding micrometer read- ing can be easily converted into more reliable and accu- rate angle measure.
As far as light extinction is concerned an improvement was added also by which a phase sensitive detection scheme in conjunction with a photocell is used, hence the measurement is carried out electronically avoiding possi- ble error of insensitive human eye. This allows using lock-in amplifiers to detect AC signals, all the way down to a few nanovolts, hence, allowing an exact determina- tion of the rotation angle. It is possible to make accurate measurements even when the small signal is obscured by noise sources many thousands of times larger and differ- entiates against stray light signals. The improved setup is exhibited as a complete experimental setup in Figure 3.
1 4 2
5 3
[image:2.595.311.539.241.325.2]7 6
Figure 1. The basic setup of the conventional Faraday effect experiment: 1. Polarizer, 2. Analyzer, 3. Condenser, 4. Test specimen, 5. Colored glass, 6. Lens, 7. Translucent screen.
Micrometer Spindle
Linear Analyzer Micrometer
[image:2.595.334.512.375.519.2]Spring
Figure 2. Apparatus design with improving on the Fara- day’s rotation-angle measurements.
[image:2.595.310.537.556.710.2]2.2. Samples
Olive oil samples from different geographical parts of Palestine were collected over years ago for the various production years and stored at different storing condition. Some were stored at room light other in the dark, in plas- tic or glass containers; totally or partially filled. Tested oil samples were placed in ordinary glass tube 20 mm long, 5 mm internal diameter, then inserted through the hole drilled in the magnet poles. In addition to the olive oil samples, other different vegetable oil samples were bought for analysis from a local store. Adultered oil sam- ples were prepared by mixing pure oil sample by differ- ent ratios of other oils.
3. Results and Discussion
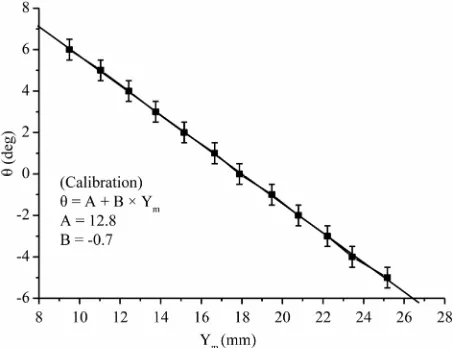
[image:3.595.308.539.490.677.2]A set of improvements on the conventional method al- lowed a sensitive measurement of the rotation angle. For example, parts of angles as small as 0.02 deg could be measured in the present work compared to the smallest measurable angle of 0.5 deg. in the conventional way. This enhanced the sensitivity to a level that minute rota- tion angles by the plane of polarization for vegetable oils could be monitored. The circular angle scale on the ana- lyzer was changed to a linear sensitive easy to measure scale as could be seen in Figure 4.
Figure 5 shows the angle of rotation of the polariza- tion plane as a function of the mean flux density for two olive oil samples taken from the same geographical re- gion and stored in a plastic container in room light and having one year age difference.
[image:3.595.59.285.521.695.2]It is seen that the Verdet constant decreases apprecia- bly from 227 deg/(T·m) for less older sample to 165 deg/ (T·m) for older one. This indicates that the verdet con- stant value becomes less the larger the sample age is. The
Figure 4. Calibration curve between the analyzer rotation angle (θ in deg.) and corresponding micrometer reading (Ym mm).
oils stored in the dark mainly contained primary oxida- tion products while the oils kept in room light contained secondary oxidation products as confirmed by the K270 values which exceeded the legal limits even after purifi- cation by means of alumina [14]. This is because the photo-oxidation takes place faster than the auto-oxidation. It is possible to conclude that the decrease of the Verdet constant in the samples exposed to light is due to the de-crease in the concentration of tocopherol and carotenoid since chlorophylls disappear after 4 months of storage. This is in agreement with the Caponio et al., 2005 [15] results whose results had shown that oils stored in the light had significantly lower tocopherol, carotenoid and chlorophyll contents than did the same oils kept in the dark. On the contrary, the results for the samples taken from the same region but stored in glass containers in the dark have shown constant Verdet’s constant values for at least one year (see Figure 6).
This can be attributed to the interruption of both pho- to-oxidation and auto-oxidation since glass is imperme- able to oxygen. This agrees with the result obtained by Kanavouras and Coutelieris, 2006 [16].
In Figure 7, the effect of storage in filled and unfilled containers was displayed. As it can be seen from the fig- ure, the Verdet constant for samples stored in filled plas- tic container (V = 165 deg/(T·m)) and a partially filled container (V = 123 deg/(T·m)). The degradation in the Verdet constant for the oil in the partially filled container is attributed to the interaction of the oil with air layer on top of the oil in the container.
The results of oil samples taken from another geogra- phical area Mid-southern region of the West-Bank, and stored in plastic container in room light kept with one
Figure 6. Angle of rotation of the polarization plane as a function of the mean flux density for Yatta (south region of the west bank) olive oil, aging 10 and 9 years respectively, from a valley stored in glass container in the dark for = 525 mm.
Figure 7. Angle of rotation of the polarization plane as a function of the mean flux density for Yatta olive oil, aging 11 years, from a mountain, stored in plastic totally filled container (■) and partially filled container (•), for = 525 mm.
year age difference are shown in Figure 8. Their meas- ured values of the Verdet constant decreased with expo- sure to light in a similar fashion the samples taken from the south area shown in Figure 5. Figure 9 shows the angle of rotation of the polarization plane as a function of the mean flux density belonging to the Mid-Southern area olive oil samples stored in glass in the dark with one year age difference. Their results are consistent with those of Figure 6, i.e. the value of the Verdet constant does not change for at least one year.
The results of the investigated samples taken from the
middle region of the west-bank are shown in Figure 10. Such results confirmed the previously reported results in which the value of the Verdet constant increases with storage in a plastic container in the dark.
Figure 11 displayed a set of curves of the investigated samples obtained from northern region of the west-bank. It was found that the value of their Verdet constant de- creased from V = 182 deg/(T·m) for the sample that is that is 3 years younger, i.e. to V = 132 deg/(T·m) for the older sample. This indicates that although glass contain- ers can prevent oil degradation due to degassing they cannot stop photo-oxidation reducing the levels of toco- pherols and carotenoids in room light. The results dis- played in Figure 12 are obtained for different vegetable
Figure 8. Angle of rotation of the polarization plane as a function of the mean flux density for Jerusalem olive oil, aging 11 and 10 years respectively, stored in plastic con- tainer in room light for = 525 mm.
Figure 10. Angle of rotation of the polarization plane as a function of the mean flux density for aboud (middle region of west bank) olive oil, aging 11 and 10 years respectively, stored in plastic container in the dark for = 525 mm.
Figure 11. Angle of rotation of the polarization plane as a function of the mean flux density for Asserah (north region of the west bank) olive oil, aging 10, 9 and 7 years respec- tively, stored in glass container in the light for = 525 mm.
oils whose Verdet constant values are found to range from 345 deg/(T·m) for (Castor oil) to 1289 deg/(T·m) for Almonds oils.
[image:5.595.310.537.83.315.2]Olive oil adulteration was also studied using a recently produced olive oil sample than one year old, stored in a plastic container in room light, [V = 206 deg/(T·m)], was mixed with wheat oil [V = 1198 deg/(T·m)] in different proportions by weight, from 10% - 80%. The results shown in Figure 13 assert an increase of the sample’s Verdet constant of the mixture as the percentage of the wheat oil increased. This is attributed to the high value of the Verdet constant of wheat oil i.e. the proportion of the
Figure 12. Angle of rotation of the polarization plane as a function of the mean flux density for different vegetable oils, for = 525 mm.
Figure 13. Verdet constant for mixed wheat and olive oils versus the fraction of wheat oil in the mixture.
adulterant oil is reflected in the result obtained. The Ver- det constant increases from V = 282 deg/(T·m) for 10% wheat oil by weight to V = 944 deg/(T·m) for 80% wheat oil by weight.
[image:5.595.58.286.337.530.2] [image:5.595.310.538.368.551.2]Verdet constant value against a sample that is been claimed to have similar properties, i.e. of certain geogra- phical area, year of production, and storage conditions.
4. Conclusion
The newly developed method proved its reliability to distinguish different olive oil samples according to their shelf life, geographical area and storage conditions as related to a change in Verdet constant value. Different types of vegetable oils also have different Verdet con- stants, this allows olive oil authentication from adultera-tion by other cheap vegetable oils. The stability of the Verdet constant value is an indication of olive oil proper- ties stability, yet the components of olive oil responsible for the optical activity of the oil needs a more thorough investigation. Both photo- and auto-oxidations have clear effect on the Verdet constant. A further study is needed to determine the relation between the value of the Verdet constant and the primary and secondary oxidation prod- ucts, oil component contents etc.
REFERENCES
[1] I. Abaitua and M. Posada, “Toxic Oil Syndrome: Current Knowledge and Future Perspectives,” Journal of Epide- miol Community Health, Vol. 47, No. 4, 1993, p. 337. [2] W. E. Neff and W. C. Byrdwell, “Soybean Oil Triacylgly-
cerol Analysis by Reversed-Phase High-Performance Li- quid Chromatography Coupled with Atmospheric Pres- sure Chemical Ionization Mass Spectrometry,” Journal of the American Oil Chemists, Society, Vol. 72, No. 10, 1995, pp. 1185-1191.
[3] N. Frega, F. Bocci and G. Lercker, “High Resolution Gas Chromatographic Determination of Alkanols in Oils Ex- tracted from Olives,” Journal of the American Oil Chem- ists’ Society, Vol. 70, No. 9, 1993, pp. 919-921.
[4] M. C. Yuen, M. A. Ngan, H. Yahya, Y. Yamauchy, M. Bounoshita and M. Saito, “Seperation of Crude Palm Oil Components by Semipreparative Supercritical Fluid Chro- matography,” Journal of the American Oil Chemists’ So- ciety, Vol. 73, No. 4, 1996, pp. 523-525.
[5] M. Antolovich, X. Li and K. Robards, “Detection of Adulteration in Australian Orange Juices by Stable Car- bon Isotope Ratio Analysis (SCIRA),” Journal of Agri-
cultural and Food Chemistry,Vol. 49, No. 5, 2001, pp. 2623-2626. doi:10.1021/jf001384f
[6] N. Andrikopoulos, “Chromatographic and Spectroscopic Methods in the Analysis of Triacylglycerol Species and Regiospecific Isomers of Oils and Fats,” Critical Reviews in Food Science and Nutrition, Vol. 42, No. 5, 2001, pp. 473-505.
[7] G. Vigli and A. Philippidis, “Classification of Edible Oils by Employing 31P and 1H NMR Spectroscopy in Combi- nation with Multivariate Statistical Analysis. A Proposal for the Detection of Seed Oil Adulteration in Virgin Olive Oil,” Journal of Agricultural and Food Chemistry,Vol. 51, No. 19, 2003, pp. 5715-5722.
[8] J. C. Barlet, “Identification of Edible Oils and Detection of Oil Adulteration by Differential Infra-Red Spectros- copy,” Nature, Vol. 180, 1957, pp. 1071-1072.
[9] M. D. Guillen and N. Cabo, “Usefulness of the Frequen- cies of Some Fourier Transform Infrared Spectroscopic Bands for Evaluating the Composition of Edible Oil Mix- tures,” Lipid/Fett, Vol. 101, No. 2, 1999, pp. 71-76. [10] F. A. Jenkins and H. E. White, “Fundamentals of Optics,”
McGraw-Hill, New York, 1950.
[11] F. Pedrotti and P. Banditini, “Faraday Rotation in the Undergraduate Advanced Laboratory,” American Journal of Physics,Vol. 58, No. 6, 1990, p. 542.
[12] P. A. Williams, A. H. Rose, G. W. Day, T. E. Milner and M. N. Deeter, “Temperature Dependence of the Verdet Constant in Several Diamagnetic Glasses,” Applied Op- tics, Vol. 30, No. 10, 1991, pp. 1176-1178.
doi:10.1364/AO.30.001176
[13] P. Manual, “University Laboratory Experiments: Phys- ics,” 3rd Edition, Göttingen, 1995.
[14] B. Muik, B. Lendl, A. Molina-Diaz and M. Ayora-Can- ada, “Direct Monitoring of Lipid Oxidation in Edible Oils by Fourier Transform Raman Spectroscopy,” Chemistry and Physics of Lipids, Vol. 134, No. 2, 2005, pp. 173- 182.
[15] F. Caponio, M. T. Bilancia, A. Pasqualone, E. Sikorska and T. Gomes, “Influence of the Exposure to Light on Ex- tra Virgin Olive Oil Quality during Storage,” European Food Research and Technology, Vol. 221, No. 1-2, 2005, pp. 92-98.