1980
industrial health and safety
Human biological monitoring of
industrial chemicals
4. Inorganic lead
0
/
-980
industrial health and safety
Human biological monitoring of
industrial chemicals
4. Inorganic lead
L. ALESSIO and V. FOA
{Ciinica'del Lavoro 'L. Devoto', Milan)
Directorate-General Employment and Social Affairs Health and Safety Directorate
EUR 6982
(l, ICOMMISSION OF THE EUROPEAN COMMUNITIES
Directorate-General Information Market and Innovation
Batiment Jean Monnet LUXEMBOURG
LEGAL NOTICE
Ne1ther the CommiSSIOn of the European Commun1t1es nor any person acting on behalf of the CommiSSIOn IS responsible for the use wh1ch m1ght be made of the
followmg 1nformat1on
Cataloguing data can be found at the end of this publication
©
ECSC-EEC-EAEC, Brussels ., Luxembourg, 1980Printed in Belgium
P R E F A C E
The Counc1l of the European CoiT@Un1ties has adopted 1n 1979 the First Act1on Programme on Safety and Health at Work to be comprehensive at Community level. This AcLion Programme sets out a number of priorities many of whlch emphasize the need to 1ncrease protect1on aga1nst dange-rous substances.
The need to promote new mon1tor1ng and measuring methods for the
assess-ment of 1nd1vidual exposure, 1n part1cular through the appl1cat1on of
sensltive biological 1nd1cators lS stressed.
These monographs are a1med at provid1ng the pract1c1ng occupat1onal doctor with up-to-date information on the poss1b1l1ties and limitations of biolog1cal mon1tor1ng for a number of agents.
The advent of modern micro-analytic techniques, the increased
automa-tizat1on of methods and our better understand1ng of b1ochemical pro-cesses have allowed the development and multiplication of biolog1cal
tests for the early detectlon of 11excessive11 exposure to industrial
chem1cals and hence for preventing occupational diseases.
Human biolog1cal monitoring, 1n the context of these monographs, is the
evaluation of occupational exposure to chemical agents using the exposed
worker h1mself. The analytical determination will be carried out on representat1ve biological mater1als (1ndicator media) of the exposed organ1sm, 1t will e1ther consist of the determ1nation of the toxic agent itself or 1ts metabolites or some early reversible biological effects which are cons1dered useful for the prevent1on of excessive exposure.
Blological monltoring provldes an lndlrect lnslght lnto what happens
inside the body of exposed workers, and some more relevant parameters
for estimatlng the rlsk of health lmpairment, by
taklng into account total exposure (via the resplratory tract, the skln and the gastro-intestlnal tract).
taking into account various host factors affecting pharmacokinetics
and pharmacodynamlcs.
Some biologlcal monitoring tests are best used for lndlvldual screenlng
wh1le some are best su1ted for group exposure conditions.
Biological lndlcators are at present avallable for only a small number of toxic agents and furthermore the procedures for biological monitoring are limited also by the avallability of excreta and readlly accesslble body flulds and tlssues for analysls.
RegardJ_ng these biological materlals emphasls must be placed on the precautions which must be taken ln handllng these materlals before and
dur1ng analys1s. Care must also be taken with the 1nterpretation of
the results, taking lnto account the always possible analytlcal errors, and the biological variabillty from indlvidual to lndivldual. Finally, i t should be kept ln mlnd that excessive exposure does not necessarily mean health lmpairment.
It must be recognlzed that the blological monitoring approach has not yet reached a very advanced stage of development and that conslderable research is still necessary. Thls is reflected by the monographs which are publlshed in this series and which reflect the current state of knowledge in this field taking only into consideration relevant human data.
Dr. P. Recht
TABLE OF CONTENTS
ABBREVIATIONS
1.0 SUMMARY
2.0 INTRODUCTION
2.1 Chemical and Physical Properties 2.2 Effects on Humans
3.0 METABOLISM
4.0 BIOLOGICAL INDICATORS
4.1 Indicators of Internal Lead Dose 4.1.1 Concentrations in blood 4.1.2 Concentrations in urine 4.1.3 Concentrations in faeces 4.1.4 Chelatable lead
4.1.5 Relationship between external lead exposure and indicators of internal dose
4.2 Indicators of Effect in Adult Males
4.2.1 Erythrocyte aelta-aminolevulinic acid dehyaratase
4.2.2 Erthrocyte protoporphyrin
4.2.2.] Erythrocyte protoporphyrin determined with extractive methods
4.2.L.2 Zinc protoporphyrin
4.2.3 Delta-aminolevulinic acid in urine 4.2.4 Coproporphyrin in urine
4.2.5 Haemoglobin and stippled cells 4.3 Indicators of Effect in Adult Females
4.3.1 Erythrocyte delta-aminolevulinic acid dehydratase
4.3.2 Erythrocyte protoporphyrin 4.3.3 Delta-aminolevulinic acid in urine 4.3.4 Urinary coproporphyrin
5.0 CONCLUSIONS
6.0 RESEARCH NEEDS
7.0 REFERENCES
ABBREVIATIONS
1) ALAO 6-aminolevulinic acid dehydratase activity of erythrocytes 2) ALAU 6-aminolevulinic acid in urine
3) CPU Urinary coproporphyrin _ 4) EP Erythrocyte protoporphyrin
5) PbA Atmosrheric lead levels
6) PbB Lead in blood 7) PbU
=
Urinary Leaa8) PbUEDTA
=
Amount of chelatable lead excreted with 24-h urine after administration of CaNa2 EDTA (l g intravenously)1.0 SUMMARY
This document reviews inorganic lead as related to occupational exposure and the possibilities of the biological monitoring of exposure.
The main route of absorption in occupational exposure is the respiratory apparatus. Derangement in heme synthesis is currently considered the first adverse effect associated with increasing concentration of lead in the soft tissues.
A vast number of tests which permit an evaluation of the degree of exposure, body burden, and toxic effect are available for monitoring lead workers.
For periodic monitoring of workers exposed to lead it is recommended that two tests be used simultaneously; one test should be designed to indicate internal dose and another to indicate effect. In general it is adv~sable to use blood lead levels as a measure of internal dose, and erythrocyte protoporphyrin as an indicator of effect.
For screening studies an inexpensive test which is easy to perform, sensitive, specific and precise should be used to identify subjects with high exposure. Both protoporphyrin and delta-aminolevulinic acid dehydratase comply with these requirements.
For assessment on a group analysis basis of the environmental condition of a work place, the urinary tests may be used; blood tests, however, provide more accurate information.
Individual blQod lead levels in male workers should not exceed 60 llg/100 ml, and in women workers of child-bearing age they should not be higher than 40 llg/100 ml because of the potential adverse effect of lead on the foetus.
2.0 INTRODUCTION
2.1 Chemical and physical properties
Lead is a chemical element represented by the symbol Pb and with an atomic number of 82, atomic weight 207.21, specific weight 11.342. Melting point: 327°C; boiling point: about l740°C. Starting from temperatures of 550-600°C, there is considerable production of vapours which combine with oxygen in the air to form lead oxide. Lead is found in the natural state in mineral deposits. The most common and most widely used mineral for extraction is galena (PbS). The lead content in directly mined mineral varies from 3 to 10%.
2.2 Effects on Humans
Derangement in heme synthesis is currently considered the first adverse effect (critical effect) associated with increasing concentration of lead in the soft tissues; in fact, lead can inhibit some enzymatic activities of heme biosynthesis (Chisolm, 1971; De Bruin, 1971; Baloh, 1974; Waldron and Stoefen, 1974). See Figure l (Chisolm, 1971).
The inhibition by lead of ALAD and heme synthetase, which are enzymes containing SH groups, is well documented. Due to ALAD inhibition, an accumulation of ALA occurs in the serum and consequently in the urine; inhibition of heme synthetase (iron chelatase) produces an accumulation of protoporphyrin IX in the erythrocytes. An increase in urinary coproporphyrins is an indirect evidence of coprogenase inhibition by lead.
The combination of decreased delta-aminolevulinic acid dehydratase activity in red blood cells, increased urinary delta-aminolevulinic acid, increased urinary coproporphyrin, and increased erythrocyte protoporphyrin is pathognomonic for lead, distinguishing it from all other disorders of pyrrole metabolism in man (Chisolm, 1975).
3. 0 MET llBOLISM
ln working environments the main route absorption is the respiratory apparatus. It IS generally consiaerea that 3~-~0% of the lead that reaches the lower respiratory tTact i:, absorbea into the blooo stream.
The potential increase in the body burden ot lead can be expresseo as: BB
=
L X V x R x 0 x 10-3where BB=potential increase in body burden in mg; L=air lead concentration in mg/m3; \!=pulmonary ventilation in m3 /day; R=fraction of inhaled lead retained; D=auration of exposure in oays. R values vary accoroing to the solubility and particle size of inuividual lead compounds.
The uptake of leaa by the gastro-intestinal tract is less complete than by the lung. Not more than 5-10% ot Ingesteo lead is generally absorbed, the balance being excreted in the feces.
A potential gastro-intestinal absorption in inoustry should not be underestimated. Both because it can increase oue to particular personal habits, e.g. smoking, eating in the work-place and because as much as 40% of inhaled lead of large dlameter trapped In the upper respiratory tract may be swallowed (Kehoe, 1961; Knelson et al., 1~7.5; hamilton ana Hardy, 1974; Waldron and Stoefen, 1974).
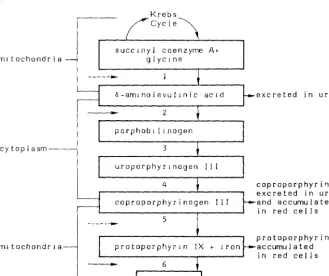
Figure 1
Biosynthesis of heme is inhibited by lead, resulting in accumulation of intermediates in the synthetic pathway. Lead inr1ibits two steps (solid arrows) and may inhibit two others (broken arrows).
Krebs
~-~~
C y c l e \ succ1nyl coenzyme Atm1 tochondr i a glyc1ne 1 6-am1nolevul1nic
2
porphob 1 li nogen cytoplasm 3
uroporphyr1nogen
4
5
m1 tochondr 1 a protoporphyrin
-
6heme
excreted in urine
coproporphyri11 excreted in urine and accumulated in red cells
[image:13.437.49.379.136.412.2]Figure 2 (Baloh, 1974) gives a schematic representation of the dynamic interchange of the body lead pool. Blood is the major factor in determining the steady state distribution of lead in body tissues. There is a dynamic equilibrium between red cell lead and plasma lead on the one hand and between extracellular lead and intracellular lead on the other. It is likely to be the ionic fraction of the plasma lead which is transferred to the other body compartments. The equilibrium constants of the reactions probably rank in the following order: K4 > K3 > K2 > K1 . However, since a state of equilibrium is rarely reached,
the rate constants Kf also become important. The rate constants indicate the speed with which the state of equilibrium can be reached in any given reaction.
The rate constants in Figure 2 are probably in the reverse order of the equilibrium constants, i.e. , K fl > K f2 > K f3 > K f4, indicating that the bone
takes more time to reach its final lead concentration than erythrocytes or proteins (Baloh, 1974; Waldron and Stoefen, 1974).
Figure 2
The dynamic interchange of the body lead pool
hard tissue (dense bone, soft tissue (brain, ha i r , teet h , e t c o ) bone marrow, e t c o )
kidney,
bound lead ' - " - - ; ; ; ; ; : lead
K:f~
~f;'J
urinary, sweat and gastrointestinal - - - , . e x c r e t i o n respiratory and diffusible
gastrointestinal input intake
-plasma ' lead
output
erythrocyte plasma protein bound lead bound lead
'
\ IJ
\ I
4.0 BIOLOGICAL INDICATORS
4.1 Indicators of Internal Lead Dose
Dose should, ideally, be defined as "the amount or concentration of a given chemical at the site of its action", i.e., where its presence leads to a given effect. Since the determination of this amount is often impossible in practice, the dose may have to be estimated by various means and in most cases one can speak only in terms of these dosage estimates. Metal concentration in biological media can often be used as indicators (or indices) of exposure and of concentration in the critical organ (Nordberg, 1976).
Below are considered the biological tests which may be used as indicators of an internal lead uose.
4.1.1 Concentrations in blood
The level of lead in blood (PbB) is a function of the quantity of lead absorbed from the environment minus the lead deposited in the bone cortex and soft tissues and the lead excreted with urine and feces (Waldron, 1971). PbB is about 2% of the total lead burden. Approximately 90% of blood lead is bound to erythrocytes and is not readily diffusible; plasma lead (0.2% of the total Durden) is made up of two fractions: the plasma protein bound fraction and the diffusible fraction, the latter being probably the metabolically active center of the body lead pool (Baloh, 1974). See Figure 2. Diffusible plasma lead probably gives the best approximation of the biologically effective lead burden, although at present it is not possible to measure it. It should be noted, however, that the plasmatic fraction of lead is not a constant function of the total blood lead concentration and therefore cannot be predicted by PbB (Waldron, 1974). However, for groups of subjects, PbB is probably a reasonable indication of plasmatic levels (Zielhuis, l975a).
Interpretation of blood lead levels must take into account the fact that they reflect only one point in time, and a dose which is steady, increasing or decreasing (Nordberg, 1976). However, although these levels allow a satisfactory evaluation of current exposure, they are not necessarily always correlated with the lead body burden. In fact, after cessation of exposure, PbS may reach "normal" values while a body burden persists. This is demonstrated by a high urinary lead excretion after chelating therapy (Prerovska and Teisinger, 1970), or when disorders of heme synthesis are still evident (Selander and Cramer, 1970; Alessio et al. ,l976c). On the other hand, cases are known in literature of adults and children who showed clinical symptoms of intoxication but who had relatively low PbS values (Beritic, 1971; Moncrieff et al., 1964). This apparent "paradox" could be due to the fact that measurement occurred some time after cessation of exposure
(Kehoe, 1972) .
Studies on volunteers who received different quantities of lead also showed that the PbS levels reach a given ceiling even when the body lead burden increases continuously during exposure (Kehoe, 1961). This was also observed in occupational exposure (Benson et al., 1976).
Factors exist which can influence PbS levels independently of exposure and body burden. For example, blood lead levels are greatly affected by the red blood cell mass (anemia, polycythaemia). There has been much discussion of whether these levels should be corrected according to the haematocrit values, but there is disagreement on the biological validity of such correction (Lauwerys, 1975).
flameless methods or the "Delves Cup" give similar results but it should be noted that the "Delves Cup" tends to overestimate the values.
4.1.2 Concentrations in urine
The kidney is presumed to excrete lead by two routes: glomerular filtration and transtubular flow or excretion (Vostal and Heller, 1968)
The relative importance of the two routes is uncertain, but the formation of lead containing inclusion bodies suggests that in subjects with heavy lead exposure, transtubular flow may assume a greater importance (Cramer et al., 1974).
Since the analysis of lead in urine (PbU) does not require blood withdrawal, it is sometimes preferred to PbS determination (Lauwerys, 1975). The "normal" PbU concentration in adults usually oscillates between 10 and 80~g/l, lower than 50~g/g creatinine (Salah, 1974; Lauwerys, 1975). In subjects under continuous exposure, a satisfactory correlation was found between atmospheric lead levels and PbU and between PbS and PbU (Williams et al. , 1969). In the case of new lead exposure there is also a good correlation between PbS and PbU, but while PbS increases without any demonstrable time lag, the increase in PbU requires a latency period of about 2 weeks (Tala et al., 1973).
Many factors other than lead absorption such as fluid intake and speci fie gravity of the urine may influence the excretion of lead (Ellis, 1966). Patients with chronic nephritis frequently have PbU levels within "normal" limits in spite of the existence of high lead stores (Lilis et al., 1968). Prerovska and Teisinger (1970) have demonstrated that subjects with heavy lead exposure in the past can have normal urinary lead excretion even when excretion of chelatable lead remains high.
4.1.3 Concentration in feces
The levels of lead in feces of "normal" subjects varies between 240 and 400llgl24h (Kehoe, 1961; Barry, 1975). Our ing occupational exposure the values increase to 760-3800llg/24h, according to the data of Saita and Moree (1958).
Measurement of lead in feces can be used to determine absorption by ingestion (accidental or intentional). Fecal lead excretion above 4mg/l00g, 4 weeks after occupational exposure has ceased, is a sure indication of ingestion ( Zielhuis, 1972). The analysis is valid only when perfor~ed during the period of ingestion or in the days immediately following (Vigliani and Debernardi, 1934).
4.1.4 Chelatable lead
Chelatable lead is strictly dependent on the active deposit of the metal in the soft tissues of the body, including the trabecular bone (Teisinger et al., 1969), and as a result it provides a more direct measurement of the rapid exchange pool.
Chelatable lead can be measured by injections of CaNa2 EDTA or by penicillamine per os. The levels of PbU EDTA (mean + 2 SO) in 26 inhabitants of Milan who were not occupationally exposed to lead, were 630llg/24h (Alessio et al., l976a).
Limited data on humans strongly suggest that the CaNa2 EDTA mobilization test may be a better indication of the concentration of lead in affected organs of man
(Nordberg, 1976).
Since CaNa
2 EDTA is capable of binding only with extracellular lead, (Teisinger et al., 1958; Castellino e Aloj, 1965), it is likely that measurement of metal in urine after administration of this drug permits an indirect, though rough, evaluation of tre levels of diffusible lead.
After administration of CaNa
In studies on children and adolescents (Chisolm et al., 1976), a statistically significant linear relationship was found between blood lead concentration and the logarithm of the quantity of lead excreted in the 24-hour period immediately following administration of CaNa
2 EDTA. In our laboratory, studies in progress have shown that a good correlation exists between PbB and PbU EDTA 1n adult subjects with current occupational exposure to lead. In subjects with past occupational exposure, the correlation between the two parameters is definitely lower, although still statistically significant. Analysis of the regression curves shows that for corresponding values of chelatable lead, subjects with past exposure have lower blood lead levels than currently exposed subjects. The slopes of the regression lines are statistically different (Figure 3).
Chelatable lead cannot be used in epidemiological studies because it necessitates administering a druy and also because 24-hour urine samples are difficult to obtain.
The induced urinary lead test is capable of detecting and evaluating the existence of lead absorption which occurred in the past. It can therefore be used to determine whether former acute manifestations or current chronic manifestations are attributable to lead intoxication, even when the other indicators of internal dose have returned to normal (Saita, 1962; Prerovska and Teisinger, 1970).
Teisinger (1971) maintains that in subjects with past exposure, a urinary lead excretion above lmg/24h after administration of CaNa2 EOTA (2g i.v.) is indicative of a potentially dangerous body burden of the metal; for subjects still exposed, however, the author sets this critical level at 2mg/24h.
4.1.5 Relationship between external lead exposure and indicators of internal dose
Many studies have demonstrated the existence of a correlation between PbB, PbU and the atmospheric lead levels in the working environment (PbA).
The relationship between PbA atmospheric lead levels are low 1976). See Figure 4. Williams et and PbB (r=0.90) and between
and PbB has a similar profile both when the and when levels of 0 .2mg/m3 are reached (Harada,
Relationship between chelatc;ble le;:,d (H='J COTA) and PbB irr male subjects with current (a) and past exposure (b) to l~Jd.
120
100
E so
0
Q
g
60al
.0
a_
a)
I
.. ·.
nAB
1000 2000
· /
/"·"
,
b)
PbU- EOTA ~q/24 h
Figure 4
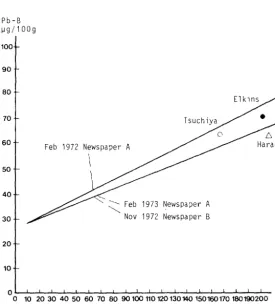
Relationships between lead concentration in air and lead concentration in blood of lead workers. The curves are those obtained from a study of the PbA/PbB relationship in newspaper industries (Harada, 1976), extended to plot also the values of Elkins (1959), Harada et al. (1960) and Tsuchiya and Harashima (1965).
Pb-B ~g/100g
100
90
80
70
60
50
40
30
20
10
Feb 1972 Newspaper A
\
1973 Newspaper A 1972 Newspaper B
QL-~~~~~~~~L-~~-L-L~~--L-~~-L~~-
oroww~~ooroooooumm~~~~m~m~
Table 1
Mean values and 95% confidence limits of single determinations of lead in blood and urine which correspond to two
lead-in-air concentrations.
0.20 Mean
95% C.L.
0.15 Mean
95% C.L.
PbB ( ~g/100 ml)
70 48-92
60
38-82
PbU
( ~g/1)
143 56-230
118
the 95% confidence limits of single determinations of PbB and PbU which correspond to 0.2 and O.l5mg;m3 lead in air. The wide range of the confidence limits is evident from these data.
On the basis of Williams' data, Zielhuis and Verberk (1974) examined the validity of various PbB and PbU levels as indicators of "unacceptable" exposure; they assumed PbA=0.12mg/m3 to be the "acceptable" level. See Table 2. In this sample, for the cut-offs considered, PbB levels have a higher validity than PbU levels as indicators of unacceptable exposure. PbB > 40 has maximum sensitivity (no false negatives: all individuals with PbA > 0.12 have PbB > 40); however, specificity is moderate (also PbB > 40 in subjects with PbA < 0.12: 44% of false positives). PbB > 80 is highly specific (no individual with PbA < 0.12 has PbB
> 80, i.e., no false positives); but sensitivity is moderate (46% false negatives). On the basis of these results, Zielhuis and Verberk (1974) conclude: "If one wants to be certain that all subjects with PbA > 0.12 are selected out of a universe of exposed workers, PbB > 40 will serve this objective, however, at the cost of a number of false positives. If, on the other hand, one wants to select only individuals with PbA > 0.12, then PbB > 80 will serve this objective, however with many false negatives."
The number of subjects in whom validity has been studied is limited (about 30 cases) but it is likely that even with a larger number of subjects the validity values will be similar since air sampling involves many limitations; i.e.:
effect of particle size and solubility of particle;
representation of only a small fraction of total volume of air inhaled;
ingestion remains unmeasured;
effect of contamination and position of sampling head;
effect of the entry of particulates into sampling heads;
Table 2
Validity of different PbB and PbU levels for predicting an unacceptable lead exposure (PbAir
PbB >40 ~g/100 ml >60
>80
PbU > 60 ~g/1 >120
>160
Se
=
sensitivity Sp=
specificity Sp + Se=
ValiditySe Sp
1.00 0.66
0.72 0.80
0.56 1.00
0.88 0.53
0.56 0.95
0.12 0.95
0 .l2mg/m3)
validity
1.66 1.52 1.56
At the 2nd International Workshop on Permissible Limits for Occupational Exposure to Lead (Zielhuis, 1977), the conclusion was reached that a "standard" for lead in air based upon the relationship between PbB and PbA could not be established. Such a standard, it was felt, would best be based on PbB alone.
To conclude this section, it seems appropriate to make the following points:
a) Lead in the blood and lead in the urine are indicators of exposure since the levels of these parameters are closely influenced by the environmental concentration of lead.
b) Chelatable lead may be considered a "true" indicator of dose, the levels of which reflect the active lead deposit.
c) In currently exposed subjects the indicators of exposure permit prediction of the quantity of chelated lead.
d) In subjects no longer exposed the indicators of exposure do not permit a reliable evaluation to be made of chelatable lead.
4.2 Indicators of Effects in Adult Males
Biological tests which may be used as indicators of a biological leaa effect are separated according to sex since in recent years it has been shown that some indicators of effect behave differently in males and females.
4.2.1 Erythrocyte delta-aminolevulinic acid dehydratase (ALAD)
The ALAD activity of circulating erythrocytes is highly sensitive to inhibition by leaa; inhibition of ALAD il"1 red blood cells (RBC 's) parallels inhibition in other tissues, e.g., liver (Secchi et al., 1974).
below 40~g/l00nl (Hernberg et al., 1970 Haeger-Aronsen et al., 1971; Zielhuis, 15172; Lauwerys et al., 1974). There is suggestive evidence that the no-effect level is about lO~g PbB/lOOml (Granick et al., 1973).
Up to 15174, studies on the relationship between ALAD and PbS have generally used the method of Bonsignore et al. (1965) or methods derived from this for the determination of ALAD. At present the European stanoardized method (Berlin and Schaller, 1974) is widely used. Determination of ALAD using the method of Bonsignore is of little use in monitoring occupationally exposed subjects (Alessio et al., l517bb). See Figure 5. In fact, when PbS increases beyond 40~g/l00ml, the enzymatic activity is reduced to a level too low to allow identification of different blooo leao levels (oe Bruin, 1968; Basecqz et al., 1971; Hernberg et al, 197<:; Sec chi and Alessio, 1974). However, ALAD can have a wider application in monitoring leao workers when it is measured with the CEC method, since a marked inh1bition of the enzymatic levels occurs only when PbB values exceed
50-60~g/l00ml. See Figure 5.
Valiaity of ALAD is rathEor moaerate for PbB levels lower than 40~g/l00ml which therefore 1mplies a very high percentage of false classifications. Thus when subjects with only environmental lead exposure are studied according to Ziehluis (1974), "it is not possible to base a biological quality guide on individual ALAD levels". Validity of ALAD does, however, improve markedly for higher PbS levels. For example, the validity of ALAD (measured with the CEC method) is good at a PbS cut-off of 60~g/l00ml. At this PbS level, at a cut-off of 15~/RSC the enzyme displays a sensitivity of 0.96 (i.e. 4% false negatives) and a specificity of 0.85 (i.e., 15% false positives). These data indicate that ALAD may be used as a screening test for occupationally exposed subjects (Table 3).
u
co
0::
'E
----:::> E
0
<t:
_ j
<t:
40
30
20
Corre latlUn l:.,etween PtJB ana ALA[) determined rJy twCJ different methods in
auul t r:;ales c ,,rrentl y expusea to leao
CEC
METHOD
•
lower normal l1m1tof ALAD (mean - 2 SO)
- - - n~146 r~0.834
BONSIGNORE - - - - n~169 r~0.871
~1ETHOD \
\
\
\ \
\
'
'
10 "
20 40
'
',,
60
...
PbB ~g/100 ml
--
Table 3
Validity of ALAD for Predicting Different PbB Levels. Analysis made on
108 adult males currently exposed to lead
PbB ALAD
~9/lOOml mU/ml RBC Se Sp Validity
~ 40 :;: 20 0.71 0.80 1.51
~ 60 :;: 15 0.96 0.85 1.81
~ 70 :;: 10 0.94 0.92 1.86
However, other studies (Vergnano et al., 1969; Sakurai et al., 1974) indicate to the contrary, that in cases of severe past exposure, ALAD remains inhibited out of proportion to the current PbB. It has been conjectured that 1n th1s situation
enzymatic inhibition is oue to an inhibitor other than lead, probably of a thermolabile proteic nature (Vergnano et al., 1969).
The significance of erythrocyte ALAD inhibition due to lead 1n regard to health is still open to discussion ( Zielhuis, 197 5a). As regards ALAD inhibition for the range of PbB up to 40ug/l00ml ''its bioloqic8l significance is dubious because it is unaccompanied by any detectable effects on the biochemical function of man" (NAS, 1972). According to Nordberg (1976), an inhibition ot ALAD in the cells of the bone marrow is a subcritical effect which precedes an increased level of delta-aminolevulinic acid in blood and urine and the occurrence of anemia (critical effects). A decrease in ALAD activity in blood is an example of an 1ndicator of subcritical effect of lead exposure.
Until recently, it was not clear whetr1er the inhibition of peripheral erythrocyte ALAD by lead was a phenomenon which really occurred in vivo, or a pnenomenon which only occurred in vitro, i.e. a result of membrane-bound lead getting access to the intracellular enzyme as a result of haemolysis in the test tube required for determining ALAO activity. Roels et al. (l974a) have shown that the decrease in the erythrocyte enzyme is a true reflection of the enzyme activity in yivo when PbB is l?Oug/lOOml. ALAD inhibition is highly specific for increased leaa absorption: e.g. no reduction of ALAD activity has been observed in workers occupationally exposed to cadmium and mercury (Lauwerys et al., 1974; Lauwerys and Buchet, 1973). A transitory inhibition of ALAD occurs after acute ingestion of high quantities of alcohol, and returns to normal with the normalization of blood alcohol (Moore et al., 1971). In chronic alcoholism high PbB values may be found, but ALAD appears more depressed than might be expected from blood lead levels, and these levels remain low for a number of days after suspension of alcohol consumption (Krasner et al., 1974: Secchi and Alessio, l974a).
In lead-exposed subjects, false negative results of ALAD may be obtained when hyper-regenerative erythropoietic disorders exist, e.g. bleeding anaemia, haemolytic anaemia (Bonsignore et al., 1970; Battistini et al., 1971).
intercomparison programme sponsored by the CEC in 1974 was 10% (Berlin et al., 1974).
In the view of Berlin and Schaller (1974), the routine use of ALAD is limited by technical problems, particularly the conservation of the blood sample at 0°C for a limited time interval. In our experience, when the sample is stored at 4°C, no loss of enzyme occurs after 24 hours . See Table 4.
Table 4
Erythrocyte ALAD activity (m U/ml) before and after storage at 4°C
samples before storage after storage 24 hours 48 hours
1 38.0 37.6 33.0
2 21.4 20.8 17.2
3 19.8 19.9 16.2
4 16.0 16.0 13.0
5 9.8 9.7 9.0
4.2.2 Erythrocyte Protoporphyrin IX
The methods of erythrocyte protoporphyrin determination are numerous. Some permit selective measurement of different porphyrins (Schwatz and Wikoff, 1952; Sassa et al., 1973), others measure the total concentration of erytrocyte porphyrins
(Piomelli et al., 1973). All these methods use extractive techniques.
The discovery that erythrocyte protoporhyrin that rises following an abnormal lead absorption (or following sideropenia) is not "free" but bound to zinc, revolutionized the determination methods. In fact, zinc protoporphirin can be determineD on capillary blood diluted with water or alcohol by direct fluorimetric reading (Lamola, 1974). Since 1976 instruments have been developed hematofluorimeters - for the immediate determination of zinc protoporphyrin on undiluted blood (Blumberg et al., 1977).
Henceforth, protoporphyrin determined with extractive methods will be shown as EP and zinc protoporphyrin as ZPP.
For greater clarity, EP and ZPP are dealt with separately.
4.2.2.1 Erythrocyte protoporphyrin determined with extractive methods
EP measurement has made considerable advances in paediatrics as a result of studies carried out using microanalytical methods ( Kammholz et al. , 1972; Sass a et al. , 1973; Piomelli et al., 1973; Chisolm et al., 1974). This test had not been used for monitoring occupationally exposed subjects until recently. A highly significant correlation was found between EP and PbB in adult males under stable lead exposure. In this situation EP is also closely correlated with urinary lead and chelatable lead (Roels et al., 1975; Tomokuni et al., 1975; Alessio et al., 1976a).
In adult males the increase in EP in the 40 to 80~g/l00ml blood lead range appears very marked, so that the difference between "normal" subjects, subjects with "permissible" and subjects with "not permissible" absorption appears more distinct than that which can be revealed by blood lead. (Fig. 6) It should be pointed out that at PbB levels which do not cause an elevation in EP, a reduction in ALAO levels is already in operation. On the other hand, the dose-response relationship calculation has shown that in adult males there is a no-response PbB level for an increase in EP of 25-35~g/l00ml (Roels et al., 1975; Zielhuis, l975a). The no-response PbB level for ALAD appeared to be l5-20~g/lOOml
(Zielhuis, l975a).
Moreover, EP permits a fairly accurate prediction of the amount of chelatable lead (Alessio et al., l976a). This seems particularly interesting since it is very likely that, as an indicator of biologically effective internal dose, chelatable lead is more relevant than lead in blood.
EP can be reliably used as a screening test for monitoring occupationally exposed groups since it has good predictive validity in the 40-70~g/l00ml range for PbB and in the 500-2000~g/24h range for PbU EDTA. See Table 5, Alessio et al. (1976a).
For example, at a blood lead level of 60~g/100ml, EP at a cut-off of 75~g/l00ml
correctly classified 97% of positive subjects and 99% of negative subjects. Thus only 3% false negatives and l% false positives were obtained.
Moreover, EP was found to correlate with other indicators of effect, suggesting that it could be used to predict both the internal lead load and the modifications of the other indicators of effect (Tomokuni, 1975; Alessio et al., 1976b).
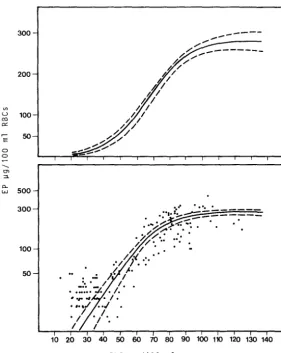
Figure 6
Relationship between PbB and EP, in 201 adult males currently exposed to lead - r
0.94.
Upper frame: linear scale on ordinate. Lower frame: logarithmic scale on ordinate. EP determined according to the Schwartz and Wikoff Method.
300
200
Vl
u 100
ro oc
'E
500 0
----
rn ::::!.0..
w 500
300
100
50
---
---. ---.---.---.
.
..
.
10 20 30 40 50 60 70 80 90 100 110 120 130 140
Table 5
A) Validity of EP for predicting different PbB levels. Analysis made on 201 adult males currently exppsed to lead.
B)
PbB EP Se Sp Validity
( ~g/lOOml) (~g/lOOml RBC)
~ 40 >/ 50 0.83 0.98 1.81
~ 60 ~ 75 0.97 0.99 1.96
>-- 70 ~ 100 0.98 0.90 1.88
Validity of EP for predicting different PbU EDTA levels. Analysis made on 92 adult males currently exposed to lead.
PbU-EDTA EP Se Sp Validity
( ~g/24ore) (~g/lOOml RBC)
>--500 ~50 0.84 1.00 1.84
~ 1000 ~ 75 0.92 1.00 1.92
~ 1500 ~ 100 0.96 0.97 1.93
~ 2000 ~ 150 0.93 0.83 1.78
Figure 7
Relationships between EP and PbB (upper frame) and EP and PbU-EDTA (lower frame) in adult males with past lead exposure.
Scatter diagram: individual date of past-exposed subjects. Logarithmic scale on ordinate.
EP determined according to the Schwartz and Wikoff method.
E 0 0 0... w Vl 400 300 200 100 50
I
I
...
...
:·:
,..,.
...--·
/ / . / ~~...
,..
/..
I ..
I.
. 1 - - p a s t exposure n=67 r=0.51
.
"/I."
---current exposure n=201 r=0.94 I
0~---.---.---.---.----~----~----0 20 40 60 80 100 120
PbB ~g/100ml
400 300
~ 200
0:: E 0 0 0... w 100 .Y ;I"
50 .""//" I
· I
I ..
·.
- - p a s t exposure n=67 r=0.76---current exposure n=92 r=O. 89
o~---r---~---r---~---r--o
1000 2000 3000 4000 5000Normalization of EP after cessation of exposure is slower than that of PbB, ALAU and CP. In fact, in erythrocytes of subjects who have been exposed to lead there is a surplus of EP which persists until the red blood cells are destroyed (Albahary, 1972). However, in severely exposed subjects, EP stays at high levels even for many years after cessation of exposure (Saita eta~., 1954; Gajdos, 1957; Rubino et al., 1958). Alessio et al. (1976c) recently demonstrated that the correlation existing between EP and PbB is decidedly lower in male subjects no longer exposed to lead than in currently exposed subjects, and that for the same PbB values, the EP levels are markedly higher in subjects who are no longer exposed.
EP and chelatable lead are closely correlated both in currently exposed subjects and in subjects with past exposure, and the regression curve in both groups takes on an almost identical profile. See Figure 7, Alessio et al., (l976c). These data seem to indicate that EP remains at high levels for a long period of time due to a direct inhibition of heme synthetase by the lead released from the deposits.
The erythrocyte metabolite can therefore be used to detect the existence of past exposure and to determine whether a patient who has had past exposure should resume work with lead.
EP levels as high as those occurring in severe lead poisoning might be found i,n erythropoietic protoporphyria, a rare congenital disorder, and in thalassemia major. Moderate increases have been found in cases of iron deficiency, serious
liver diseases, and tumours (Baloh, 1974; Saita et al., 1966).
4.2.2.2 Zinc protoporphyrin
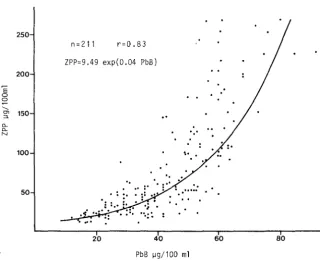
Determination of zinc protoporphyrin with portable hematofluorimeters is a very practical test which is easier to perform and lower in cost than the extractive methods.
11gllOO ml, ZPP undergoes only a moderate increase, but subsequently the increase is very marked (Schaller and Schiele, 1977; Alessio et al., 1978) (Fig<.8).
Without cases having PbB levels above 90 11 g/ml i t is not possible to check whether the regression curve takes on the asymptotic slope observed for EP determined with the Schwartz and Wikoff method.
Research in progress in our laboratory has shown a high predictive validity of ZPP and PbB levels ~ 60 11gllOO ml: using a cut-off of ZPP ~ 80 11 g/l00 ml validity was 1.77, with very hinh sensitivity (0.98), signifying 2% false negatives. The test may therefore ue used to advantage in screening studies of occupational exposed subjects. Such studies are facilitated by the fact that the instrument is portable, gives immediate results and allows a large number of subjects to be examined in a short time.·
It should however be noted that this test has been in routine use for a short time only so that certain features must be studied more closely.
As the hematofluorimeter takes account of the absorption spectrum of oxyhemoglobin, the ZPP levels determined on capillary blood are decidely higher than those determined on venous blood; whereas they are identical to those determined on venous blood after oxygenation (Alessio et al., 1978).
A close correlation exists between ZPP and EP; but it should be noted that while Alessio et al., (1978) found that EP levels, determined according the Piomelli method, were higher than ZPP levels, Blumberg et al.,(l977) found that ZPP levels were higher than EP levels, and Schaller and Schiele ( 1977) found that ZPP levels were practically identical to erythrozyte protoporphyrin levels. A tentative explanation of the discrepancy in results might be the use of a different standard, the analytical values of erythrozyte protoporphyrin are lower (about 50%) than those obtained using a protoporphyrin standard.
It should moreover be noted that the research in progress in our laboratory has
'E
0 0 --.._
"'
:::l_
0.. 0.. N
[image:39.419.43.364.147.408.2]Figure 8
Relationship between PbB and ZPP in 211 adult males currently exposed to lead. ZPP determined with an ESA 4000 apparatus.
250
n =211 r=0.83
ZPP=9.49 exp(0.04 PbB) 200
150
100
..
50
..
20 40 60 80
Figure 9
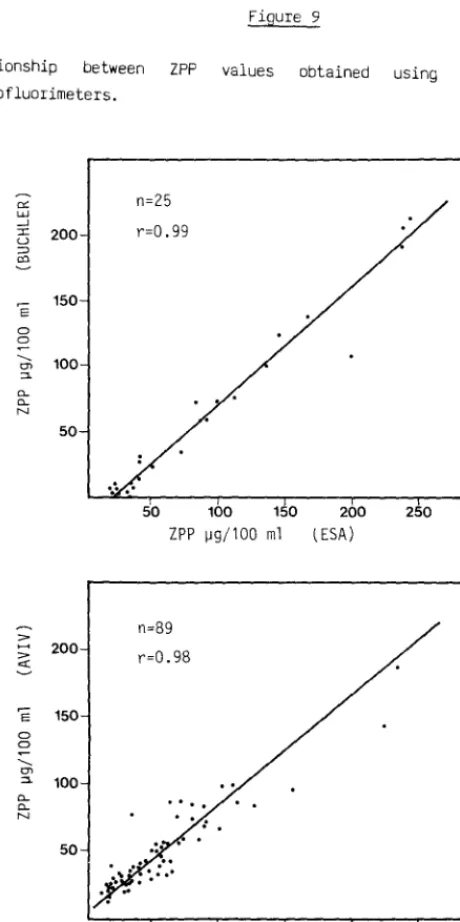
Relationship between ZPP values obtained using different makes of hematofluorimeters.
""
w_ ] :::c 200
u
:=> co
'E 150
0 0 ..._ 100 tJ) ::::1. "-N 50 ::>
... 200
::>
c:(
'E 150
0 0
..._
tJ)
::::1. 100
"-N 50 n=25 r=0.99
50 100 150 ZPP 1J9/100 ml
n=89
r=0.98
....
50 100 150 200 (ESA)
200 ZPP 1J9/100 ml (ESA)
250
Figure 10
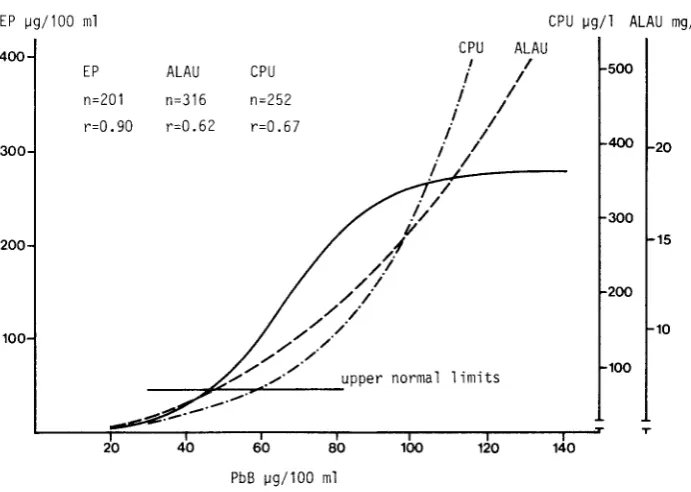
Relationship between PbB and indicators of effect in adult males currently exposed to lead.
EP ~g/100 ml CPU ~g/1 ALAU mg/1
CPU ALAU
400 I I
500
EP ALAU CPU i I
n=252
i
In=201 n=316
i
I Ir=0.90 r=0.62 r=O. 67
i
Ii
I 400 20300
/
I/
· /
//
300v
15200
/.f
/ /
/ I
/ /
200/
.
/ / 10
/ / 100
. / /
/ /
100
/ /
normal 1 imits . / , / · upper
T
20 40 60 80 100 120 140
PbB ~g/100 ml
EP oetermined according to the Schwartz and Wikoff method. ALAU determined
according to Grisler and Gri ffini method CPU determined according to Grisler
[image:41.413.43.389.162.408.2]Figure 11
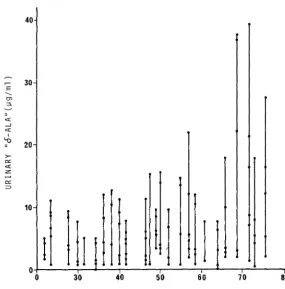
Range of ALA concentrations in individual urine samples passed by the same children in a single 24 hour period. Data are shown for 25 children with blood lead concentrations ranging between 23 and 75 \lg PbS. Each vertical bar represents data from a single child and each solid circle on the bar represents the concentration of ALA ( \lg/ml) found in separate specimens from that child during a single 24 hour period. The wide range of concentration of ALA in single voidings of urine is apparent.
40
~ 30
E
---
en:::>.
"'
__,"'
1"0
20
>-0::
"'
z:0::
:::>
10
I
I
0
0 30 40 50 60 70 80
[image:42.423.59.344.217.506.2]It is to be hoped that hematofluorimeter manufacturers carry out a joint study as soon as possible to standardize the calibration of the instrument, so that ZPP values may be read1ly co1npared in all laboratories.
4.2.5 uelta-amlnolevulinic acid in urine
Uue to tne inhibition of the ALAD of the maturing R8C's by lead, the transformation of MLA into prophobilinogen is obstructed, resulting in an increase in ALA in the serum ana in the unne. On the subject of behaviour of ALA in the serum, a few studies of children with acute encephalopathy are available. However, at present 1 t aoes not apf.Jear that the test can be used routinely, since detection of only mooerately increased levels of ALA requires more than lOml of plasma (Chisolm, 101/5).
Many stuoies are, however, available on ALAU. Researchers have found a goad correlatwn between the urinary metabolite, PbS and PbU (Williams et al. , 1969; Selander and Cramer, 1970; Haeger-Aronsen, 1971; Soliman et al., 1972; Lauwerys et al., 1974). The coefficient of correlation between PbS and ALAU is usually between lJ .5 and 0. 7, ana therefore is not as close as the correlation which generally ex1sts between PbB and the blood tests (ALAD and erythrocyte protoporphyrin). A
s1~ru f1cant 1ncrease in ALAU can be seen at PbS levels slightly higher than those at which tnere is an increase in erythrocyte protoporphyrin values. See Figure 10, luessw et al. (l976b). This phenomenon is clearly seen from examination of the aose-response relationship. In fact, the approximate no-response PbS level for ALAU is )5-4>~g/llJUml, while for FEP it is 25-35~g/100ml (Roels et al., 1975; 21elhU1S1 1975b).
Increase. (This phenomenon has not yet been verified for ZPP). Therefore, urinary tests may have an important application when metabolic damage such as that which car1 occur in leao intoxication must be evaluated (Alessio et al., l976b).
Like the validity of CPU, the valioity of ALAU for predicting PD8 appears to be DIStinctly lower than that of erythrocyte protoporphyrin.
To preuict a Potl level >; 60 ~g/lUU ml using a cut-off of ALAU >; 10 mg/1, validity was 1.67, with sensitivity= 0.75, and specificity= 0.52; the number of
false negatives IS therefore very high (25%) (Alessio et al., 1976b).
In recently exposed subjects, there is a latency period of about two weeks before tne urinary metabolite increases (Tola et al., 1973; Benson et al., 1976).
A tter cessation of lead exposure, the excretion of ALA in the unne becomes "normal" relatively quickly. This parameter is therefore not suitable for detecting past lead exposure (Haeger-Aronsen et al., 1974).
For Ure uetermination of ALAU, as for all the other urinary tests, it is difficult to obtain L4-nour urine samples or urine samples for precise periods of time, e.g. 'l-b hours. Generally the determination is therefore per formed on spot samples. Uwwg tu the different density of daily samples, widely varying levels of the rnetaoollte e.g. from "normal" to "pathologic" can be obtained from tile same subject. For an example, see Fi1,1ure 11, Chisolm et al. (1~76). To overcome this dltf1culty, tile sample is currently corrected according to its specific gravity or creatinine. This correction will probably be useful in studies on groups of subJects, out w s1ngle subjects i t does not permit approximation of the value obtained with respect to the ALA present in 24-hour urine samples (whether expressed In mg/1 or mg/24h).
Various chromatographic and non-chromatographic methods are available for the determination ot ALAU. A critical evaluation of some of these techniques has been maue by koels et al. (l~?4b).
4.L.4 Coproporphyrin In Urine
ln subjects under continuous exposure, there is a good correlation between PbB and CPU ( •1illlams et al. , 1969; Soliman, 1972; Alessio et al. , 1976b).
An excretion of coproporphyrins in the urine (mainly isomer III) beyond the upper normal limits occurs when the PbB levels are slightly higher then those at which an InLrease in ALAU values occurs. See Figure 10. This phenomenon is also evident in the examination of the dose-response relationship between the two urinary n11otaboll tes and Pbt:J ( Wada, 1976).
Frrnn commencement of exposure to increase in CPU there IS a time lag of about 2 weeks In recently exposed subjects (Tala et al., 1973a; Benson et al., 1976). With cessation of exposure, the urinary coproporphyrins return to normal within a few weeKs and sometimes within a few days (Saita, 1962).
unnary coproporphyrin is not a specific test of lead exposure. Increases in the unnary metabolite may occur also in porphyria cutanea taroa, cirrhosis, liver disease, natomolytic anaemia, malignant blood diseases, infectious diseases, and also after consumption of alcohol. However, subjects with severe lead exposure may In some rare cases show normal levels of coproporphyrin in the urine (Saita et al., 1~66; Lauwerys, 1975).
Tne same limitations given for ALAU apply for this test as well.
Other porphyrins are not as common in urine, although increased uroporphyrin levels may occasionally oe detected, especially in severe cases of lead poisoning (Stankovic et al., 1973).
4 . ..::.5 Hae111oglobin anu stippled cells
These two tests are only marginally important for the routine monitoring of lead exposure. Haemoglobin and PbB are generally poorly correlated; a reduction in Hb occurs when the Pt:Jb level exceeds 100-llO~[,J/lOOml (Williams, 1966; Cooper et a1., 10173).
ln the past, stippled cell count was "an early indicator of abnormal lead absorption", since the appearance of stippled cells precedes the onset of anaemia (Sarta, 1962). This test is not used tOday because it does not accurately reflect the amount of lead absorbed and because the number of stippled cells increases with a much greater time lag than the other biological changes aiscussed above (Lauwerys, 1975). Furthermore, the test is not speci fie for lead intoxication srnce stippled cells may be present in thalassemia, pernicious anaemia and anaemia uue to renal insuffrciency (Saita, 1962).
4.3 lr1cJ1cators of Effects rn Adult Females
because of its relatively recent rnterest, the number of studies of female exposures rs rather limited. They generally involve a small sample of subjects with a moaerate degree of exposure.
4.5.1 Erythrocyte delta-aminolevulinic acrd dehydrase (ALADJ
~tudres maae on groups of subjects not occupationally exposed have shown that adult females living in the same place and of the same age as a group of male controls had a hrgher mean value of erythrocyte ALAD activity and a lower mean value of lead in blood (Haeger-Aronsen et al., 1971; Secchi et al., 1973).
smoking. Tala (1973), who examined 171 women and 1199 men with PbS levels between
'J ana :>Uug/ lllUml, found no consistent differences between the ALAD values of men ana women at the same blood levels. Similar results have been obtained in a study of 'J) women ana 'J5 men with Pbb levels ranging from 8 to 80 ug/lOOml (Alessio et
al. , l'} 77). From these data It therefore appears that there are no differences b~tween males ana females with the same level of internal lead load.
4.3.2 Erythrocyte protoporphyrin
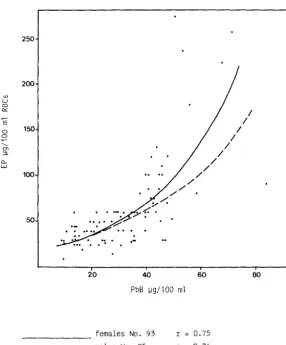
Stuik (b74) has shown that increase in EP occurs in aault females at a lower concentration of PbB than in adult males (for females at a PbS level of 25-35ug/llJUml; for males at 35-45ug/100ml), and that the increase in EP was steeper in females with the increase in PbS values.
~P was observed to behave similarly by Roels et al. (1975) in 40 male and 24 female
aaults with macerate occupational exposure (PbS 5llug/l00ml). EP and PbS were closely correlatea in the two groups; EP was markedly higher in the women at the same internal lead dose, i.e. PbB. Tnis phenomenon can also be clearly observed in the groups considered in a stuay by Alessio et al. ( 1977), see Figure 12, which cor1Sisteu of suojects witn more severe exposure. Similar results are obtained when erythrocyte protoporphyrin is determined with hematofluorimeters, like ZPP.
Stuoy of the oose-response relationship does however show that the no-response PbS levels for an increase in EP are 25-35ug/l0Dml for males and 20-30 ug/ lOOml for females (Roels et al., 1975).
In women, EP IS also well correlated with chelatable lead (PbU EDTA). The regresswn curve between the erythrocyte metabolite and PbU EDTA, shows that for the same level of internal dose, EP is higher in females than in males, even when the internal dose is measured by chelatable lead (Alessio and Foa, 1976).
Vl u co
""
'E 0 0 ---t1l "-0.. wFigure 12
Relationship between PbB and EP in adult males and females.
250
200
150
100
50
/'-:-
.-20 40
y / .
/ / / / / 60 PbB !Jg/100 ml
- - - females No. 93 males No. 95
r
=
0.75r
=
0.74/
/
/
Scatter diagram shows the single females values.
I
I
I I
80
[image:48.426.57.344.146.491.2]4.3.3 Uelta-aminolevulinic acid in urine (ALAU)
ln occupatwnally exposed women, ALJ.\U ana PbB are well correlated. Levels of the urinary metabolite in the women seem slightly higher than in men, at the same PbB level (Koels et al., 197~).
:otuay of the dose-response relationship shows that the no-response levels for an Increase 1n ALJ.\U are 35-45~g/l00rnl for males and 3ll-40~g/l00ml for females (Roels et al., 1975). It does not, however, appear that there is a significant Difference tor ALAU values in non-occupationally exposed subjects in the two sexes.
4.3.4 Urinary Coproporphyrin
Kesults by Alessio et al. (1977) show that CPU and PbB are significantly correlateo. The relationship between the two parameters does not seem to indicate the existence of a difference in behaviour of the urinary metabolite in the two sexes.
From tne available data on aoult women, the following conclusions can be drawn: In aoult women a significant correlation exists between the indicators of internal lead aose ana inaicators of effect, as has already been confirmed
w adult men.
the relationship between indicators of dose ana indicators of effect, evaluated with the regression curve and/or the dose-response curve, shows tnat In the female, the "qualitative" behav10ur of the indicators of effect is identical to that observed in males. In males the erythrocyte ALAU unoergoes a distinct inhibition in the range of PbB values below 4U~g/100ml. The erythrocyte protoporphyrin initially increases rather
There is a clear difference in the "quantitative" behaviour of protoporphyrln (and perhaps of AL~U) in the two sexes at identical levels of internal dose. This phenomenon appears to be due to a greater susceptioility of haemopolesis to lead in women. The cause of such nypersensitivity might be a relative iron aeficiency in women, causing increased alterations in haemopoiesis induced by lead (~tuik, 1974; Lielhuis, 1975a). Synergic action between sex hormones and lead on the enzymatic activity of heme synthesis has also been suggested (koels et
5.0 CONCLUSIONS
A vast number of tests which permit a sufficiently accurate evaluation of the degree of exposure, oody buraen and toxic effect are available for monitoring lead workers. G1ven the advantages ana limitations of each test, the choice of indicator or lndicators w111 depend on the type of investigation.
Two tests should be used s1multaneously for the periodic surveillance of workers exposed to lead concentrations sufficient to cause alterations in biological wmcators close to the "permisslble" llmits. One test should be designed to wdlcate 1nternal aose and another to indicate effect. In mom taring individuals, olood tests are preferable to urinary tests, the latter being subject to cons1derab1e variation due to differences in urine density. Furthermore, elevation beyond tne "normal" limt values of tne urinary indicators of effect, (i.e. delta-am1nolevulinic acid and coproporphyrin), occurs at internal dose levels h1gner than those at which an alteration occurs in the blood indicators of effect, (l.e. delta-aminolevulinic acid dehydrase activity of erythrocytes (ALAD) and erytnrocyte protoporphyrin).
In general, i t is adv1sable to use blood lead levels and erythrocyte protoporphrin for per1odic mon1torin~ as these two tests integrate well. This is not only because one evaluates internal dose and the other the effect but also because blood lead evaluates a momentary situation (present exposure) while the erythrocyte metabolite permits evaluatwn of body our den and past exposure. These features are important in relation to the fact that industrial levels of exposure are rarely stable, so tnat PbtJ alone m1ght give only partial information in cases of non-steady-state exposure. On the other hand, protoporphyrin does not permit assessment of current aosorptwn.
predictive validity of the "true situation", i.e. internal lead load measured with Poi:J.
Protopor~hyr1n offers the follow1ng advantages over ALAD: a) it also permits
quantification of situations in which an internal lead load has already caused a markea inh1bition of ALAD; b) i t can be measured using capillary blood w1th m1cromethous which are rapid to perform. The fluorimetric zinc protoporphyrin technique a[Jpears to offer a simple, instant ana repeatable measurement; c) a n1gher numoer of analyses can be performed in the course of the day; d) the sample for analys1s can be stored for longer periods of time.
The ur1nary tests may be used for assessment of the environmental conditions of a place of work on a g1oup basis, although olood tests previae more accurate 1nformation. If urinary tests are used, it will be appropriate to take the aensity of the Sctmples into account, reJectiny tnose with density lower than lCJlO, or w1th creat1n1ne concentration below 0.5 g/1.
For a correct evaluauon ot a group investigation, i t will not be sufficient to express the oata solely as a mean (i) and stanaard deviation (a) or range. This procedure can be applied only if the parameter follows a Gaussian distribution, and it w1ll be appropr1ate to consiaer the percentage distribution of the aata as well (Zielhuis, 1974).
The choice of b1ological tests must also be made on tne basis of the availability of suitaole equipment and trained technical staff, the possibility of easy and rctpld performance, transport and cost.
The problem of "permissible" levels of owlogical tests for workers exposed to 1norganic lead has been considered by many authors and by national and 1nternationaL bodies responsible for the protection of workers health, and has been a1scussed at numerous meetings of experts.
~t the workshop the following recommended guidelines for PbB based on health
en tena were or awn up: "for male workers inoi vidual PbB 's should not exceed 60~g/ lUUml 1n the lighc of present knowledge available to this group. It is
however desirable to reduce individual exposure below this level, taking into account the effects on tne haematopoietic system at concentrations above 4:>-50~g/ luuml ana on nerve conduction velocity at concentrations between
:>0-6u~g/ lUUml. The group could not agree on what level should be regarded as a
health based permissible level for occupational exposure. So far as female workers of c11ild-bearing age are concerned the r lsk of harm to the foetus at above mentioneo Pol:l levels is not supported by factual evidence but is based on theoretical possibility. Nevertheless, because of potential effects on tne foetus, a safe practice woulo oe to avoid the employment of women of child-bearing age on lead work where blood levels miijht regularly exceed 4U~g/l00ml."
ln 197b, s1m1lar recommer1dations were also made in the U.S.A. by the National lnstltute tor OcCUIJational Safety and Health (NIOSH, 15178), and by the Italian soc1ety of Occupational Medicine and Industrial Hygiene (Foa et al., 1978).
The to11ow1ng 1s a summary of the main recommendations made in the Italian document whlch contains many practical suggestions.
For evaluation of r1sK for individual workers, the following tests are proposed as being the most suitable:
lead in blood and urinary ALA, to evaluate respectively dose and effect relative to current exposure;
erytnrocyte protoporphyrin to quantify an effect due also to past exposure.
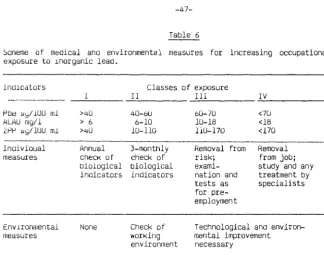
-lst class: -..::no class:
-5ro and 4th classes:
no action surveillance
increasingly important action:
the need for action depends on consideration of the fact that subjects with values of the indicators persistently at tnese levels coulo oevelop a pathological condition.
lnoicatlons for the exposure of male subjects to lead are given more schematically ln Table 6.