Bioremediation of hexavalent chromium using
gram-negative bacteria.
ISMAEL, Mariam Mohamed.
Available from Sheffield Hallam University Research Archive (SHURA) at:
http://shura.shu.ac.uk/19859/
This document is the author deposited version. You are advised to consult the
publisher's version if you wish to cite from it.
Published version
ISMAEL, Mariam Mohamed. (2014). Bioremediation of hexavalent chromium using
gram-negative bacteria. Doctoral, Sheffield Hallam University (United Kingdom)..
Copyright and re-use policy
Sheffield Hallam University Learning and Information .'-'eivices
Adsetts Centre, City Campus Sheffield SI 1WO
ProQuest Number: 10697165
All rights reserved
INFORMATION TO ALL USERS
The quality of this reproduction is dependent upon the quality of the copy submitted.
In the unlikely event that the author did not send a com plete manuscript and there are missing pages, these will be noted. Also, if material had to be removed,
a note will indicate the deletion.
uest
ProQuest 10697165
Published by ProQuest LLC(2017). Copyright of the Dissertation is held by the Author.
All rights reserved.
This work is protected against unauthorized copying under Title 17, United States C ode Microform Edition © ProQuest LLC.
ProQuest LLC.
789 East Eisenhower Parkway P.O. Box 1346
BIOREMEDIATION OF HEXAVALENT CHROMIUM
USING GRAM-NEGATIVE BACTERIA
BY
MARIAM MOHAMED ISMAEL
THESIS SUBMITTED IN PARTIAL FULFILLMENT OF THE
REQUIREMENTS OF
SHEFFIELD HALLAM UNIVERSITY
FOR THE DEGREE OF DOCTOR OF PHILOSOPHY
ABSTRACT
Hexavalent chromium (Cr (VI)), the most toxic form of chromium, is widely used in industrial processes. As a result substantial amounts of Cr (VI) contaminated wastes are produced. The use of microbial cells as bioremediation of heavy metals is a potential alternative to conventional chemical methods.
In this work, laboratory- scale experiments were performed to investigate Cr (VI) removal using five environmental Gram-negative bacterial strains, three of which were nosocomial strains. The potential of live and autoclaved bacterial strains was investigated to mitigate Cr (VI) from its initial concentration of 2.54 mg/1. The autoclaved bacteria were used to determine whether Cr (VI) removal was dependent upon metabolism of the cells or a simple chemical reaction. The results showed notable reduction in Cr (VI) concentration (up to 87% and 23% using live and autoclaved bacteria, respectively).
Proteus mirabilis and Methylococcus capsulatus (Bath) bacterial strains were selected for further detailed analyses to investigate the enzyme system that is responsible for Cr (VI) reduction. To locate the cell compartment in which Cr (VI) removal took place in P. mirabilis, a standard bacterial cell fractionation method was used. The highest Cr (VI) removal activity resided in the cytoplasm, and there was also some activity in the cell membrane. No chromium VI removal was observed in the cell wall fraction.
The removal by M. capsulatus of Cr (VI) in high copper sulfate media was more rapid than in low copper sulfate media. Phenylacetylene, an inhibitor of soluble methane monooxygenase, completely inhibited Cr (VI) removal. The results reveals that pMMO, sMMO or other enzymes that induced by copper were involved in reducing or otherwise removing Cr (VI). The di-heme cytochrome c peroxidase is also a possible candidate enzyme of reducing chromium (VI), since it is known to be present in the periplasm and to play a role in reducing peroxides generated by oxidative metabolism.
observed in FTIR spectra of P. mirabilis and M. capsulatus (Bath) with potassium dichromate. These changes were consistent with the adsorption of chromium.
BLAST searches using known chromate (VI) reducing enzymes from other bacteria showed a presence of four significant potential chromate reductase genes in the genome sequence of P. mirabilis.
During the growth of M. capsulatus (Bath), it was noticed that a contaminant bacterium appeared in some cell cultures. The contaminant bacterium was identified as Bacillus licheniformis (100%) using PCR and 16S rRNA sequencing. The mixed culture that contains M. capsulatus (Bath) plus Bacillus licheniformis was also tested for Cr (VI) mitigation.
ACKNOWLDGEMENT
All praise due to Allah, the most Gracious and Merciful, for giving me the strength, health and determination to complete my study.
I would like to express my deepest gratitude, honour and sincere appreciation to my director of study Professor Thomas Smith for his invaluable guidance, encouragement, constructive suggestions throughout the whole research endeavour.
My heartfelt appreciation goes to Dr Philip Gardiner for his help and motivation in his role as my second supervisor.
My special appreciation is also extended to the microbiology research group for their inspiration and constructive comments on my work during our meetings.
I would like to thank all staff, technicians and colleagues at BMRC for their advice, friendship and support.
DEDICATION
TABLE OF CONTENTS
A B STR A C T...i
A CKN O W LED G M ENT...iii
D ED IC A TIO N ...iv
TABLE OF C O N TEN TS... v
LIST OF FIG U R ES...xii
LIST OF TABLES...xvii
ABBREVIATIONS...xix
CH APTER 1: GENERAL INTRODUCTION AND LITERATURE R EV IEW 1 1.1 Introduction... 2
1.2 Chromium...2
1.2.1 Chromium chemistry... 3
1.2.2 Industrial uses of chromium...4
1.2.3 Health issues...7
1.2.4 Traditional methods for chromium remediation...9
1.3 Environmental bacteria... 11
1.3.1 Bacterial cell structure... 11
1.3.2 Methanotrophic bacteria...12
1.3.2.1 Classification of methanotrophs... 14
1.3.2.2 Methanotrophs and the bioremediation process...14
1.3.2.3 Enzymology of methanotrophs... 16
1.3.2.3.2 Soluble methane monooxygenase... 17
1.4 Bioremediation of chromium... 19
1.4.1 Types of microorganisms capable of hexavalent chromium bioremediation.... 20
1.4.2 Mechanisms of bacterial chromium reduction...23
1.5 Aims and objectives of the study... 24
1.6 Outline of the thesis...26
CHAPTER 2: MATERIALS AND METHODS...27
2.1 M aterials...28
2.1.1 Chem icals...28
2.1.2 M edia... 28
2.1.2.1 Nutrient broth no.2 m edium ...28
2.1.2.2 M9 medium...29
2.1.2.3 NMS m edium ... 30
2.1.3 Bacterial strains...30
2.1.3.1 Cultivation and maintenance of bacterial strains... 31
2.1.3.2 Bacterial strain purity check...32
2.1.4 Equipment...32
2.2 M ethods...33
2.2.1 Chromium (VI) standard curves using diphenylcarbazide (DPC) assay 33 2.2.1.1 Preparation of potassium dichromate stock solution... 33
2.2.2 Standard curves for Cr (VI) concentration in M9, NMS, nutrient broth no.2 media, and lysozyme and tris-HCl solutions...34
2.2.2.2 Chromate assay...35
2.2.3 Laboratory-scale bioremediation reactions...36
2.2.4 Measurement of Cr (VI) concentration removal using diphenylcarbazide (DPC) assay...39
2.2.5 Measurement of total chromium concentration using inductively coupled plasma-optical emission spectrometry (ICP-OES) 39 2.2.5.1 Calibration of ICP-OES... 41
2.2.6 Identification of chromium species using inductively coupled plasma mass spectrometry (ICP-MS)... 42
2.2.6.1 Determination of Cr (III) and Cr (VI) using IC-ICP-MS... 43
2.2.7 Fourier transform infrared spectroscopy (FTIR)... 45
2.2.7.1 Sample preparation for FTIR experiment...46
CHAPTER 3: INTERACTION OF CHROMIUM (VI)
WITH GRAM-NEGATIVE BACTERIA... 48
3.1 Introduction...49
3.2 Bacterial growth during the laboratory scale bioremediation process... 50
3.3 Chromium assay using DPC and ICP-OES... 50
3.4 Use of sodium azide as inhibitor during Cr (VI) removal reaction... 51
3.5 R esults...52
3.5.1 Bacterial grow th... 52
3.5.2 Bioremediation of Cr (VI) using employed bacterial strains... 55
3.5.2.1 Bioremediation of Cr (VI) using live bacterial strains...55
3.5.2.2 Bioremediation of Cr (VI) using autoclaved bacterial cells...72
3.5.2.2.1 Measurement of Cr (VI) concentration using DPC assay 72 3.5.2.2.2 Measurement of total chromium using ICP-OES...78
3.5.3 Comparative assessment of Cr (VI) removal using the bacterial strains studied...84
3.6 Summary...8 8
CHAPTER 4: DETAILED ANALYSIS OF CHROMIUM (VI)
INTERACTION WITH
PROTEUS MIRABILIS
... 90
4.1 Introduction...91
4.2 M ethods...92
4.2.1 Identification of Proteus mirabilis using 16srRNA specific PCR and gene sequencing... 92
4.2.1.1 DNA Extraction protocol...92
4.2.1.2 Polymerase chain reaction...93
4.2.1.3 Agarose gel electrophoresis...93
4.2.1.4 Purification of PCR products... 94
4.2.2 Cell fractionation...95
4.2.3 Analysis of chromium species during the bioremediation process... 96
4.2.3.1 Determination of Cr (III) and Cr (VI) using ICP-MS...96
4.2.3.2 FTIR analysis... 96
4.2.4 Bioremediation of Cr (VI) using P. mirabilis HI4320 bacterial strain...97
4.3 R esults...97
4.3.1 Confirmation of the bacterial isolate as P. mirabilis...97
4.3.3 Analysis of chromium species... 99
4.3.3.1 Determination of Cr (III) and Cr (VI) using ICP-MS...99
4.3.3.2 FTIR analysis...104
4.3.4 Removal of Cr (VI) using P. mirabilis HI4320 bacterial strain...110
4.3.5 Bioinfo nnatics study of putative chromate reductase in P. mirabilis ATCC 29906T genome...111
4.4 Summary... 117
CHAPTER 5: DETAILED ANALYSIS OF CHROM IUM (VI) INTERACTION W ITH METHYLOCOCCUS CAPSULATUS (BATH)...119
5.1 Introduction... 120
5.2 Materials and methods... 122
5.2.1 Confirmation of M. capsulatus (Bath) using PCR 16srRNA sequences... 122
5.2.1.1 Agarose gel electrophoresis protocol... 122
5.2.1.2 Purification of PCR products... 123
5.2.2 Bioremediation of Cr (VI) using M. capsulatus (Bath) bacteria...123
5.2.2.1 High and low copper sulfate NMS m edia... 123
5.2.2.2 Use of phenylacetylene as inhibitor during Cr (VI) removal...123
5.2.3 Determination of chromium species during the bioremediation process 124 5.2.3.1 Determination of Cr (III) and Cr (VI) using ICP-MS... 124
5.2.3.2 FTIR analysis... 124
5.2.5 Bioremediation of Cr (VI) using mixed culture
containing M. capsulatus (Bath) and B. licheniformis... 125
5.3 R esults...125
5.3.1 Confirmation o fM capsulatus (Bath) using PCR 16s rRNA sequences 125 5.3.2 Bioremediation of Cr (VI) using M. capsulatus (Bath)... 126
5.3.2.1 High and low copper sulfate media... 126
5.3.2.2 Use of phenylacetylene as inhibitor during Cr (VI) removal...130
5.3.3 Analysis of chromium species...131
5.3.3.1 Determination of Cr (III) and Cr (VI) using ICP-MS... 131
5.3.3.2 FTIR analysis... 135
5.3.4 Identification of contaminant bacteria using PCR 16s rRNA sequences 140 5.3.5 Bioremediation of Cr (VI) using mixed culture containing M. capsulatus (Bath) and B. licheniformis... 141
5.3.5.1 Comparative assessment between pure M. capsulatus (Bath) and mixed culture in Cr (VI) rem oval...142
5.3.6 Bioinformatics study of putative chromate reductase in M. capsulatus (Bath) genom e... 144
5.4 Summary...144
CHAPTER 6: CONCLUSIONS AND FUTURE WORK...146
6.1 Conclusions... 147
6.2 Future work... 153
APPENDICES...184
APPENDIX A: STANDARD CURVES...185
LIST OF FIGURES
Figure 1.1: Chromium circulation in the polluted environment...6
Figure 1.2: Cell structure of Gram-positive and Gram-negative bacteria... 11
Figure 1.3: Global methane cycle... 13
Figure 1.4: Pathways for methane oxidation and assimilation of formaldehyde...15
Figure 1.5: pMMO crystal structure showing the proposed association of the enzyme with the lipid bilayers of the membrane... 17
Figure 1.6: sMMO crystal structure...18
Figure 1.7: Model of sMMO complex from Methylococcus capsulatus (Bath)... 19
Figure 1.8: Mechanisms of chromate transport, toxicity and resistance in bacterial cells... 23
Figure 2.1: Standard curve for Cr (VI) concentration using DPC assay...34
Figure 2.2: Standard curve of Cr (VI) for several media...36
Figure 2.3: Schematic diagram of the bioremediation experiment and sampling procedure... 38
Figure 2.4: Schematic diagram of ICP-O ES...40
Figure 2.5: ICP-OES (Activa Horib Jobin Yvon Genco, France)... 41
Figure 2.6: Typical calibration curve of standard Cr concentration using ICP-OES 42 Figure 2.7: Schematic diagram of ICP-M S... 43
Figure 2.8: Trivalent chromium chromatogram using ICP-MS as a detector...44
Figure 2.9: Hexavalent chromium chromatogram using ICP-MS as a detector...44
Figure 2.10: Fourier Transform infrared spectroscopy (FTIR) spotlight 300...45
Figure 2.11: Light path in FTIR spectroscopy...46
Figure 3.2: Measurement of Cr (VI) concentration in Ps. aeruginosa
bacterial strain (with and without sodium azide) using DPC assay...57
Figure 3.3: Measurement of Cr (VI) concentration in E. cloacae
bacterial strain (with and without sodium azide) using DPC assay...59
Figure 3.4: Measurement of Cr (VI) concentration in P. mirabilis
bacterial strain (with and without sodium azide) using DPC assay...61
Figure 3.5: Measurement of Cr (VI) concentration in E. coli
bacterial strain (with and without sodium azide) using DPC assay...63
Figure 3.6: Measurement of Cr (VI) concentration in M. capsulatus
bacterial strain (with and without sodium azide) using DPC assay...65
Figure 3.7: Measurement of total chromium concentration in Ps. aeruginosa
bacterial strain (with and without sodium azide) using ICP-OES...67
Figure 3.8: Measurement of total chromium concentration in E. cloacae
bacterial strain (with and without sodium azide) using ICP-OES...6 8
Figure 3.9: Measurement of total chromium concentration in P. mirabilis
bacterial strain (with and without sodium azide) using ICP-OES...69
Figure 3.10: Measurement of total chromium concentration in E. coli
bacterial strain (with and without sodium azide) using ICP-OES...70
Figure 3.11: Measurement of total chromium concentration in M. capsulatus
bacterial strain (with and without sodium azide) using ICP-OES...71
Figure 3.12: Measurement of Cr (VI) concentration in autoclaved Ps. aeruginosa
bacterial strain (with and without sodium azide) using DPC assay...73
Figure 3.13: Measurement of Cr (VI) concentration in autoclaved E. cloacae
bacterial strain (with and without sodium azide) using DPC assay...74
Figure 3.15: Measurement of Cr (VI) concentration in autoclaved E. coli
bacterial strain (with and without sodium azide) using DPC assay...76
Figure 3.16: Measurement of Cr (VI) concentration in autoclaved M. capsulatus
bacterial strain (with and without sodium azide) using DPC assay...77
Figure 3.17: Measurement of total chromium concentration in autoclaved Ps. aeruginosa bacterial strain (with and without sodium azide) using ICP-OES...79
Figure 3.18: Measurement of total chromium concentration in autoclaved E. cloacae bacterial strain (with and without sodium azide) using ICP-OES...80
Figure 3.19: Measurement of total chromium concentration in autoclaved P. mirabilis bacterial strain (with and without sodium azide) using ICP-OES...81
Figure 3.20: Measurement of total chromium concentration in autoclaved E. coli
bacterial strain (with and without sodium azide) using ICP-OES...82
Figure 3.21: Measurement of total chromium concentration in autoclaved M. capsulatus bacterial strain (with and without sodium azide) using ICP-OES...83
Figure 3.22: Percent Cr (VI) removal using live and autoclaved
bacterial strains in the supernatant at the end of incubation period...8 8
Figure 4.1: French press cell disruptor...95
Figure 4.2: Agarose gel electrophoresis profile of P. mirabilis 090321-A strain... 97
Figure 4.3: Chromate (VI) removal using cell fractions of P. mirabilis...99
Figure 4.4: Chromatogram of Cr (VI) and Cr (III) in P. mirabilis
supernatant samples using ICP-MS ... 102
Figure 4.5: Cr (III) and Cr (VI) profiles in P. mirabilis
supernatant during the reaction tim es... 103
Figure 4.7: FTIR spectra (900-1300 cm '1) of P. mirabilis
With Y^CviOq at different incubation times...107
Figure 4.8: FTIR spectra (1350-1700 cm '1) of P. mirabilis
with K^C^O? at different incubation tim es...108
Figure 4.9: FTIR spectra (2800-3000 cm '1) of P. mirabilis
with K2Cr2 0 7 at different incubation times...109
Figure 4.10: FTIR spectra (3700-3900 cm '1) of P. mirabilis
with K2Cr2 0 7 at different incubation times...1 1 0
Figure 4.11: Confirmation of Cr (VI) removal using P. mirabilis HI4320
and 09032-A bacterial strains...I l l
Figure 5.1: Samples of contaminant bacteria associated w ithM capsulatus (Bath) 121
Figure 5.2: Agarose gel electrophoresis of 16S rNA gene-specific PCR using cells
prepared in various ways as the templates... 125
Figure 5.3: Purified PCR products in agarose gel electrophoresis... 126
Figure 5.4: Cr (VI) removal using M. capsulatus (Bath)
in high and low CuSC>4 NMS media... 128
Figure 5.5: Total chromium concentration using M. capsulatus (Bath)
in high and low Q1SO4 NMS media... 129
Figure 5.6: Cr (VI) removal using M. capsulatus (Bath)
in the presence of phenylacetylene (200 pM )...131
Figure 5.7: Chromatogram of Cr (VI) and Cr (III) in M. capsulatus (Bath)
supernatant samples using ICP-M S...134
Figure 5.8: Cr (III) and Cr (VI) profiles in M. capsulatus (Bath)
supernatant samples during the reaction tim es...135
Figure 5.10: FTIR spectra (1040-1140 cm '1) of M. capsulatus (Bath) with
potassium dichromate at different incubation tim es...137
Figure 5.11: FTIR spectra (1440-1480 cm’1) of M. capsulatus (Bath) with
potassium dichromate at different incubation times... 138
Figure 5.12: FTIR spectra (2780-2880 cm '1) of M. capsulatus (Bath) with
potassium dichromate at different incubation times... 139
Figure 5.13: FTIR spectra (2880-2980 cm '1) of M. capsulatus (Bath) with
potassium dichromate at different incubation times... 140
Figure 5.14: 16S rRNA gene sequences electrophoresis gel profile
of contaminant bacteria... 141
Figure 5.15: Cr (VI) removal using mixed culture
(M. capsulatus + Bacillus licheniformis)... 142
Figure 5.16: Comparison between pure M. capsulatus (Bath) and mixed culture
(M. capsulatus (Bath) + Bacillus licheniformis) in Cr (VI) rem oval... 143
Figure A .l: Typical standard curve of Cr (VI) at OD 540 nm using DPC...186
Figure A.2: Standard curve for Cr (VI) concentration for every K^C^Cb...187
Figure A.3: Standard curve of chromium concentration
in nutrient broth no.2 medium... 190
Figure A.4: Standard curve of chromium (VI) concentration in M9 medium... 191
Figure A.5: Standard curve of chromium (VI) concentration in NMS m edium ...192
Figure A.6: Standard curve of chromium (VI) concentration in lysozyme solution 193
Figure A.l: Standard curve of chromium (VI) concentration in tris-HCl solution 194
LIST OF TABLES
Table 1.1: Adequate intakes for chromium...8
Table 2.1: Composition of nutrient broth no.2 medium ...29
Table 2.2: Composition of M9 m edium ...29
Table 2.3: Composition of NMS m edium ... 30
Table 2.4: Amount of K^C^Cb and H2SO4 used for the standard curve... 33
Table 2.5: Amounts of K^C^Cb and deionised H2O ... 35
Table 3.1: Summary o f Cr (VI) concentrations using DPC assay after 120 hours of bioremediation process...85
Table 3.2: Summary o f total chromium concentrations using ICP-OES after 120 hours of bioremediation process...8 6 Table 4.1: List of important functional groups and their corresponding infrared spectral bands...105
Table 4.2: Results of BLAST search with the E. coli Fre oxidoreductase against P. mirabilis genome... 112
Table 4.3: Results of BLAST search with the Chromate efflux system ChrA against P. mirabilis genome... 113
Table 4.4: Results of BLAST search with the E. coli nitroreducatse NfsA against P. mirabilis genome... 114
Table 4.5: Results of BLAST search with the B. subtilis YcnD chromate reductase against P. mirabilis genome... 115
Table 4.6: Results of BLAST search with the Desulfovibrio vulgaris cytochrome c against P. mirabilis genome... 116
Table A.2: Amounts of Cr (VI) concentration for every K^C^Cb volum e...187
Table A.3: Amounts of K^C^Cb and deionised H2O ... 189
Table A.4: Cr (VI) concentration vs optical density of nutrient broth no.2 m edium ...190
Table A.5: Cr (VI) concentration vs optical density of M9 m edium ...191
Table A. 6: Cr (VI) concentration vs optical density of NMS m edium ... 192
Table A.7: Cr (VI) concentration vs optical density of lysozyme solution...193
ABBREVIATIONS
a.u. Absolute unit
BSA Bovine serum albumin
Cr (III) Trivalent chromium
Cr (VI) Hexavalent chromium
DNA Deoxyribonucleic acid
dNTP Deoxynucleotide triphosphates
DPC Diphenylcarbazide
EDTA Ethylenediamine tetra acetic acid
FTIR Fourier Transform Infrared
G Acceleration due to gravity o f the earth (m/s2)
IC Ion chromatography
ICP-MS Inductively coupled plasma-mass spectrometry
ICP-OES Inductively coupled plasma optical emission spectrometry
K2Cr207 Potassium dichromate
Kb Kilobase
KDa Kilo Dalton
mg/1 Milligram per litre
MgCl2 Magnesium chloride
mM Millimole
Pi Micro litre
NaN3 Sodium azide
Nm Nano meter
NMS Nitrate mineral salts
OD Optical density
PCR Polymerase chain reaction
rpm Revolution per minute
RuMP Ribulose monophosphate
SDS Sodium dodecyl suphate
Tris-HCl Tris (hydroxyl methyl) methyl ammonium chloride
V Volt
CHAPTER 1
1.1 Introduction
Chromium is a heavy metal like cadmium, lead, copper and nickel that can contaminate soils, ground water, sediments and surface waters. It is extremely toxic to biological and ecological systems. Heavy metals can be released by the discharge of effluent into the environment by a variety of industries such as electroplating, leather tanning, wood preservation, wood pulp processing, steel manufacturing, etc. (Faisal and Hasnanin, 2004). Such pollution is a danger to human health and the environment because of the low solubility of many heavy metals and their carcinogenic and mutagenic properties (Alloway, 1995; Diels et al., 2002).
Physico-chemical methods have been devised for the treatment and removal of heavy metals from contaminated environments. These methods include electrochemical treatment, ion exchange, precipitation, reverse osmosis, evaporation and sorption (Kadirvelu et al., 2001; Kadirvelu et al., 2002). Microbial reduction of heavy metals has been proposed as an alternative method of remediation. In this work, the potential of Gram-negative environmental bacteria was investigated as a means of hexavalent chromium remediation.
1.2 Chromium
Chromium (Cr) is a heavy metal that occurs naturally in the environment (primarily in rocks and minerals) in the form of metal-ores such as those containing iron. It is a transition element, located in group VI of the periodic table, and was discovered in 1797 by the French chemist, Louis-Nicolas Vaquelin (1763-1829) in a mineral known as Siberian red lead ore (crocoites). The word chromium was derived from the Greek word ‘chroma’ that means ‘colour’ because many chromium compounds have distinctive colours ranging covering the visible spectrum (Young, 2000).
odourless, tasteless and malleable. Physical properties that greatly add to chromium’s commercial importance are that it can be polished to a high shine, has high corrosion resistance and hardness. Chromium is a metal that does not react with water but does react with most metals. It combines slowly with oxygen at room temperature to form chromium oxide (Q2O3). The chromium oxide form acts as a protective layer, preventing
the metal from reacting further with oxygen (Young, 2 0 0 0).
1.2.1 Chromium chemistry
Chromium is found in all compartments of the environment including air, water and soil. It has been reported that chromium contamination in soil and water is caused by leakage, unsuitable storage, or improper disposal practices of chromium wastes (Rock et al., 2001). Chromium exists in nine valence states, ranging from -2 to + 6 (Smith et al.,
2002). The most common oxidation states of chromium are +2, +3, and +6. The most
stable forms of chromium are the trivalent Cr (III) and hexavalent Cr (VI) species, which display different chemical properties (Fendorf et a l, 1992; Fukai, 1967; Holleman et al., 1985; Jan and Young, 1978; Kota and Stasicika, 2000; McGrath and Smith, 1990; Sarangi and Krishnan 2008; Shanker et al., 2005). Naturally occurring chromium exists predominantly in its chromic (Cr3+) form, while the chromate (CrC>42') state is rarely
found in nature.
2
(VI) in natural waters are HCrCV and C1O4 ' (Katz and Salem, 1994; Richard and Bourg,
1992).
Cr (VI) is a strong oxidizing agent particularly in acidic media and associates with oxygen, forming the chromate and dichromate anions (Lai and Lo, 2008). The relative proportion of these anions depends on pH and total Cr (VI) concentration. H2Cr0 4 is a
strong acid and at pH > 1, its deprotonated forms prevails, while above pH7 only CrC>42'
ions exist in solution throughout the concentration range. Between pH 1 and 6, HCrO4' is the predominant form up to 10’ M Cr (VI), when it starts to condense yielding the orange-red C^Cb '. Cr (VI) oxyanions can be reduced to Cr (III) by reducing agents such as organic matter or reduced inorganic species, which are widely found in soil, water and atmospheric systems (Kota and Stasicka, 2000). The predominant form of Cr (III) at pH less than 3 is Cr3+. As pH increases, the hydrolysis of Cr (III) occurs and the most abundant species become CrOH2+, Cr(OH) 2 ,Cr(OH) 3 and Cr(OH) 4 (Palmer et a l,
1991).
1.2.2 Industrial uses o f chromium
Chromium compounds are used in several industrial processes and products including; dyes and pigments, additives in cooling water, chrome plating, leather tanning and wood preservation and cement manufacturing (Zayed and Terry, 2003). One of the most important applications of chromium is in the production of steel; high-carbon and other grades of ferro-chromium alloys are added to steel to improve mechanical properties, increase hardening and enhance corrosion resistance. It also added to cobalt and nickel-base alloys for the same purpose (Barlett, 1991; Katz and Salem, 1994). Chromium is also used in coatings, as it is applied on the surface of other metals for decorative purposes, to enhance resistance and to lower the coefficient of friction.
Cr (III) chloride is used for chromium plating, in leather tanning, as a waterproofing agent and as a catalyst for polymerization of alkenes. Cr (III) sulfate is used as the electrolyte to produce pure chromium metal. Other important applications of chromium III sulfate are as a mordant for treatment of fabrics before dyeing, to dissolve gelatin, to impart green colour to paints, varnishes, inks and ceramic glazes and as a catalyst. Cr (III) oxide is used as pigment for glass and fabrics. It is also used in metallurgy, as a component of refractory bricks, abrasives and ceramics and to prepare other chromium salts. Cr (III) fluoride is used in printing and dyeing woollens, mothproofing woollen materials, metal polishing and colouring marbles (Palmer and Wittbrodt, 1991; Sawyer et al, 1994).
Cr (VI) oxide is used in purification of oil and for cleaning laboratory glassware and for chromium plating, copper stripping, as an oxidizing agent for conversion of secondary alcohols into ketones, and as a corrosion inhibitor, (Ayres, 1992; Nriagu and Pacyna, 1988; Patnaik, 2003).
Atm osphere
Dust
Cr20 3, Cr03, hLCrCL,
V
Humans & Animals
ft
- V
V
t
PlantsSoil
Global Emission
Chromium Industry
Chrome plating, Leather
.Sewage Sludge tannin& Pigment
productions, etc.
Rivers, Sea & Oceans
1.2.3 Health issues
Chromium is unique among toxic elements in that environmental legislation regulates different species of chromium, specifically Cr (III) and Cr (VI), based on their differing toxicities. All other toxic elements such as lead, cadmium and arsenic are regulated based on their total concentrations, irrespective of their oxidation state (Cheung and Gu, 2002 & 2003; Kimbrough et al., 1999; McLean et al., 2000). People can be exposed to chromium through breathing, eating or drinking and through skin contact with chromium or its compounds.
Cr (VI) is a known mutagen and carcinogen and it is more soluble and more mobile than Cr (III). Cr (VI) is considered the most toxic form of chromium to human, animals, and plants (Moore et al., 1984). In addition to an increased risk of respiratory cancer, Cr (VI) is also known to be a skin irritant leading to ulcerations causing allergic contact dermatitis (Ajmal et al., 1984; Nethercott, et al., 1994; Seishima et al., 2003; Wong and Trevors 1988). Other respiratory problems caused by Cr (VI) exposure include nasal irritations and bleeds (Kou, 1997), and lung carcinoma (Ajmal et al., 1984; Wong and Trevors 1988). The reason for such toxicity arises from the possibility of free diffusion of Cr (VI) across the cell membrane and its strong oxidative potential (Turpeinen et al., 2004).
Unlike Cr (VI), trivalent chromium is an essential nutrient for humans, even though in trace quantities. According to Anderson et al. (1992), most foods provide less than 2 pg of chromium per serving. The study reported the recommended daily chromium intakes, provided in the Dietary Reference Intakes (DRIs) developed by the Institute of Medicine of the National Academy of Sciences, which ranges between 50 to 200 pg (Institute of Medicine Food and Nutrition Board, 2001; National Research Council, Food and Nutrition Board, 1989).
Table 1.1: A dequate Intakes (AIs) for chromium
Age Infants and
Children (pg/day)
Male (pg/day)
Female (pg/day)
Pregnancy (pg/day)
Lactation (pg/day)
0 to 6 months 0 . 2
7 to 12 months 5.5
1 to 3 years 1 1
4 to 8 years 15
9 to 13 years 25 2 1
14 to 18 years 35 24 29 44
19 to 50 years 35 25 30 45
Elder than 50 years 30 2 0
1.2.4 Traditional m ethods fo r chrom ium remediation
Several treatment technologies have been developed for removal of heavy metals, including hexavalent chromium, from the environment (e.g. from soil, industrial processes effluents and wastewater streams). Some of these methods include physical and chemical techniques, such as electrochemical precipitation, biosorption, membrane filtration, ion exchange, reverse osmosis and air and steam stripping (Ahluwalia and Goyal, 2007; Bhide et al., 1996; Beleza et al., 2001; Camargo et a l, 2003; Kadirvelu et al., 2001 and 2002; Krishna and Philip, 2005; Mahajan, 1985; Nyer, 1992; Patterson, 1985; Sikaily et a/., 2007).
Some of these techniques present the disadvantages of producing chemical residues that are harmful to the environment. For instance, conventional chemical treatment involves the reduction of Cr (VI) to Cr (III) by a reducing agent at low pH and neutralization of the solution in order to precipitate Cr (III) as hydroxide (Wang and Shen, 1997). This method generates large amounts of secondary waste products. The electrochemical precipitation process, which is commonly used for treating wastewaters, creates sludge that requires subsequent disposal. Ion exchange is an alternative technology, although it is a non selective procedure and highly sensitive to the pH of the solution, and requires expensive equipment.
process (Volesky and Naja 2007). Non-living biomass appears to present specific advantages in the form of a biosorption process (Ozturk et al., 2004). It contributed to removal of toxic Cr (VI) under all conditions tested including when the cells are no longer alive.
The membrane filtration technique has received significant attention for wastewater treatment (Pugazenthi et al., 2005). It involves the application of hydraulic pressure to bring about the desired separation through a semipermeable membrane. This technique has several drawbacks apart from being expensive. It gives only incomplete removal of the metal that requires a high energy input and expensive reagents. It also generates toxic sludge and other waste products that require disposal. Chromium can also be removed using methods such as chemical precipitation, and membrane separation, although such approaches are not effective at metal concentrations below 1 0 0 mg I’ 1
(Kapoor and Viraraghavan, 1995).
1.3 Environm ental bacteria
1.3.1 Bacterial cell structure
Bacteria can be classified into two distinct groups; Gram-positive and Gram- negative bacteria, based on the structural differences of their bacteria cell walls as shown in Figure 1.2. Gram-positive bacteria are the ones that retain the crystal violet dye when washed in a decolorizing solution, while, Gram-negative bacteria do not retain crystal violet dye in the Gram staining protocol.
O uter m em brane
Cell wall Cytoplasm
C ytoplasm ic m em brane
Gram-negative
bacterium Gram-positivebacterium
Figure 1.2: Cell structure o f Gram-positive & Gram-negative bacteria
The Gram-negative bacteria include the Cyanobacteria, Spirochaetes, green sulfur and green non-sulfur bacteria and Proteobacteria. Important examples of the Proteobacteria include Pseudomonas, Moraxella, Helicobacter, Stenotrophomonas, Legionella, acetic acid bacteria; the Enterobacteriaceae includes Escherichia coli, Salmonella, Shigella and many others.
1.3.2 Methanotrophic bacteria
Methanotrophs or methanotrophic bacteria are a subset of a physiological group of bacteria known as methylotrophs, i.e. microorganisms able to grow using organic compounds that lack carbon-carbon bonds. Methanotrophs were first detected by Sohngen in 1906 and are distinguished from other microorganisms by their ability to utilize methane (CH4) as their sole carbon and energy source (Anthony, 1982, 1986 &
1991; Dijkhuizen et al, 1992; Hanson, 1992; Hanson et al., 1991; Lidstrom, 1991; Whittenbury and Dalton, 1981; Whittenbury and Krieg, 1984). The best characterised methanotrophs are aerobic bacteria that play a major role in the global cycling of carbon, nitrogen and oxygen as well as in the degradation of hazardous organic material. Most methanotrophs discovered to date show optimal growth at moderate pH (5-6) and temperature ranges (20-35 °C), but psychrophilic (growth < 1 5 °C), thermophilic (growth > 40 °C), alkaliphilic (growth at pH > 9.0), and acidophilic (growth at pH < 5) methanotrophs have been isolated (Semrau et al., 2010).
Methane is the most stable carbon compound in anaerobic environments and is an important intermediate in the anaerobic mineralization of organic matter (Lontoh, 2000). Methane escapes from anaerobic environments to the atmosphere when it is not oxidized by methanotrophs. Methane is oxidized either photo-chemically in the atmosphere or biologically in terrestrial and aquatic systems. The release of methane to the atmosphere results in an increased rate of global warming and causes other changes in the chemical composition of the atmosphere (Ehalt and Schmidt, 1978; Lelieveld et al., 1993). Figure 1.3, adapted from Ward et al. (2004), depicts the ocean, grasslands and desert as major methane sinks, while wetlands, agricultural and grazing lands form the major sources of methane.
W etlands Forest
Figure 1.3: Global methane cycle (adapted from Ward et al., 2004)
Desert
k
Ocean
Agriculture and
1.3.2.1 Classification o f methanotrophs
The first methanotrophic bacterium that was isolated in 1906 (Sohngen, 1906) was named Bacillus methanicus. Then, Whittenbury et al. (1970) isolated and characterized more than 1 0 0 new methane-utilizing bacteria and thus established the basis
for the current classification of methanotrophs. Whittenbury separated the known methane-oxidizing bacteria into five groups; Methylomonas, Methylobacter, Methylococcus, Methylocystis, and Methylosinus based on morphological differences, types of resting stages, the fine structures of intracytoplasmic membranes, and some physiological characteristics (Whittenbury and Dalton, 1981; Whittenbury et al., 1970).
The majority of well characterized methanotrophs are Gram-negative bacteria that are classified as type I or type II methanotrophs according to whether they belong to the y or a- subdivisions of the proteobacteria respectively although additional groups of methanotrophs are now known (Smith and Murrell, 2009).
1.3.2.2 Methanotrophs and the bioremediation process
Because of the wide substrate range of methane monooxygenase enzymes (MMOs), methanotrophs have attracted the interest of researchers involved in the development of biological methods for degradation of toxic chemicals and organic synthesis (Higgins et al., 1982; Large and Bamforth, 1988). The MMO enzymes, found in methanotrophic bacteria, catalyze the conversion of methane to methanol using dioxygen as the oxidant at ambient temperatures and pressures. These systems have also attracted considerable attention in studying the mechanism of biological methane oxidation (Anthony, 1982; Bedard and Knowles, 1989; Crabtree, 1995; Smith and Murrell, 2009).
their physiology and genetics (Dalton and Stirling, 1982; Davies and Whittenbury, 1970; Haber et a l, 1984; Higgins et al, 1980; Large and Bamforth, 1988; Quayle, 1980; Whittenbury et al, 1970). Recently, methanol has largely replaced methane as a potential feedstock for industrial fermentations involving methanotrophic bacteria. Methanol is abundant, stably priced, relatively safe to use, and easily stored and transported.
The first step in the pathway for methane oxidation is oxidizing methane to methanol by MMO enzymes (Anthony, 1982 & 1986; Dalton, 1991; Dalton and Leak, 1985; Lipscomb, 1994). MMOs are monooxygenases that use two electrons to split the covalent bonds of O2 (Figure 1.4). One of the oxygen atoms is reduced to form H2O and
the other is incorporated into methane to form CH3OH.
There are two major pathways for carbon assimilation in methanotrophs; the type I methanotrophs assimilate carbon into cell biomass predominantly by the ribulose monophosphate (RuMP) pathway, and the type II methanotrophs use the serine pathway. Approximately 50% of the carbon is assimilated into cell biomass as formaldehyde and the remaining 50% is further oxidized to CO2 by formaldehyde dehydrogenase (FADH)
and formate dehydrogen (FDH) (Vorholt, 2002).
TYPE I METHANOTROPHS RuMP PATHWAY
NAD NADH+H
PQQ PQQH2 2H NAD NADH+H
HCHO HCOOH
MMO MDH FADH FDH
[image:39.612.61.484.393.623.2]SERINE PATHWAY TYPE II METHANOTROPHS
1.3.2.3 Enzymology o f methanotrophs
Methane-oxidising bacteria possess two distinct types of MMO enzymes: soluble, cytoplasmic enzyme complex (sMMO) and a membrane-bound, particulate enzyme system (pMMO). The single factor that governs expression of the two types of MMO in these organisms is the concentration of available copper (Lee and Lipscomb, 1999; Lloyd et al., 1997). At high copper-to-biomass ratio pMMO is produced, whereas the soluble form of the enzyme (sMMO) is expressed when the copper-to-biomass ratio is low (Jahng and Wood, 1996; Murrell 2000; Prior and Dalton, 1985a; Stanley et al., 1983; Smith and Dalton, 1989; Smith and Murrell, 2008). Several research studies reported that the pMMO enzyme is found in most known methanotrophs and is located in the cytoplasmic membrane.
Methanotrophs that possess only pMMO, such as Methylomonoas methanica and Methylomicrobium album. Type II methanotrophs Methylyocella sylvestris has been shown to possess sMMO but not pMMO. Methylococcus capsulatus (Bath) type I and Methylosinus trichosporium OB3b (type II) can produce either form of MMO (Smith and Murrell 2009).
1.3.2.3.1 Particulate methane monooxygenase (pMMO)
The pMMO, shown in Figure 1.5, is a multiple copper containing enzyme, although the number and roles of copper ions in the active form of the enzyme continues to be unclear, as the possible involvement of iron in the metal centres of the enzyme (Lieberman and Rosenzweig, 2005; Martinho et al., 2007). pMMO has proven more diffcult to study than sMMO because is loses activity when solubilised (Myronova et al., 2006; Nguyen et al., 1994; Nguyen et al., 1996; Semrau et al., 1995; Lieberman and Rosenzweig, 2005). The first reliable purification procedure for isolation of the pMMO complex from M. capsulatus was achieved by Smith and Dalton (1989) using dodecyl (3- D maltoside as the solubilising agent.
kDa and a putative reductase (pMMOR) comprising of 63 and 8 kDa proteins (Basu et al., 2003; Zahn and DiSpirito, 1996).
NADH + H + 0 2 +
OH
+ n a d++ h2oFigure 1.5: pMMO crystal structure showing the proposed association o f the enzyme with the lipid bilayer o f the membrane (adapted from Lieberman and Rosenzweig,
2005)
1.3.2.3.2 Soluble methane monooxygenase (sMMO)
Figure 1.6: sMMO crystal structure (adapted from Lieberman and Rosenzweig, 2005)
The sMMO is a well characterized enzyme, which has broad substrate specificity, oxidizing a wide range of aliphatic and aromatic compounds (Dalton 1992; Semrau et al.,
c h3o h + h2o
Fe OH OH
Hydroxylase (x (X Hydroxylase
Protein B
2e
► Fe2S; FAD
Reductase
NADH
[image:43.612.119.379.78.340.2]NAD + H
Figure 1.7: Model o f sMMO complex from Methylococcus capsulatus (Bath) (adapted from Bowman et al., 1991).
1.4 Bioremediation of chrom ium
Bioremediation is the use of biological organisms such as bacteria, fungi, green plants or their enzymes to reduce, remove, or immobilize contaminants (McCullough et al., 1999; Volesky, 1986). The popularity of bioremediation approaches is attributed to their low cost, high efficiency, minimisation of chemical and biological sludge and possibility of metal recovery. Biological treatment could significantly reduce the costs for chemicals and energy compared with conventional physico-chemical treatments described earlier.
chromate-polluted wastewater. Bioremediation of toxic chromium compounds is of a special interest since this metal has found a variety of industrial applications (Bamhardt, 1997) and as a consequence it causes severe environmental problems due to its extreme toxicity to living organisms (Cieslak-Golonka, 1995; Cohen et al., 1993). A large number of bacterial strains have been evaluated for reducing Cr (VI) to Cr (III) (Cher and Hao,
1996; Fude et al., 1994; Lovely and Philips, 1994; White et al., 1997).
In general bioremediation of heavy metals operates by conversion of the metal ions into insoluble forms by specific enzyme-mediated reactions that remove them from the aqueous phase (Park et al., 2000). A number of bacteria possess chromate reductase activity that can convert Cr (VI) to Cr (III), which is much less toxic and less soluble, and thus reduction by these enzymes provides a means of chromate bioremediation (Gadd and White, 1993).
1.4,1 Types o f microorganisms capable o f hexavalent chromium
biorem ediation
Microbial reduction of Cr (VI) is considered to be an effective alternative method to the use of chemicals (Cervantes et al., 2001). Since the discovery of the first microbe capable of reducing Cr (VI) in the 1970s (Romanenko and Korenkov, 1977), a number of bacterial strains (both aerobic and anaerobic) have been isolated and investigated for Cr (VI) reduction such as B. cereus, B. subtilis, Pseudomonas, aeruginosa, Pseudomonas ambigua, Pseudomonas fluorescens, E. coli, Achromobacter eurydice, Micrococcus roseus, Desulfovibrio desulfuricans and D. vulgaris (Lovley, 1993 & 1994). E. coli (ATCC 33456) and Shewanella alga (BrY-MT) have also been shown to reduce Cr (VI) (Blake II et al., 1993; Camargo et al., 2003; Cheung et al., 2006; Guha et al., 2001; Shakoori et al., 1999 & 2000; Shen and Wang, 1994; Wang and Xiao, 1995).
(McLean and Beveridge, 2001), and Alcaligenes (Peitzsch et al., 1998) can reduce Cr (VI) to Cr (III).
Sulfate-reducing bacteria (SRB) have been extensively studied for reduction of metals, including Cr (VI) (Chardin et al., 2002; Lovley, 1995; Michel et al., 2001). Enterobacter cloacae HOI is a Cr (VI) reducing facultative anaerobe. In this species, oxygen inhibits Cr (VI) reduction as does the presence of other toxic metals (Kato and Ohtake, 1991; Ohtake et al, 1990; Wang et al, 1989). Other reported Cr (VI) reducing anaerobes include Microbacterium sp. MP30 (Pattanapipitpaisal et al., 2001), Geobacter metallireducens (Lovley et al., 1993), Shewanella putrefaciens MR-1 (Myers et al., 2000), Pantoea agglomerans SP1 (Francis et al., 2000), Agrobacterium radiobacter EPS- 916 (Llovera et al., 1993) and a consortium that can both reduce Cr (VI) and degrade benzoate (Shen et al., 1996). Several attempts have been reported of Cr (VI) reductase purification from pseudomonads (Ackerley et al., 2004; Cheung et al., 2006; Kwak et al., 2003; Park et al., 2002).
A number of studies have shown biosorption of chromium species by yeast (Rapoport and Muter, 1995; Raspor et al., 2000), especially Saccharomyces cerevisiae which is a waste product of industrial fermentations (Engl and Kunz, 1995; Krauter et al., 1996; Volesky and May-Phillips, 1995). S. cerevisiae can accumulate chromium and cadmium (Brady and Duncan, 1994) and other metals (Raspor et al., 2000). Among other yeast, Cr (VI) resistant Candida sp. and Rhodosporidium strains have been isolated from industrial wastes (Pepi and Baldi, 1992), Schizosaccharomyces pombe wild type and mutant strains have been studied for uptake and tolerence o f Cr (VI) (CzakoVer et al.,
1999), and Candida intermedia has been used to study the Cr (III) accumulation (Batic and Raspor, 2000).
Faisal and Hasnain (2004) reported that chromium resistant bacteria isolated from effluent of tanneries could resist up to 250 pgml' 1 of Cr (VI) in the medium. They also
reported that the amount of chromium accumulated by the cells increased with increase in concentration of chromium from 100 to 1000 pgml*1. Megharaj et al. (2003) also reported another bacterial strain, which was isolated from polluted soil, could resist up to 1 0 0
al. (2000) are resistant to a broad range of heavy metals (Mn, Ni, Zn, Pb, Cu and Co) and antibiotics (ampicillin, chloramphenicol, kanamycin, streptomycin, tetracycline). The simultaneous presence of resistances to metals and antibiotics is consistent with the co localisation of genes specifying resistance to metals and antibiotics on the same plasmids and also suggests that such strains could be used for the bioremediation of multiply contaminated industrial effluents.
The first enzyme described with the ability to transform Cr (VI) to Cr (III) was a Cr (VI) reductase from chromate-resistance Enterobacter cloacae HOI (Ohtake et al.,
1990). This is a membrane-associated enzyme that transfers electrons to Cr (VI) via NADH-dependent cytochromes (Wang et al., 1990). Ishibashi et al. (1990) partially purified a soluble Cr (VI) reductase from Ps. putida PRS2000. Suzuki et al. (1992) reported a 38-fold purification of a soluble Cr (VI) reductase from Ps. ambigua. In Ps. aeruginosa, Cr (VI) resistance is attributed to the decreased uptake and enhanced efflux of Cr (VI) by the cell membrane (Bopp et al., 1983; Ohtake et al., 1987; Alvarez et al.,
1999; Aguilera et al., 2004). A similar mechanism of resistance has been reported for Alcaligenes eutrophus CH34 (Vails et al., 2000; Vaneechoutte et al., 2004). Conversely, other investigations with Ps. fluorescens showed that Cr (VI) resistance does not depend upon the capacity of the organism to reduce this chemical (Bopp and Ehrlich, 1988). Thus, Cr (VI) reduction activity was found to be same in sensitive (wild-type) and resistant (mutant) strains when assayed at sub-lethal Cr (VI) levels. Other pseudomonads capable of reducing Cr (VI) include a close relative of Pseudomonas synxantha and an unidentified species (Gopalan and Veeramani, 1994; McLean et al., 2000).
1.4.2 Mechanisms of bacterial chromium reduction
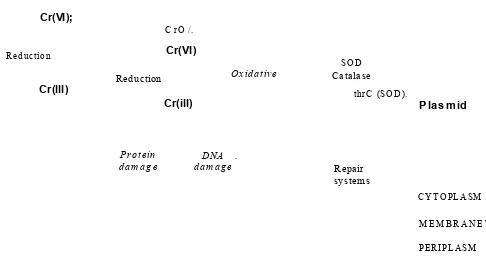
Chromate crosses the biological membranes of the bacterial cell, as illustrated in Figure 1.8, by the means of sulfate uptake pathway, which reflects the chemical analogy between these two oxyanions. Inside the cell, Cr (VI) is reduced to Cr (III) by action of various enzymatic or nonenzymatic activities; the Cr (III) generated may then exert diverse toxic effects in the cytoplasm (Ramirez-Diaz et al., 2008).
At the extracellular level, Cr (VI) rapidly enters to the cytoplasm where it may exert its toxic effects (Katz and Salem 1993; Wong and Trevors 1988). In the cytoplasm, Cr toxicity is mainly related to the process of Cr (VI) reduction to lower oxidation states (i.e. Cr (III) or Cr (V)) during which free radicals may be formed (Kadiiska et al., 1994; Shi and Dalai 1990). It has been reported in several research studies (Cervantes and Campos-Garcia 2007; Nies et al., 1998) that enzymes catalysing chromate reduction in bacterial isolates may be encoded either by plasmids or by chromosomal genes.
Cr(VI);
C r O /.
Cr(VI)
R eduction S O D
Catalase Oxidative
Reduction
Cr(lll) thrC (SO D ).
Cr(ill) Plasm id
Protein
dam age dam ageDNA . Repair
system s
[image:47.612.121.364.442.574.2]C Y TO PLA SM M E M B R A N E ’ PER IPLA SM
In Figure 1.8, mechanisms of damage and resistance are indicated by thin and heavy arrows, respectively. A) Chromosome-encoded sulfate uptake pathway which is also used by chromate to enter the cell; when this pathway is mutated (X) the transport of chromate diminishes. B) Extracellular reduction of Cr (VI) to Cr (III) which does not cross the membrane. C) Intracellular Cr (VI) to Cr (III) reduction may generate oxidative stress, as well as protein and DNA damage. D) Detoxifying enzymes are involved in protection against oxidative stress, minimizing the toxic effects of chromate. E) Plasmid- encoded transporters may efflux chromate from the cytoplasm. F) DNA repair systems participate in the protection from the damage generated by Cr derivatives.
Several bacterial Cr (VI) reductase enzymes show an NADH: flavin oxidoreductase activity and can use Cr (VI) as electron acceptor (Gonzalez et al., 2005). The ability to reduce chromate may be a secondary function for the “Cr (VI) reductase’'’ enzymes, which may have a different natural role within the cell besides Cr (VI) reduction. For instance the nitroreductases NfsA/NfsB from Vibrio han>eyi is a nitrofurazone nitroreductase that also exhibits Cr (VI) reductase activity as a secondary function (Kwak et al., 2003). Similarly, feme reductase (FerB) from Paracoccus dentrificans can use both Fe (Ill)-nitrilotriacetate and Cr (VI) as substrates (Mazoch et al., 2004).
Park et al. (2000) studied ChrR from Pseudomonas putida as a Cr (VI) reductase. This enzyme, which is a 50 kDa dimer, is a soluble flavin mononucleotide-binding protein with NADH-dependent reductase activity. This multifunctional protein, besides its role as a Cr (VI) reductase, also reduces ferricyanide (Ackerley et a l, 2004). Studies with enzyme mutants showed that ChrR protects against chromate toxicity; this is possibly because it prevents the production of reactive oxygen species (ROS) by reactions involving Cr (VI) (Ackerley et a l, 2004).
1.5 Aims and objectives of the study
employed in this research were nosocomial isolated bacteria; Ps. aeruginosa 090124-B isolated from left leg ulcer, E. cloacae 090226-B isolated from a sputum sample. The third bacterial strain is P. mirabilis 090321-A, which was isolated from a wound swab and to the author's knowledge is the first strain of P. mirabilis to be tested for chromate VI bioremediation activity. Bacteria isolated from hospital infections have been found in other previous studies to contain genes that confer antibiotic resistance to inorganic ions derived from mercury (Porter et al., 1982; Nasaru et al., 2004), cadmium (Nucifora et al.,
1989), silver (Gupta et al., 2001), and arsenic (Silver et al., 1981). Such bacteria possess heavy metal resistance genes that may be present on chromosomes, plasmids, or transposons (Silver and Phung, 2005). Here, similar strains were investigated for their ability to reduce chromium (VI) and to bio-absorb chromium species.
E. coli DH5a bacterial strain, which was obtained from the microbiology laboratory of the Biomedical Research Centre (BMRC) at Sheffield Hallam University, was also used as a benchmark for Cr (VI) reduction activity. In this study, further detailed analyses were as carried out using M. capsulatus (Bath), which was obtained from NCIMB, Scotland, UK.
The present work addresses bioremediation and has the following objectives:
• To implement techniques of analysis by monitoring bioremediation of chromium (VI) as described in the literature using the proposed Gram-negative bacterial strains.
• To select appropriate media for cultivation of bacterial strains to avoid competing chemical reactions of the chromium VI directly with components of the medium. • To identify the enzymes that are responsible for Cr (VI) reduction or removal in
P. mirabilis and M. capsulatus (Bath) bacterial strains.
1.6 Outline of the thesis
The organization of the thesis reflects the sequence of steps involved in the bioremediation of hexavalent chromium using Gram-negative bacteria. A brief outline of the contents of the thesis is as follows:
• Chapter 1 presents background, literature review of chromium and environmental bacteria.
• Chapter 2 describes the materials and methods and media selection for bacterial strains cultivation.
• Chapter 3 investigates Cr (VI) interaction with Gram-negative bacteria.
• Chapter 4 focuses on further analyses during the bioremediation process o f Cr (VI) remediation using P. mirabilis.
• Chapter 5 also concentrates on detailed analyses of Cr (VI) remediation using M. capsulatus.
2.1 M aterials
2.1.1 Chemicals
1, 5-Diphenylcarbazide (DPC) reagent, sodium azide, and components of NMS and M9 media (for composition of media shown below) were supplied by Sigma-Aldrich, UK. Methane (99.95%) was supplied by Scientific and Technical Gases Ltd., UK. Acetone and sulfuric acid were supplied by Science, UK. Nutrient agar and nutrient broth no.2 were supplied by Sigma-Aldrich, UK. Potassium dichromate, chromium (III) nitrate nonahydrate, and 99% phenyl acetylene were supplied by Sigma, chemical, UK. Tris-HCl was supplied by Fisher Scientific and lysozyme was obtained from Sigma-Aldrich, UK.
2.1.2 Media
Three types of media were initially proposed to be used for bacterial cultivation. Their compositions are described in the following sub-sections. All solutions and growth media were prepared with de-ionized water and sterilised by autoclaving at 15 psi for 15 minutes at 121 C.
2.1.2.1 Nutrient broth No. 2 Medium
Table 2.1: Composition of N utrient broth No. 2 Medium
Ingredient Quantity
Meat peptone 4.3 g/1
Casein peptone 4.3 g/1
Sodium chloride 6.4 g/1
2.1.2.2 M9 Medium
M9 medium is a chemically defined growth medium used for bacterial cultures (Atlas, 1993). It was prepared in the laboratory as described in Table 2.2. All constituents were added, except MgS0 4.7H2 0, glucose, Thiamine.HC1 and CaCh solutions, to
deionized water and pH was adjusted to 7.0. After autoclaving, the mixture was allowed to cool down to room temperature. Then, MgS0 4.7H2 0 , glucose, Thiamine.HCl and
C aC f solutions were aseptically added to the mixture, which was immediately distributed into autoclaved 250 ml flasks.
Table 2.2: Composition of M9 M edium
Ingredient Quantity
Na2H P04 6 . 0 g/1
KH2H P04 3.0 g/1
NH4CI 1 . 0 g/1
NaCl 0.5 g/1
Glucose solution (20 g/1) 1 0 . 0 ml
MgSC>4.7H2 0 solution (246.5 g/1) 1 . 0 ml
Thiamine.HCl solution (10 mg/1) 1 . 0 ml
2.1.2.3 NMSMedium
The nitrate mineral salts (NMS) medium was used for growing methanotrophic bacteria (Dalton & Whittenbury, 1976; Whittenbury et al., 1970). All reagents were autoclaved and separately, sterilised phosphate buffer (pH 6.8) was added as detailed in
Table 2.3 after the medium had cooled to room temperature.
Table 2.3: Compositions of NMS medium
Ingredient Volume
10 x NMS Salts:
K N 03 (10 g) + M gS04.7H20 ( 1 0 g) + CaCl2.2H20 (2 g) + H20 to
make 1 litre and stored at 4 °C.
1 0 0 ml
Na molybdate solution:
N aM o04.2H20 (0.5 g) + H20 to make 1 litre and stored at 4 °C.
1 ml
NMS Trace Elements:
C uS04.5H20 (100 mg) + FeS04.7H20 (500 mg) + ZnS04.7H20 (400
mg) + H3B 04 (15 mg) + CoCl3.6H2 0 (50 mg) + Na2EDTA (250 mg) +
MnCl2.6H20 (20 mg) + NiCl2.6H20 (10 mg) + H?0 to make 1 litre
and stored at 4 °C.
1 ml
Fe EDTA Solution:
Fe EDTA (3.8 g) + H20 to make 100 ml and stored in the dark at 4 °C. 0 . 1 ml
W ater to 1 litre
NMS Phosphate Buffer Solution:
Na2H P04 (49.7 g) + KH2PQ4(39 g) + H20 to 1 litre.
1 0 ml
2.1.3 Bacterial strains
from left leg ulcer, Enterobacter cloacae 090226-B was isolated from a sputum sample and Proteus mirabilis 090321-A was isolated from wound swab. The other two strains; Escherichia coli DH5a was obtained from the microbiology laboratory of the Biomedical Research Centre (BMRC) at Sheffield Hallam University and Methylococcus capsulatus (Bath) was obtained from NCIMB, Scotland, UK.
2.1.3.1 Cultivation and maintenance o f bacterial strains
E. coli DH5a, E. cloacae, P. mirabilis and Ps. aeruginosa were routinely cultivated in 250 ml conical flask containing 50 ml of M9 medium and incubated in an orbital shaker (180 rpm) at 37 °C.
M. capsulatus (Bath) were grown and propagated aerobically in 250 ml conical quickfit flasks containing 50 ml of a NMS medium in the presence of methane as the source o f carbon and energy. Flasks were sealed with suba-seals (Fisher Scientific, UK) to facilitate the addition of methane using a sterile plastic syringe (Fisher Scientific, UK) fitted with hypodermic needle (Fisher Scientific, UK). 50 ml of air was then aseptically replaced with 60 ml of methane. The flasks were then incubated at 45 °C and 180 rpm in the orbital incubator shaker.
The bacterial growth, during the cultivation process, was monitored by measuring the optical density (at 600 nm) using 6715 UV/Vis spectrophotometer (JENWAY). All strains were stored at -80 °C for long-term storage in the presence of 50 % (v/v) sterile glycerol, after flash freezing in liquid nitrogen.
2.1.3.2 Bacterial strain purity check
The purity of M. capsulatus (Bath) was routinely checked by plating cultures onto nutrient agar plates, which were incubated at 37 °C for 24 hours. M. capsulatus does not grow on nutrient agar and so if any microorganisms grew on these plates this indicated contamination.
2.1.4 Equipment
• 3505 pH meter JENWAY designed and manufactured in UK, by Bibby Scientific Ltd.
• Spectrophotometer 6715 UV/Vis. spectrophotometer JENWAY single holder, supplied by Bibby Scientific Ltd., UK.
• Inductively coupled plasma-optical emission spectrometry (ICP-OES) ACTIVA HORIB JOBIN YVON Gen Co., made in France.
• A Hewlett Packard 4500 quadrupole inductively coupled plasma-mass spectrometer (ICP-MS), model number HP 4500 G 1820A, manufactured in Japan.
• Autoclave was purchased from Classic Prestige Medical, UK.
• Orbital incubator shaker was obtained from Gallenkamp, UK, and orbital incubator shaker SI 50, STUART Scientific, made in UK. Incubator Heraeus Kendro laboratory products, made in Germany.
• Modulyod 230 Freeze Dryer purchased from Thermo Electron Corporation, UK. • Sorvall RT 6000D Centrifuge supplied by Thermo Electron Corporation, UK. • RC6 centrifuge Thermo scientific Sorvall RC6 plus centrifuge Thermo Electron
Corporation, UK.
2.2 M ethods
2.2.1 Chromium (VI) standard curves using diphenylcarbazide (DPC) assay
2.2.1.1 Preparation o f potassium dichromate stock solution
Chromium (VI) solution (1.27 mg/1) was prepared by dissolving 3.6 mg of
K2Cr2 0 7 and 10 ml of concentrated sulfuric acid into 900 ml distilled water to make up a
solution of 1 0 0 0 ml.
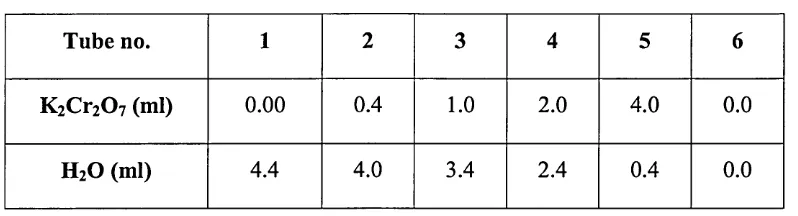
Six test tubes were obtained and labelled (1, 2, 3, 4, 5 and 6). The quantities of
[image:56.612.93.446.316.397.2]K2Cr2 0 7 and H2SO4 (0.18 M) were added to each test tube as shown in Table 2.4 below:
Table 2.4: Amounts of K2C r2 0 7 and H2SO4 used for the standard curve
Tube no. 1 2 3 4 5 6
K2C r207 (ml) 0 . 0 0 0.4 1 . 0 2 . 0 4.0 1 0
H2S 04 (ml) 1 0 9.6 9.0 8 . 0 6 . 0 0 . 0
The content of each test tube was mixed 3y shaking. Then, 0.5 ml
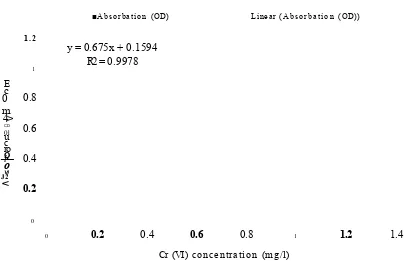
diphenylcarbazide solution (0.5 g in 200 ml of acetone) was added to each test tube. The contents of each test tube were mixed and left to stand for 5 minutes for colour development. The absorbance of each sample was measured using the spectrophotometer at a wavelength of 540 nm (Herrmann, 1994). A standard curve of known Cr (VI) concentrations was prepared in the same medium used for the experiments. The standard curve showed a high degree of linearity. Figure 2.1 shows representative standard curve in water, which showed a high correlation coefficient R2 = 0.9978. This curve was then
■Absorbation (OD) Linear (A bs or b at io n (OD)) E c 0 m 4-> CD 01 u c ro _Qi—
o
V) J2<
1.2y = 0.675x + 0.1594 R2 = 0.9978
1 0.8 0.6 0.4 0.2 0
0 0.2 0.4 0.6 0.8 1 1.2 1.4
[image:57.612.67.475.103.379.2]Cr (VI) co n cen tratio n (mg/l)
Figure 2.1: Standard curve for Cr (VI) concentration using the DPC assay
2.2.2 Standard curve fo r Cr (VI) concentration in M9, N M S and nutrient broth no.2 media, lysozyme and tris-HCl solutions
2.2.2.1 Materials
2.2.2.2 Chromate assay
The same method described in section 2.2.1 was followed with slight modification, as follows: six test tubes were obtained and labelled (1, 2, 3, 4, 5 and 6). 5
ml of utilised media and 0.6 ml of 3 M H2SO4 were added to each tube. The amounts of
[image:58.612.70.469.211.319.2]K^C^O? and deionised water were added to each test tube according to Table 2.5:
Table 2.5: Amounts of K2C r2 0 7 and deionised H2O
Tube no. 1 2 3 4 5 6
K2C r207 (ml) 0 . 0 0 0.4 1 . 0 2 . 0 4.0 0 . 0
H 20 (ml) 4.4 4.0 3.4 2.4 0.4 0 . 0
•Standrad •Nutrient broth NMS M9 •Lysozyme •Tris-HCl
0.1 0.2 0.3 0.4
Cr (VI) concen tratio n (mg/l)
Figure 2.2: Standard curve for Cr (VI) concentration for several media
It was found that the absorbance in the diphenylcarbazide assay with increasing Cr (VI) concentration in nutrient broth no. 2 medium is far lower than that observed in other media and solutions. This was attributed to the reaction that took place between Cr (VI) and the nutrient broth no. 2 medium, which contains meat and casein peptone. Thus, nutrient broth no. 2 medium was excluded from use throughout the work.
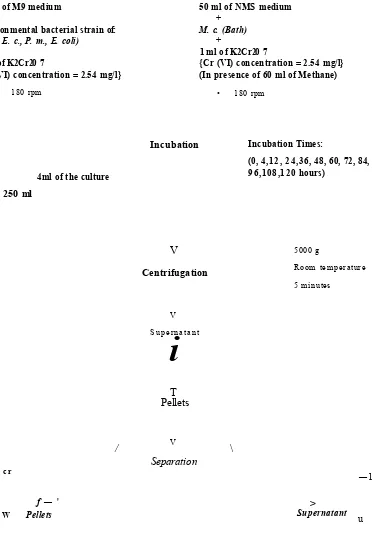
2.2.3 Laboratory-scale bioremediation reactions
50 ml of M9 medium
+
Environmental bacterial strain of:
(P. a., E. c., P. m., E. coli) +
1 ml of K2Cr20 7
{Cr (VI) concentration = 2.54 mg/l}
• 180 rpm
50 ml of NMS medium
+ M. c. (Bath)
+
1 ml of K2Cr20 7
{Cr (VI) concentration = 2.54 mg/l} (In presence of 60 ml of Methane)
• 180 rpm
4ml of the culture
250 ml
Incubation
V
Centrifugation
V S u p e rn a ta n t
i
T Pellets
Incubation Times:
(0, 4,12, 24,36, 48, 60, 72, 84, 96,108,120 hours)
5000 g
Room tem perature 5 m inutes
V
/ \
Separation
cr —1
f — ' >
[image:61.612.80.458.64.599.2]W