COPING WITH A CRISIS:
LESSONS FROM THE EVENTS OF A YEAR AGO
K Chatterjee and G Lyons
Transportation Research Group, University of Southampton
1. INTRODUCTION
For one week in September 2000 UK motorists were unable to buy petrol and were uncertain how long it would be before they could do so again. Journeys by car that would previously have been taken for granted were scrutinised and assessed in terms of their necessity and efficiency. With cars a central part of so many people’s lifestyles, it is not surprising that the public react with caution to transport policies that could restrict use of their cars. Opportunities to explore the response in practice of car users when use of their cars is compromised are rare. The fuel crisis presented such an opportunity on an unprecedented scale. The crisis was, in effect, a nationwide experiment in what happens when individuals are forced to confront their dependence on their cars and to consider different means of travel and alternative ways of going about their daily routines.
This paper describes how a car users’ questionnaire survey was undertaken at very short notice immediately after the fuel crisis. It explains how the questionnaire was designed to capture detailed effects of the fuel crisis on people’s travel behaviour. When this paper is presented at the European Transport Conference the results of the survey will be described and implications for policies aimed at reducing car use will be drawn out. At this time the analysis of the survey data is about to commence following a substantial undertaking to clean and pre-process the raw data. The paper provides an overview of the rationale behind the survey, the survey approach and some initial indications from the survey data.
2. BACKGROUND
The UK fuel tax protests were prompted by fuel tax protests in France. Road hauliers and farmers staged protests at UK oil refineries and fuel tanker drivers were persuaded to halt fuel deliveries to filling stations. The situation then quickly escalated as the general public began panic buying of vehicle fuel, spurred on by the media frenzy surrounding the events. Go slow protest convoys of vehicles also paralysed parts of the UK road network. As fuel stations ran dry large numbers of car using households faced a short term future with a finite fuel resource to support their personal motorised mobility.
falling crude oil prices and the announcement in the November 2000 budget of a three pence cut in petrol duty.
The fuel crisis raises a number of questions about transport policy. Are we over reliant on imported oil and what might be done to tackle this? What is the role of fuel taxation - to dampen excessive car use or generate public spending revenue? What interested us, however, was what could be learned from the fuel crisis about people’s dependence on their cars and what might this indicate for current and future initiatives aimed at reducing car use.
Increasing car use leads to congestion, delays, accidents, pollution, higher costs as well as reduced opportunities for those without access to a car. The need to develop more sustainable patterns of mobility, whilst not compromising economic prosperity and the choices available to individuals, continues to be a goal for policy-makers both in the UK and many other countries.
The 1995 RAC report on car dependence (RAC, 1995) states “at the time of first purchase, the car may be seen as a luxury. However, once bought, it encourages changes in behaviour and circumstances which in effect turn it into a necessity. Car dependence grows, rather than simply existing”. Nevertheless, it is suggested that about 20 per cent of car trips could easily be undertaken by other means. It would be useful to understand these trips better.
Behavioural adaptation is much greater in scope and scale than often assumed as a review of case studies of road capacity reduction has demonstrated (Cairns et al., 1998). This is evidenced by the large amount of ‘disappearing traffic’ that occurs in these situations. Journeys made by individuals change over time as changes occur in their lives (e.g. start a new job). This provides opportunities to intervene and secure changes in car use. It is suggested more needs to be known about how and when individuals are amenable to change (Fergusson et al., 1999). This is an area in which a study of travel behaviour during the fuel protest could prove informative.
Studies of travel behaviour taking an activity-centred approach have given an insight into people’s routines, household interactions and constraints, and the effects of these on travel (Bhat and Koppelman, 2000). Such studies usually have focussed on specific groups of the population or specific circumstances, and have rarely been able to examine what happens when a major intervention occurs. The fuel crisis survey provides the opportunity to shed light on the ways car users prioritise their activities/trips and rearrange them (in the short term).
3. CAR USER’S SURVEY
stated intentions are not always borne out by what they would do in practice. The fuel crisis provided a rare opportunity to ask the public what they did do rather than what they would do in the face of a distinct change in circumstance.
For many, the September 2000 fuel crisis was the first time that vehicle fuel had been unavailable even if they had the money to pay for it. In many cases people were forced to consider the use of their cars more closely than ever before in the face of, in effect, fuel rationing. The event offered a possibly unique opportunity to gain insights into what people actually do when their car use is restricted. Anecdotal evidence has been available in abundance of people changing their routines and trips. Journeys by car that had previously been taken for granted had been scrutinised and assessed in terms of their necessity and efficiency. A poll conducted by the Guardian/ICM found that 29 per cent of motorists ran so low on petrol during the crisis that they had to give up using their car (Travis, 2000).
As a research opportunity the fuel crisis occurred with no advance notice. Typically, several weeks would be needed to conduct a large scale survey from scratch. A research proposal would have to be prepared and submitted to, and assessed by, a funding body. With award of a contract, work would then proceed to confirm survey objectives and data requirements followed by selection and design of a suitable survey tool. This would be drafted and refined before being piloted and revised into a final version for use in implementing the survey. We faced a very different timescale. Late on Thursday in the fuel crisis ‘week’ (the week beginning Monday 11 September 2000) the Transportation Research Group (TRG) at the University of Southampton determined it would embark on the task of designing and conducting an emergency fuel crisis survey of car users. Seven days later 10,000 mailback questionnaires had been distributed, a duplicate web questionnaire had gone online and been promoted and a research proposal for the funds to do the work had been submitted to the Engineering and Physical Sciences Research Council. For the TRG the fuel crisis quickly turned into a research crisis.
The questionnaire survey sought to capture the impacts of the crisis on trip making and other aspects of people’s routines. It asked about usual travel behaviour and any changes that came about as a result of the fuel crisis. It specifically addressed commuting, business travel, journeys to school and grocery shopping. Respondents were invited to describe in their own words what changes they had made and why. This approach was considered preferable to providing respondents with predetermined tick box answer options. Whilst the latter would have proved vastly more manageable and straightforward in analysis terms it would have compromised the aim of capturing the full breadth of circumstance and types of change that were made.
surveyed which could be compared to those of the general population (captured by opinion polls).
Experiences of conducting emergency surveys are rare and yet they can prove a rich source of information and insight. Not long after the September 2000 fuel crisis, the UK fell victim to a rail crisis following the Hatfield crash. Here too was an opportunity to conduct an emergency survey and learn more about travel behaviour and the availability of travel alternatives and flexibility of people’s routines. The transport research community might be well placed to consider how to prepare contingency plans for such events in the future. In view of the unique nature of the fuel crisis survey and the conditions under which it was designed and implemented, the full questionnaire is included at the end of this paper. Readers will note the arguably excessive length of the questionnaire. A trade-off was faced between maximising survey response rate and capturing detailed information that fully reflected the circumstances and reactions of respondents. It was felt that the latter should be the principal consideration and that the risk of a poor response rate would be reduced by the personal interest of respondents in the topic of the survey and a wish to express and share their experiences and views. In hindsight this judgement has proved reasonably sound given the response rate achieved.
The questionnaire has seven sections:
Section 1 – asks for personal details, including age, sex, occupation, details of household members, type of car used and whether the car had much petrol at the start of fuel crisis week;
Sections 2-5 – applies to commuting, business travel, journeys to school and grocery shopping; asks for details of normal routine and changes made and asks whether consideration would be given to making such changes again in future;
Section 6 – asks if other changes had been made to trip making and normal routine, including any combining of trips and activities, any cancellations and postponements of trips and activities, any extra use of the phone or Internet and any seeking of public transport information; Section 7 – asks for views on eleven specific statements related to the fuel
crisis (e.g. ‘did the fuel crisis make you realise you use your car more than necessary’).
Some 5000 questionnaires were distributed in South Hampshire and South Wiltshire to petrol stations, schools and the general public in city/town centres. With the benefit of modern communications an electronic copy of the questionnaire was sent to local authority colleagues in other areas of the country (West Yorkshire, Hertfordshire, Leicester, London). They had agreed to take part in the challenge and printed and distributed a further 5000 or so questionnaires.
The paper based survey secured a response rate of approximately 17 per cent. Placing the questionnaire on the web secured another 700 responses. As far we are aware, the survey is the only one that attempted to capture in detail the impacts of the fuel crisis on travel behaviour. A key requirement of the survey was to obtain feedback from the public immediately after the crisis whilst events were still fresh in their minds.
The main focus of forthcoming analysis will be to determine the most common responses and to relate responses to people’s circumstances in order to provide some explanation as to why people behaved as they did.
After first entering the raw survey response information into data files, information from the open response questions was categorised so that it could be subject to further quantitative analyses. This was a major task. As mentioned earlier, using open ended questions allowed for flexibility in the respondents answering according to their situation but it yielded an enormous variety of responses. In categorising such information a compromise had to be made between capturing the variety of changes that occurred and obtaining meaningful insights into the most common changes. Other open response questions included the respondent’s occupation the answers for which have subsequently been classified using the Standard Occupational Classification (SOC2000) categories.
4. PRELMINARY FINDINGS
4.1 Sample Characteristics
The mailback sample of 1,688 respondents contained slightly more female respondents (831) than male respondents (822). 559 respondents described where they lived as a village. 547 said a town, 347 said a city suburb and 115 a city centre. More respondents lived in a household with two cars (717) than one car (688). Only 15 per cent of the respondents (who answered the question) did not have at least half a tank of fuel at the start of the fuel crisis week.
The characteristics of the sample will be examined carefully to see how representative the sample is of the general motoring population. There is the likelihood that those with strong opinions on the subject of the survey (at either extreme) will have been more likely to respond. A comparison will be made of quotas of certain characteristics among the sample and the overall motoring population and of the attitudinal responses of the sample compared to that of official opinion polls carried out during the fuel crisis.
4.2 Changes Made to Travel Behaviour
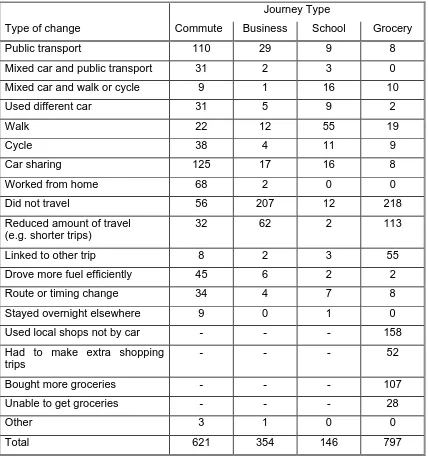
Table 2 shows that there were a large variety of responses made by car users in response to the shortage of fuel. This is a promising indication that there are alternative options available to car users in many circumstances. Table 2 shows that for commuter journeys changes to car sharing and public transport were the most common responses when a change was made. For business travel more than half of all changes involved not making a journey. Walking was the most common change for getting children to school. For grocery shopping common responses were to not shop and to use more local shops (with or without the car). This data is to now be analysed in detail relating the changes of behaviour to the circumstances of people making the changes.
4.3 Opinions Relating to the Fuel Crisis
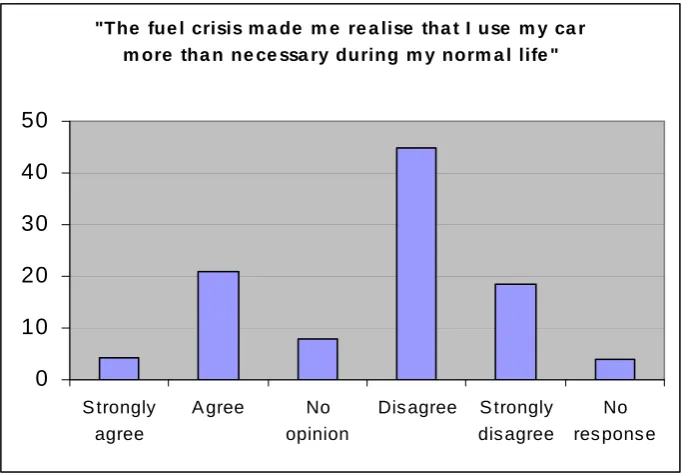
The opinions expressed by the respondents towards the fuel crisis provide further information on the sample characteristics and are of interest in their own right. Figures 1 and 2 present the responses to two such topics. 25 per cent may not seem to be a large proportion who have realised that they use their cars more than necessary but seeking to influence these people to modify their behaviour in future could make a substantial difference to transport networks. Figure 2 indicates that about a third of the respondents may be receptive to congestion charging. Of course it has to be remembered that the sample may be over represented by those with strong views in favour of restricting car use and in favour of not restricting car use.
4.4 Further Analysis
The analysis will explore correlations in the dataset and employ multivariate statistical techniques to relate differences in response to the fuel crisis to residential location, employment, household structure, vehicle ownership, opinions on the fuel protest and other variables. Selected individual responses to some questions will be analysed in more detail where the potential for greater insight into car dependence issues exists.
In interpreting the survey results it will be very important to distinguish, where possible, between short-term coping strategies and potential for sustained behaviour change in the longer term. Implications will be drawn on the extent to which car users are able and willing to reduce their use of the car and the circumstances where they have the greatest propensity to do so. The results will be compared to other information and statistics obtained during the fuel crisis from other sources.
5. WIDER LESSONS FROM FUEL CRISIS
6. ACKNOWLEDGEMENTS
We are very grateful to our colleague, Mark Beecroft, who organised the distribution of questionnaires in the Southampton area and grateful to other members of the Transportation Research Group who helped in this task. We thank the following individuals who distributed questionnaires in other parts of the country: Reg Harman (Independent Consultant), Andy Salkeld (Leicester City Council), Jeanette Sargent (West Yorkshire Passenger Transport Executive) and Mark Silverman (London Borough of Hillingdon). We give special thanks to the above but would also like to thank others who helped with distributing the questionnaires and publicising the survey.
7. REFERENCES
Bhat, C. R. and Koppelman, F. S. (2000) Activity-based travel demand analysis: history, results and future directions, Preprint of paper presented at 79th Annual Meeting of Transportation Research Board, Washington, D.C., 9-13 January.
Cairns, S., Hass Klau, C. and Goodwin, P. (1998) Traffic Impact of Highway Capacity Reductions. Assessment of Evidence, Landor Publishing, London.
Fergusson, M., Davis, A. and Skinner, I. (1999) Delivering changes in travel behaviour: lessons from health promotion, Institute for European Environmental Policy, London.
RAC (1995) Car Dependence, RAC Foundation for Motoring and the Environment, London.
Notes
1
Although the survey was a car user questionnaire, not all respondents travel by car for each of the journey types that is relevant to them. Table 2 only includes changes made by those who usually travel by car.
2
Table 1. Number of respondents who made any change to car use
Journey type No. of sample for which relevant (% of respondents)
No. who made any change to car use
(% of those for whom journey type relevant)
Commuter travel 1,246 (74%) 521 (42%)
Business travel 750 (44%) 335 (45%)
Journeys to school 517 (31%) 137 (26%)
[image:9.595.85.513.291.748.2]Grocery shopping 1544 (91%) 649 (42%)
Table 2. Type of changes made (number of respondents who made each change)
Journey Type
Type of change Commute Business School Grocery
Public transport 110 29 9 8
Mixed car and public transport 31 2 3 0
Mixed car and walk or cycle 9 1 16 10
Used different car 31 5 9 2
Walk 22 12 55 19
Cycle 38 4 11 9
Car sharing 125 17 16 8
Worked from home 68 2 0 0
Did not travel 56 207 12 218
Reduced amount of travel (e.g. shorter trips)
32 62 2 113
Linked to other trip 8 2 3 55
Drove more fuel efficiently 45 6 2 2
Route or timing change 34 4 7 8
Stayed overnight elsewhere 9 0 1 0
Used local shops not by car - - - 158
Had to make extra shopping trips
- - - 52
Bought more groceries - - - 107
Unable to get groceries - - - 28
Other 3 1 0 0
"The fue l crisis m a de m e re a lise tha t I use m y ca r m ore tha n ne ce ssa ry during m y norm a l life "
0 10 20 30 40 50
S trongly agree
A gree No
opinion
Dis agree S trongly dis agree
No res pons e
Fig. 1. Use my car more than necessary
"If fue l duty w a s to be re duce d, it w ould be fa ire r to cha rge for using roa ds a t tim e of he a vy tra ffic"
0 5 10 15 20 25 30 35
S trongly agree
A gree No
opinion
Dis agree S trongly dis agree
[image:10.595.127.468.74.312.2]No res pons e