Modelling based framework for the management of
emergency departments.
UTHUMANGE, Anura K.
Available from Sheffield Hallam University Research Archive (SHURA) at:
http://shura.shu.ac.uk/20828/
This document is the author deposited version. You are advised to consult the
publisher's version if you wish to cite from it.
Published version
UTHUMANGE, Anura K. (2009). Modelling based framework for the management of
emergency departments. Doctoral, Sheffield Hallam University (United Kingdom)..
Copyright and re-use policy
SHEFFIELD HALLAM UNIVERSITY LEARNING CENTRE COLLEGIATE CRESCENT
SHEFFIELD S10 2BP
1 0 1 96 3 66 6 1
ProQuest Number: 10702937
All rights reserved INFORMATION TO ALL USERS
The quality of this reproduction is dependent upon the quality of the copy submitted. In the unlikely event that the author did not send a com plete manuscript and there are missing pages, these will be noted. Also, if material had to be removed,
a note will indicate the deletion.
uest
ProQuest 10702937
Published by ProQuest LLC(2017). Copyright of the Dissertation is held by the Author. All rights reserved.
This work is protected against unauthorized copying under Title 17, United States C ode Microform Edition © ProQuest LLC.
ProQuest LLC.
789 East Eisenhower Parkway P.O. Box 1346
MODELLING BASED FRAMEWORK FOR THE
MANAGEMENT OF EMERGENCY
DEPARTMENTS
Uthumange Anura Kumara
A thesis submitted in partial fulfilment of the requirements of
Sheffield Hallam University
for the degree of Doctor of Philosophy
DECLARATION
This thesis is submitted in partial fulfilment of the requirements of Sheffield Hallam
University for the degree of Doctor of Philosophy. Except where acknowledgment and
reference is appropriately made, this work is, to the best of my knowledge, original and
has been carried out independently. No part of this thesis has been, or is currently being
submitted for any degree or diploma at this or any other University.
UTHUMANGE ANURA KUMARA
ACKNOWLEDGEMENT
I would like to express my deepest gratitude and appreciation to my supervisor Professor Terrence Perera for his guidance, constructive criticism and encouragement during the course of this study. I would also like to thank Dr David Clegg as the second supervisor of this research.
My appreciation and thanks also extends to Dr Derek Burke, Medical Director, Sheffield Children's Hospital and all the managers, consultants and officers in hospitals who participated in the data-collection process of this research.
I also wish to thank my colleagues, Osama, Mohamed, Julian, Sulaman, Rubi, Jane, Sivaprakash and the administrative staff of the Materials and Engineering Research Institute for their help and support.
ABSTRACT
In the twenty-first century, the healthcare industry faces ever-changing economic, social, political and technology challenges. Costs are rising, funding is diminishing, human and fiscal resources are becoming scarcer, customer-expectations are rising, the complexity of disease is increasing and technology is becoming more complex. These trends have a massive impact on every aspect of hospital operations and the Emergency Department is no exception. Overcrowding in the Emergency Department (ED) in hospitals has become a growing problem in many developed countries around the world. ED overcrowding has a direct effect on patient-care, including compromised patient-safety, increased length-of-stay, increased mortality and morbidity-rates and increased costs. Healthcare policy-makers and hospital and ED administrators are being forced to search for ways to improve the capacity o f EDs by better utilisation of existing resources and creating more efficient systems to overcome this problem.
Throughout the past few decades, there has been an increasing trend of using numerous systems-analysis tools and techniques which have come from manufacturing and other service industries to address the various issues in healthcare and EDs. Among those tools Discrete-Event Simulation (DES) is a powerful tool to improve the efficiency and capacity in dynamic and complex systems. Use of these tools to address the overcrowding problem in EDs has been patchy; specific aspects of issues have been studied but no attempt has been made to deploy DES or any other systems-analysis tool in a strategic and holistic manner.
ABBREVIATIONS
A&E: Accident & Emergency
AAP: American Academy of Pediatrics
ACEP: American College of Emergency Physicians
AHWAC: Australia Health Workforce Advisory Committee
BAEM: British Association for Emergency Medicine
BMA: British Medical Association
BSC: Balanced Score Cards
CAEP Canadian Association of Emergency Physicians
CDC: Centers for Disease Control
DES: Discrete-Event Simulation
DSS: Decision Support System
ED: Emergency Department
EDC: Emergency Department Crowding
EDs: Emergency Departments
ER: Emergency Room
EW: Emergency Ward
GAO: Government Accountability Office
GP: General Practitioner
JCAHO: Joint Commission on Accreditation of Healthcare Organizations
LOS: Length of Stay
NHS: National Health Service
SD: System Dynamics
TABLE OF CONTENTS
CHAPTER ONE
1. Introduction... 1
1.1 Background to the Research. ...1
1.2 Justification for the Research... ... 2
1.3 Aim and Objectives... ... ... 5
1.4 Outline of the Thesis... ... ...6
1.5 Summary... ... ......8
CHAPTER TWO 2. Literature Review...9
2.1 System-modelling...9
2.1.1 System... ... ... ... 9
2.1.2 Modelling... 10
2.1.3 Types of M odel... 11
2.2 Simulation-modelling... 14
2.2.1 Types of Simulation-model... 16
2.3 The Role of Simulation... 19
2.3.1 The Advantages o f Simulation ... 22
2.3.2 The Disadvantages of Simulation ... 23
2.4 Steps in a Simulation Study... 23
2.5 Simulation Software... 27
2.6 Simulation Applications...28
2.7 Simulation in Healthcare... 30
2.8 The Importance of Simulation in Emergency Departments... 35
2.9 Other Tools and Techniques ... 39
2.9.1 Queuing Theory... 39
2.9.2 System Dynamics... ...40
2.9.3 Balanced Scorecards... 41
2.9.4 The Lean and Six Sigma... 43
2.10 Modelling-based Frameworks in Healthcare... 45
2.11 Summary... 46
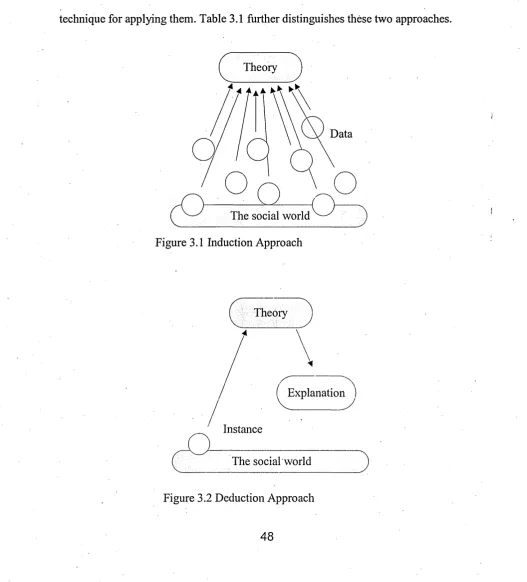
3.1 Research Approach... 47
3.2 Research Strategy... 50
3.2.1 Grounded Theory... 53
3.2.2 Case-study Analysis... ..54
3.2.3 Stakeholder Interviews... . 55
3.3 The Development of the Framework...57
3.4 Summary ... 57
CHAPTER FOUR 4. An Overview of the Emergency D epartm ent in H ospitals... 59
4.1 Emergency Department of Hospitals ... ...59
4.1.1 Areas and functions of ED... 61
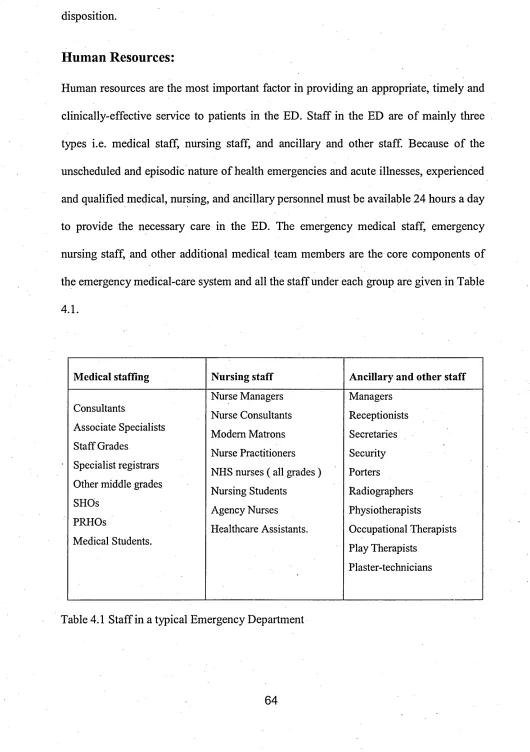
4.1.2 Resources in E D s... 63
4.1.3 ED Processes... 65
4.2 Emergency Departments in the U K ... 68
4.3 The ED in Sheffield Children’s Hospital... 71
4.4 Summary...76
CHAPTER FIVE 5. The Overcrowding Problem in Emergency D epartm ents... 77
5.1 Definitions of Overcrowding ... ...77
5.2 The Consequences of Overcrowding... 79
5.3 The Causes of Crowding ... 85
5.3.1 Demand for ED Care... 88
5.3.2 Inefficient ED Process and Policies ... 89
5.3.3 Shortage of Staff... 90
5.3.4 Insufficient Facilities, Resources and Technology ...92
5.3.5 Factors beyond the ED and Hospital... 94
5.4 Solutions for ED Overcrowding... 99
5.5 Summary ... 101
CHAPTER SIX 6. The Development of a Decisions-framework for Emergency D epartm ents 102 6.1 The Classification of Decisions in ED ... 102
6.1.1 The Level of the Decisions ... 102
6.1.2 The Category of Decisions... ...103
6.2 The Decisions-framework for the E D ... :...104
6.3 Strategic-level (Long-term) Decisions...110
6.3.1 Introducing New Policies or Changes... 110
6.3.2 Planning and Recruiting the Workforce... 112
6.3.3 Planning Facilities and Technology... ... 114
6.4 Tactical Level (Medium-Term) Decisions... 115
6.4.1 Improving the ED Process... 115
6.4.2 Scheduling Staff ... 116
6.4.3 Allocating Resources and Equipments ...117
6.5 Operational Level (Short-Term) Decisions... .117
6.5.1 Managing Patient-flows ... 117
6.5.2 Scheduling Patients for Doctors... 119
6.5.3 Scheduling Patients for Shared Resources ...120
6.6 Validation of the Decisions-framework... 120
6.7 Summary... 121
CHAPTER SEVEN 7. The Identification of Possible Tools for the Strategic Level Decisions in ED ...122
7.1 Introducing New Policy or Changes... 122
7.1.1 Discrete-event Simulation... 122
7.1.2 System Dynamics... 126
7.1.3 Balanced Scorecards ... 129
7.2 Planning and Recruiting the Workforce...131
7.2.1 Discrete-event Simulation... 131
7.2.2 Queuing Theory... 133
7.3 Planning Facilities and Technology... 133
7.3.1 Discrete-event Simulation... 134
7.3.2 Queuing Theory... 138
7.4 Summary...,... 139
CHAPTER EIGHT 8. The Identification of Possible Tools for the Tactical Level Decisions in E D 141 8.1 Improving the ED Process... 141
8.1.1 Discrete-event Simulation... 141
8.1.2 System Dynamics... 145
8.1.3 Lean and Six Sigm a ... 147
8.2.1 Discrete-event Simulation... 150
8.2.2 Queuing Theory... 152
8.3 Allocating Resources and Equipment...153
8.3.1 Discrete-event Simulation... 153
8.3.2 Queuing Theory... 155
8.4 Summary... 156
CHAPTER NINE 9. The Identification of Possible Tools for the O perational Level Decisions in ED ... :... 158
9.1 Managing Patient-flows... 158
9.1.1 Discrete-event Simulation... 159
9.1.2 Queuing Theory... 160
9.2 Scheduling Patients for Doctors... 161
9.2.1 Discrete-event Simulation... ;...161
9.2.2 Queuing Theory ... ...163
9.3 Scheduling Patients for Shared Resources... 164
9.3.1 Discrete-event Simulation ... 164
9.3.2 Queuing Theory ... 165
9.4 Summary... 166
CHAPTER TEN 10. Conclusion... 168
10.1 Conclusions... 168'
10.2 Contribution to Knowledge... ... ... 173
10.3 Future W ork...175
REFERENCES... 176
APPENDIX 1 Required Resources for E D s... 1-6
APPENDIX 2 Paired T-test to compare the hourly patient-arrivals between the days of the week... 1-2 APPENDIX 3 Paired T-test to compare the daily patient-arrivals between the
months of the y ear... 1-3
APPENDIX 4 Introduction to IDEF0... 1-3
APPENDIX 5 The schedule for the validation of the decisions-framework 1-2
LIST OF TABLES
Table 2.1 Use of Simulation in Healthcare in 1999-2004... 33
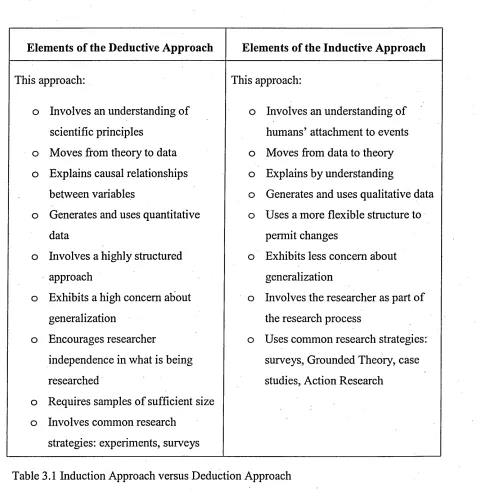
Table 3.1 Induction Approach versus Deduction Approach... 49
Table 4.1 Staff in a typical Emergency Department. ... 64
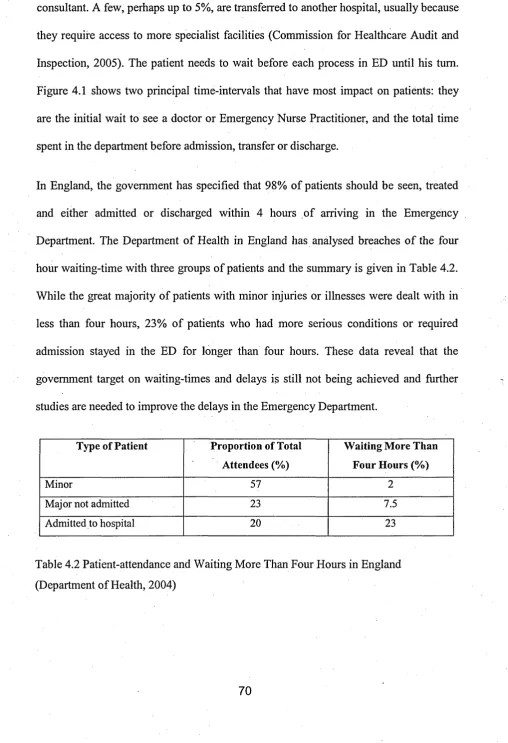
Table 4.2 Patient-attendance and waiting more than four hours in England.... 70
Table 4.3 Patient-arrivals by Triage-category (2005)... 74
Table 5.1 The consequences of crowding in ED and references... 84
Table 5.2 Reasons for not reaching the four hour waiting target in the U K ... 87
Table 5.3 Summary of the Causes of ED Overcrowding and References 96
Table 7.1 Matrix of the Strategic Level Decisions in ED and Possible Tools... 139
Table 8.1 Matrix of the Tactical Level Decisions in ED and Possible Tools 156
Table 9.1 Matrix of the Operational Level Decisions in ED and Possible
Tools... 166
LIST OF FIGURES
Figure 2.1 Types o f System Model... ... 13
Figure 2.2 Schematic of a Simulation Stud... 16
Figure 2.3 Simulation Taxonomy... 18
Figure 2.4 Steps in Simulation Projects ... 25
Figure 3.1 Deduction Approach... 48
Figure 3.2 Induction Approach... 48
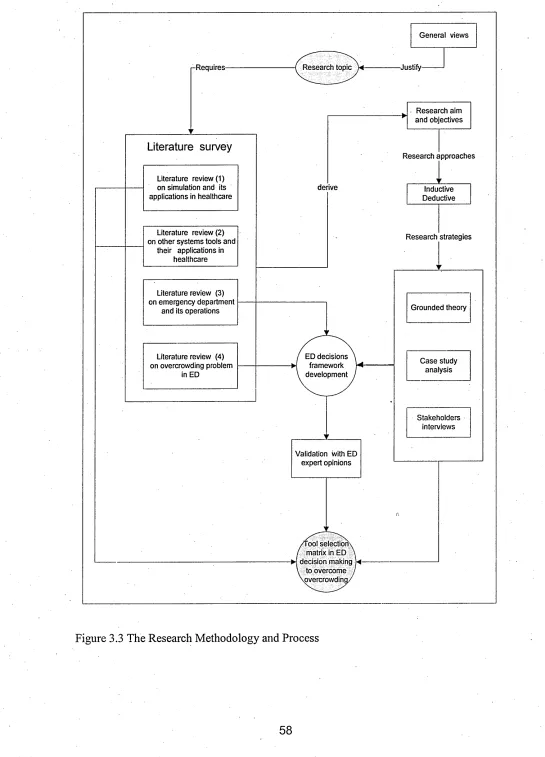
Figure 3.3 The Research Methodology and Process... 58
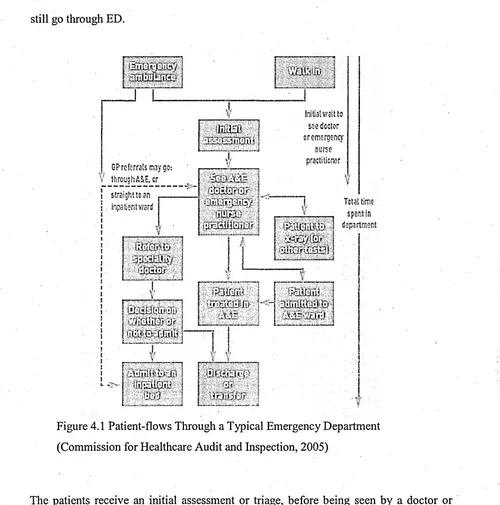
Figure 4.1 Patient-flows Through a Typical Emergency Department. ... 69
Figure 4.2 Annual Attendance at Sheffield Children’s Hospital (2000-2005)... 72
Figure 4.3 Hourly Patient-arrivals on the Days of the Week in 2005... 73
Figure 4.4 Patients Process Flow in the Emergency Department... 75
Figure 5.1 Trends in EDs in the United States, 1994-2004... 89
Figure 5.2 Causes of ED Overcrowding... 98
Figure 6.1 Decision-Levels in the Emergency Department... 105
Figure 6.2 Policy and Process Decisions in the Emergency Department... 106
Figure 6.3 Personnel Decisions in the Emergency Department... 107
Figure 6.4 Facility, Resources & Technology Decisions in the ED . ... 108
Figure 6.5 Decisions-framework for Emergency Department... 110
CHAPTER ONE
1. Introduction
1.1 Background to the Research
Emergency Departments (EDs) in hospitals assess and treat people with serious injuries
and those in need of emergency treatment. Acute illnesses and traumatic injuries happen
at any time. Therefore, EDs are usually open 24 hours a day, 365 days of the year. Often
an ED is the only source of emergency medical care. Unfortunately, overcrowding and
increasing delays in many emergency departments has been recognised as a growing
problem around the world (Kollek and Walker, 2002; Graff, 1999; Schafermeyer and
Brent 2003; McManus, 2001; Derlet et.al., 2001; McCaig and Burt, 2004; Cowan and
Trzeciak, 2005). This problem has been recognized since the early 1990s (Andrulis et
al., 1991).
Over the last two decades, hospitals have been struggling to manage this overcrowding
problem with scarce resources and an increase in patient-demand. According to the
Lewin Group (2002), 62% of all hospital EDs and more than 90% o f large hospitals
EDs in the United States are operating "at" or "over" capacity. A 2001 survey o f ED
medical directors in the state of Washington also revealed that 100% of large hospitals
and 91% of small hospitals were reporting overcrowding problems (ACEP, 2002). This
problem is not limited to the United States, and overcrowding and long delays in EDs
have been cited as acute and growing in other countries as well (Fatovich, 2002).
Bradley (2005) also shows that overcrowding and long stays have been reported in the
United States, United Kingdom, Australia, Canada, and Spain, demonstrating that this
to be admitted to hospital have increased steadily since 1996. EDs in many developed
countries face similar difficulties in terms of long waiting-times, staff-resourcing
problems, and capacity limitations (Brailsford et ah, 2003).
The potential dangers of ED overcrowding have recently garnered national attention in
the United States. ED overcrowding threatens patient safety and public health in the US
and numerous stories cited in the lay-press have reported an unsafe environment in EDs
because of overcrowding (Trzeciak and Rivers, 2003). ED overcrowding has a direct
effect on patient-care, including compromised patient safety, increased costs, increased
length of stay, and increased mortality and morbidity-rates. The overcrowding
represents a challenge for hospital employees and clients, often leading to frustration
and dissatisfaction as well.
As a result of these problems, hospital administrators and other healthcare policy
makers are being forced to search for ways to improve the capacity of EDs by better
utilisation of existing resources and creating more efficient systems. The crisis-level
overcrowding problem has led to increased interest in analytical methods that allow ED
activity to be studied at a system level (Connelly and Bair 2004). Unlike most other
industries, hospital administrators cannot directly control demand. Their ability to
manage their facilities depends on their effectiveness in utilizing scarce resources.
Therefore, this crisis in EDs has compelled researchers and healthcare professionals to
examine new ways to improve efficiency and reduce the overcrowding problem.
1.2 Justification for the Research
Over the past few decades, numerous systems-analysis tools and techniques from
manufacturing and service industries have been approached to healthcare. These
Thinking, Six Sigma, Theory of Cpnstraints, Supply-chain Management and Balanced
Scorecards. Among them Discrete-Event Simulation (DES) is a powerful and successful
tool used in many products and service industries (Law and Kelton ,1991).
Most systems-analysis tools are generally used to analyze existing systems for
improvement. Mathematical analyses of system-operations include Queuing Theory,
which could be used, for example, to understand the flow of patients through a system,
the average time patients spend in the system or bottlenecks in the system. When
complex changes and multiple implementations are made, the results are often
impossible to predict accurately using most systems-analysis tools and conventional
tools such as spreadsheets and flowcharts. This makes consensus on ideas for
improvements difficult to attain. Simulations can be used as tools that enable EDs to
conduct accurate and objective predictive analyses of the effects of process-
improvements, facilities-changes, and new designs prior to implementation.
Discrete-event Simulation is an operational research technique that allows the end-user
to assess the efficiency of existing delivery-systems, to ask 'what if?' questions, and to
design new systems. DES can also be used to forecast the impact o f changes in flows, to
examine resource-needs or to investigate the complex relationships among the different
model-variables (Jun 1999). DES helps to predict the outcome of decisions, to visualize,
analyse, and optimize before committing capital and resources (Poliak et al., 2004).
Simulation is more effective than analytical solutions for complex models, where the
state of the system changes over time (Law and Kelton, 1991). Emergency Departments
are considered one of the most complex systems to analyze. Rakich et al., (1991) state
that simulation can assist hospital management to develop and enhance their decision
Throughout the nearly three decades, there is an increasing trend of using computer-
simulation to address the various problems in healthcare and Emergency Departments
including the long-waiting-time problem. In recent years, the application of Discrete-
event Simulation in healthcare has become increasingly wide-spread covering almost all
areas such as Emergency Departments, operating-theatres, clinics, outpatient and
inpatient wards, ancillaries, and pharmacies. (Jun, 1999; Fone et al., 2003). But the
application of simulation-modelling in the healthcare sector is not wide-spread when
compared to other sectors such as the military, manufacturing and logistics sectors,
despite the fact that simulation has been successfully used in these other sectors for
some three decades (Baldwin et al., 2004). Efforts to develop computer-simulation of
ED operations have been advancing since the late 1980s when Saunders et al. (1989)
simulated a generalized ED. Since that time DES models have been used to study a
wide range of factors such as the effect of changes in staffing-levels, the consequences
of ED closures, and variables influencing patient-throughput (Lloyd and Aaron, 2004).
Several studies have attempted to analysis the patient-flows to reduce the waiting-time
and throughput-time at various stages in the Emergency Departments (Garcia et al.,
1995; Mahapatra et al., 2003; McGuirel994; Samaha, Armel, and Starks, 2003). In
addition, Emergency Department staff-scheduling also has been addressed (Centeno et
al., 2003). Most simulation studies in Emergency Departments and healthcare are aimed
to address specific problems in particular healthcare facilities. The commonalities in
these studies are their objectives of improving performance such as reducing waiting-
times or using resources more efficiently. Because they are specific, these studies guide
a modeller as to how a specific problem can be solved (Giinal and Pidd, 2007).
Even though overcrowding in EDs has been a serious problem for nearly two decades,
simulation or other modelling tools. Use o f simulation tools to address the issues in
EDs has been patchy; specific aspects of issues have been studied using simulation but
no attempt has been made to deploy simulation in a strategic manner. To make
simulation a mainstream management-support-tool within Emergency Departments and
to make a real impact, a more strategic and systematic approach is required to deploy
and use simulation technologies. Therefore, it is important to identify the possibility of
successfully using simulation and other alternative tools to address the overcrowding
problem and develop a modelling-based decision-support infrastructure for the
Emergency Department.
1.3 Aim and Objectives
Aim
The aim of this research is to develop a modelling-based framework to manage the
overcrowding problem in Emergency Departments in hospitals.
To achieve this aim, the following objectives are set in this research.
Objectives
1. To investigate the current practices and applications o f simulation in the
healthcare and emergency-care.
2. To study the Emergency Department system and its operations.
3. To investigate the Emergency Department overcrowding problem and identify
the causes of overcrowding.
4. To develop a holistic-level ED decisions framework that can be used to address
the overcrowding problem in Emergency Departments.
1.4 Outline of the Thesis
This thesis consists ten chapters. Each chapter starts with an introduction which briefly
explains the contents of the chapter, and ends with a summary drawing conclusions
from the chapter. The contents of each chapter are outlined as follows.
Chapter 1: Introduction
This chapter gives an overview of the research and explains the background, the
justification for the research problem, and the aims and objectives o f the research as
well as outlining the contents of the thesis.
Chapter 2: Literature Review
This presents the concept of modelling and simulation in the context of the present
research. It also discusses the current simulation practices and applications in healthcare
and emergency-care, and the importance of simulation in the emergency department.
Finally it gives a brief introduction about the other alternative tools and techniques that
could be used in ED decision-making.
Chapter 3: Research Methodology
This chapter describes the research methodology adopted in this research. It justifies the
research approaches, research strategies as well as the research type and methods used
to achieve the multiple objectives of this research.
Chapter 4: An Overview of the Emergency Department in Hospitals
Chapter Four attempts to give an overview picture of the Emergency Department
system and its operations. First it gives a general introduction about emergency-care
and Emergency Departments including the ED function, resources and processes. Then
it attempts to explore Emergency Departments in England.
Chapter 5: The Overcrowding Problem in Emergency Departments
This chapter discusses the overcrowding problem within the context of this research,
based on the literature and the findings of the interviews with ED managers in England.
It includes definitions o f overcrowding, and its consequences and causes as well as the
remedies which have been taken to overcome it. Finally, it presents the causes of
overcrowding in a Fish-bone Diagram.
Chapter 6: The Development of a Decisions-framework for Emergency
Departments
This chapter develops a decisions-frame which can be used to address the overcrowding
problem in Emergency Departments. This ED decisions-frame includes nine decisions
covering long-term, medium-term and short-term decisions in ED. All these decisions
are selected based on the causes of overcrowding found in Chapter 5. It also discusses
each of the decisions in detail, including the outcomes of the decisions.
Chapter 7: The Identification of Possible Tools for the Strategic Level Decisions in
ED
This chapter analyses the possibility o f using Discrete-event Simulation and other
alternative tools and techniques in the long-term decisions in the framework explained
in Chapter 6. The analysis and discussion is conducted under three strategic-level
decision-headings: Introducing New Policy or Changes; Planning and Recruiting
Workforce; and Planning Facilities and Technology.
Chapter 8: The Identification of Possible Tools for the Tactical Level Decisions in
ED
described in Chapter 6. The analysis and discussion is conducted under three tactical-
level decision-headings: Improving the ED Process, Scheduling Staff, and Allocating o f
Resources and Equipment.
Chapter 9: The Identification of Possible Tools for the Operational Level
Decisions in ED
This chapter analyses the possibility of using Discrete-event Simulation and other
alternative tools and techniques in the short-term decisions using the framework
described in Chapter 6. The analysis and discussion is conducted under three
operational-level decision-headings: Managing Patient-flows; Scheduling Patients for
Doctors; and Scheduling Patients for Shared Resources.
Chapter 10: Conclusion
This is the last chapter in this thesis. This chapter presents the conclusions of the
research, contribution to knowledge and the future work which is necessary.
1.5 Summary
This chapter presented the introduction to the research. It included the background of
the research, and the justification for the research as well as its aims and objectives. It
also included an outline of the thesis. A comprehensive survey of the literature on
relevant concepts is presented in the following chapter of the research.
CHAPTER TWO
2. Literature Review
This chapter mainly presents the concept of modelling and simulation in the context of
the present research. It also discusses the current simulation practices and application in
healthcare and emergency departments and the importance of simulation in the
emergency departments. Finally, it gives a brief description about the non-simulation
tools and techniques that can be used in ED decision-making other than the simulation
and their applications in healthcare.
2.1 System-modelling
The term system-modelling includes two important commonly-used concepts: system
and modelling. It is imperative to clarify such concepts before attempting to focus on
their relevance to this research. Hence, this section introduces these two concepts and
provides generic classification of the various types of system-models..
2.1.1 System
The word system is commonly used in its broad meaning in a variety of engineering and
non-engineering fields. In simple words, a system is often referred to as a set of
elements or operations that are organized and logically related toward the attainment of
a certain goal or objective. A system is defined to be a collection o f entities, e.g., people
or machines that act and interact together toward the accomplishment of some logical
end (Schmidt and Taylor, 1970). Banks (1984) also describes a system as a group of
objects that join together in some regular interaction or inter-dependence toward the
correctly, and to produce the required outcomes. To sustain such flow, some control is
required to govern system-behaviour.
Systems are of two types: the product system and the process system. A product system
could be an automobile, a cellular phone, a computer, or a calculator. Any of these
products involves the components o f the system described above in terms o f inputs,
outputs, elements, relationships, controls, and goal. On the other hand, a process system
can be a manufacturing process, an assembly line, a power plant, a business process
such as banking operations, a logistic system, an educational system or emergency
system. Similarly, any of these processes involves the system components defined in
terms of inputs, outputs, elements, relationships, controls, and goal.
2.1.2 Modelling
Banks et al., 2000 defined a model as a representation of a system for the purpose of
studying the system. The word modelling refers to the process of representing a system
(a product or a process) with a model that is easier to understand than the actual model
and less expensive to build (El-Haik and Al-Aomar,2006). The system-representation
in the model implies taking into account the components of the system. This includes
representing the system’s elements, relationships, goal, inputs, controls, and outputs.
Modelling a system therefore has two prerequisites:
• Understanding the structure of the actual (real-world) system and the
functionality and characteristics of each system-component and relationship. It
is imperative to be familiar with a system before attempting to model it and to
understand its purpose and functionality before attempting to establish a useful
representation of its behaviour. For example, the modeller needs to be familiar
with the production-system of building vehicles before attempting to model a
vehicle body-shape or a vehicle-assembly operation. Similarly, the modeller
needs to be familiar with ED functionality and structure before attempting to
model an emergency department.
• Being familiar with different modelling and system representation techniques
and methods. This skill is essential to choose the appropriate modelling
technique for representing the underlying real-world system. Due to budgetary
and time constraints, the model selected should be practically and economically
feasible as well as beneficial in meeting the ultimate goal of modelling. There
are several model types as describe in following sub chapter that can be used to
create a system model, and selection of the most feasible modelling method is a
decision based on economy, attainability, and usefulness.
The modelling of a system of interest is a combination of art and science that is used for
abstracting a real-world system into a hypothetical model. The model should be clear,
comprehensive, and accurate so that the user can rely on its representation in
understanding system functionality, analyzing its various postures, and predicting its
future behaviour. From this perspective, system-modelling is the process o f transferring
the actual system into a model that can be used to replace the actual one for system
analysis and system improvement.
2.1.3 Types of Model
El-Haik and Al-Aomar (2006) classify the system-modelling into four major categories:
physical models, graphical models, mathematical models, and computer models. It is
depicted in Figure 2.1 and the following gives a summary of each type of models.
reality direct representation of the actual system and can be used to demonstrate the
system’s structure, the role of each system-element, and the actual functionality of the
system in a physical manner (El-Haik and Al-Aomar, 2006; Law 2000).
Graphical models are abstractions of actual products or processes using graphical tools.
Common system graphical representations include a system-layout, flow-diagrams,
block-diagrams, network-diagrams, process-maps, and operations-charts (El-Haik and
Al-Aomar, 2006).
Mathematical modelling is the process of representing system behaviour with formulas
or mathematical equations. They use mathematical equations, probabilistic models, and
statistical methods to represent the fundamental relationships among system
components. Design formulas for stress-strain analyses and mathematical programming
models such as linear and goal programming are examples of mathematical models.
Other examples include queuing-models, Markov chains, linear and nonlinear
regression models, break-even analysis, forecasting models, and economic-order
quantity models. Unfortunately, not all system responses can be modelled using math
ematical formulas. The complexity of most real-world systems precludes the application
of such models. Hence, a set of simplification assumptions must often accompany the
application of mathematical models for the formulas to hold. Such assumptions often
lead to impractical results that limit the chance of implementing or even, in some cases,
considering such results (El-Haik and Al-Aomar, 2006; Law 2000).
Mathematical Models Graphical
Models Physical
Models ComputerModels
System Models
Figure 2.1 Types of System Models (El-Haik and Al-Aomar, 2006)
Computer models are numerical, graphical, and logical representations of a system that
utilizes the capability of a computer in fast computations, with a large capacity,
consistency, animation, and accuracy (El-Haik and Al-Aomar, 2006). Computer
simulation models, which represent the middleware of modelling, are virtual
representations of real-world products and processes on the computer. Computer
simulations of products and processes are developed using different application
programs and software tools. Accurate and well- built computer models compensate for
the limitations of the other types of models. They are built using software tools, which
is easier, faster, and cheaper than building physical models. In addition, the flexibility of
computer models allows for quick changes, easy testing of what-ifs, and quick
evaluation o f system-performance for experimental design and optimization studies.
Computer models also provide the benefits of graphical models with modem animation
and logical presentation tools. Indeed, most computer models are built using graphical
modelling tools. Compared to mathematical models, computer models are much more
realistic and efficient. They utilize computer capabilities for more accurate
approximations, they mn complicated computations in little time, and they can measure
system performance without the need for a closed-form definition of the system
objective function. Such capabilities made computer models the most common
A Discrete Event Simulation (DES) model is a computer model that mimics the
dynamic behaviour o f a real process as it evolves over time in order to visualize and
quantitatively analyze its performance. The validated and verified model is then used to
study the behaviour o f the original process and then identify the ways for its
improvement (scenarios) based on some improvement criteria. This type of computer
model is the major focus in this research, where discrete event simulation is used as the
main modelling tool to improve the efficiency in the emergency department of a
hospital.
2.2 Simulation-modelling
This section focuses on defining the simulation concept and the taxonomy o f
various types o f simulation-models. Simulation is a widely used term in reference to
computer simulation models that represent a product or a process. The word simulation
throughout this research also means computer simulation models. Such models are built
based on both mathematical and logical relationships within the system structure. For
example, finite element analysis is the mathematical basis for a camshaft product
simulation model, and the operation of a factory is the logical design basis for a plant
process model. In the context of this research, there are a number of definitions for
simulation in the literature.
Simulation, according to Shannon (1975), is “the process o f designing a model o f a real
system and conducting experiments with this model fo r the purpose either o f
understanding the behaviour o f the system or o f evaluating various strategies (within
the limits imposed by a criterion or set o f criteria) fo r the operation o f the system. ”
A definition for simulation is given by Kelton et al., (1998): “Simulation refers to a
broad collection o f methods and applications which mimic the behaviour o f real
systems, usually on a computer with appropriate software
In one of the most quoted definitions of simulation, Banks (1998) defines it as "the
imitation o f the operation o f a real-world process or system over time. Simulation involves
the generation o f an artificial history o f the system, and the observation o f that artificial
history to draw inferences concerning the operating characteristics o f the real system that
is represented".
In general, system-simulation or simulation-modelling is the mimicking o f the activity
of the operation of a real system, in a computer, with a focus on process flow, logic, and
dynamics. According to Pegden, Shannon, and Sadowski (1995), simulation-modelling
is a methodology that enables the building of a model to study the temporal behaviour
of a system and to evaluate different alternatives for its operation. In simplest form,
simulation means making a simplified representation of an original. Just as a model
aircraft captures many of the important physical features of a real aircraft, so a
simulation model captures the important operational features o f a real system.
Therefore, instead of attempting to build extensive mathematical models by experts,
simulation software tools have made it possible to model and analyze the operation of a
real system by not only programmers, but also engineers and managers. This allows
engineers to collect pertinent information about the behaviour of the system by
executing a computerized model instead of observing the real one.
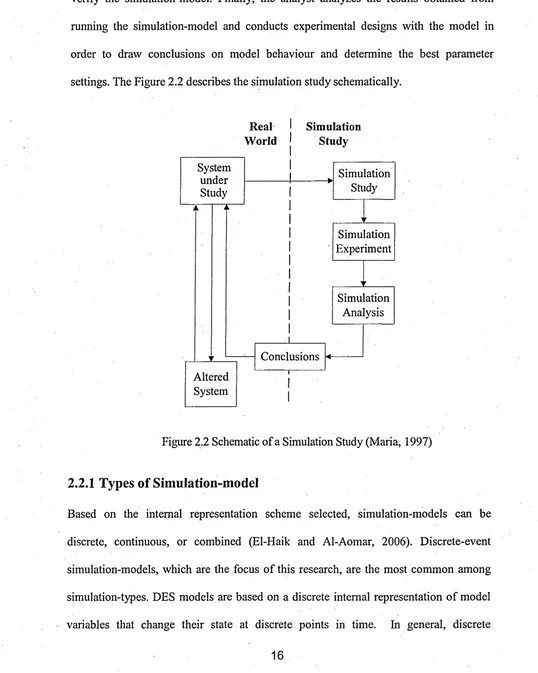
In conclusion, the primary requirements for simulation are a simulation analyst, a
computer, and a simulation language or software tool. The analyst is the key player in
real-world system and analyzing its elements, logic, inputs, outputs, and goals. The analyst
then operates the computer system and uses the software tool to build, validate, and
verify the simulation-model. Finally, the analyst analyzes the results obtained from
running the simulation-model and conducts experimental designs with the model in
order to draw conclusions on model behaviour and determine the best parameter
settings. The Figure 2.2 describes the simulation study schematically.
Real
W orld SimulationStudy
Conclusions
Simulation Study
Simulation Analysis Simulation Experiment
Altered System System
[image:30.615.23.561.87.760.2]under Study
Figure 2.2 Schematic of a Simulation Study (Maria, 1997)
2.2.1 Types of Simulation-model
Based on the internal representation scheme selected, simulation-models can be
discrete, continuous, or combined (El-Haik and Al-Aomar, 2006). Discrete-event
simulation-models, which are the focus of this research, are the most common among
simulation-types. DES models are based on a discrete internal representation of model
variables that change their state at discrete points in time. In general, discrete
simulation-models focus on modelling discrete variables that are presented by random
or probabilistic models, where the state of the system changes at discrete points in time.
A discrete variable can be the number of customers in a bank, products and components
in an assembly process, or cars in a drive-through restaurant.
Continuous simulation-models, on the other hand, focus on continuous variables,
random or probabilistic, where the state of the system changes continuously. Examples
of continuous variables include the level of water behind a dam, chemical processes in a
petroleum refinery, and the flow of fluids in distribution-pipes. Combined simulation-
models include both discrete and continuous elements. For example, separate (discrete)
fluid containers travel in a chemical process where fluids are poured into a reservoir to
be processed in a continuous manner (El-Haik and Al-Aomar 2006, Law 2000).
Furthermore, models are either deterministic or stochastic depending on whether they
model randomness and uncertainty in a process or not. A stochastic process is a
probabilistic model of a system that evolves randomly in time and space. Examples of
stochastic models operating with random variables include inter-arrival times of
customers arriving at a bank and service or processing times o f customers’ requests or
transactions, variable cycle times, and machines' time to failure and time to repair
parameters. Deterministic models, on the other hand, involve no random or probabilistic
variables in their processes. Examples include modelling fixed-cycle-time operations,
such as in the case of automated systems and arrivals with preset appointments to a
doctor. The majority of real-world operations are probabilistic. Hence most simulation
studies involve random generation and sampling from certain probability distributions
Finally, and based on the nature o f model evolution with time, models can be static or
dynamic. In static models the system state does not change overtime. For example, when
a certain resource is always available in a manufacturing process, the state of such a resource
is fixed with time. Every time this resource is required or needed, there will be no
expected change in its status. Monte Carlo simulation-models are time-independent
(static) models that deal with a system of fixed states. Most operational models are,
however, dynamic. System state variables often change with time, and the interactions that
result from such dynamic changes do affect the system behaviour. Hence, in DES
simulation, the time dimension is live. This again makes DES models the most common
among simulation types since they model variables that change their state at discrete
points in time.
Simulation
Discrete Models
Dynamic Models Continuous Models
Stochastic Models
Static Models Deterministic Models
Terminating Models
Combined Models
[image:32.615.27.567.246.780.2]Non-terminating Models
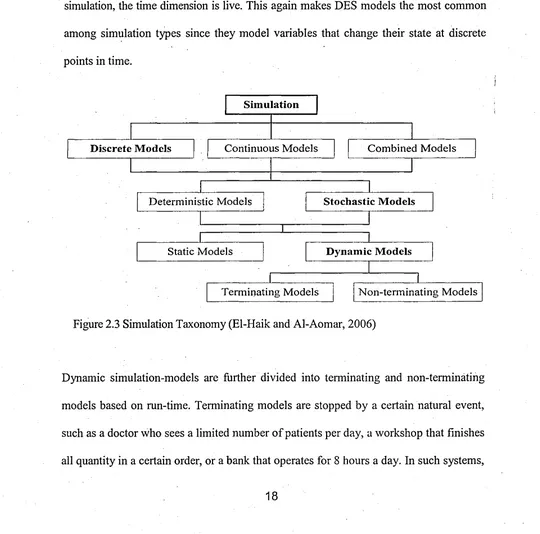
Figure 2.3 Simulation Taxonomy (El-Haik and Al-Aomar, 2006)
Dynamic simulation-models are further divided into terminating and non-terminating
models based on run-time. Terminating models are stopped by a certain natural event,
such as a doctor who sees a limited number of patients per day, a workshop that finishes
all quantity in a certain order, or a bank that operates for 8 hours a day. In such systems,
the length of a simulation-run depends on the number of items processed, or on reaching
a specified time-period, with the model terminating upon completion. Models that run
for a specified period often include initial conditions such as cleaning the system, filling
bank ATMs, resetting computers in a government office, or emptying boxes on an
assembly line. Non-terminating models, on the other hand, can run continuously, since
the impact of initialization is negligible over the long run and no natural event has been
specified to stop them. Most plants run on a continuous mode, where production lines
start every shift without emptying the system (El-Haik and Al-Aomar 2006, Law 2000).
As noted with highlighted attributes in the figure 2.3, DES models are discrete,
stochastic, and dynamic computer-models of terminating or non-terminating response.
These three characteristics often resemble the actual behaviour of many real-world
systems and transactional processes. For example, in manufacturing systems, the flow of
raw material, assembly components, and products can be modelled as discrete, dynamic, and
stochastic processes. Many service-facilities including emergency departments also often
deal with discrete entities that run dynamically in a stochastic manner.
2.3 The Role of Simulation
Simulation is one of the most widely-used analytical techniques adopted by
professionals in Operations Research and Management Science (Law and Kelton,
1991). It has unique and powerful capabilities in system-representation and performance
estimation and improvement. Simulation is often the analysts’ refuge when other
solution tools, such as mathematical models, fail or it becomes extremely difficult to
approximate the solution to a certain problem. Most real-world processes in production
and business systems are complex, stochastic, and highly non-linear and dynamic, which
Analytical methods, such as queuing-systems, inventory models, and Markovian
models, which are commonly used to analyze production and business systems, often
fail to provide statistics on system-performance when real-world conditions intensify to
overwhelm and exceed the system-approximating assumptions. Examples include
entities whose arrival at service is not a Poisson process, and where the flow of entities
is based on complex decision-rules under stochastic variability within availability of
system-resources. Simulation-models are much more flexible and versatile. They are
free from assumptions of the particular type of the arrival-process (Poisson or not), as
well as the service-time (exponential or not). Simulation can be used for the combined
random and non-random arrival-flow as well. The system-structure (flow-map) can be
complex enough to reflect a real-system structure, and custom action logic can be built
in to capture the real-system behaviour. Therefore, simulation is often used to model the
complex, stochastic, and dynamic real-world problems that cannot be solved by other
analytical models.
According to Carson II (2005), simulation is most useful in the following situations
where:
1. There is no simple analytic model, spreadsheet model or “back of the envelope”
calculation that is sufficiently accurate to analyze the situation.
2. The real-system is regularized; that is, it is not chaotic and out o f control.
System components can be defined and characterized and their interaction
defined.
3. The real-system has some level of complexity, interaction or interdependence
between various components, or pure size that makes it difficult to grasp in its
entirety. In particular, it is difficult or impossible to predict the effect of
proposed changes.
4. You are designing a new system, considering major changes in physical layout
or operating-rules in an existing system, or being faced with new and different
demand.
5. You are considering a large investment in a new or existing system, and it
represents a system modification o f a type for which you have little or no
experience and hence face considerable risk.
6. You need a tool where all the people involved can agree on a set of assumptions,
and then see (both statistically and with animation) the results and effects of
those assumptions. That is, the simulation-process as well as the simulation-
model can be used to get all members o f a team onto a (more) common
understanding.
7. Simulation with animation is an excellent training and educational device, for
managers, supervisors, engineers and labour. In fact, in systems of large physical
scale, the simulation animation may be the only way in which most participants
can visualize how their work contributes to overall system success or creates
problems for others.
The simulation has the capabilities that are unique and powerful in system-
representation, performance-estimation, and improvement. A simulation-model is the
most effective tool to perform quantitative ‘w hat-if analysis, and play different
scenarios o f the process behaviour as its conditions and variables change over time.
Simulation provides a decision-support to the engineers and managers who want to
make the best decisions possible, especially when encountering critical stages of design,
expansion, or improvement projects in a real-system (El-Haik and Al-Aomar, 2006).
The simulation-model allows one safely, rapidly and efficiently to study and assess the
operative process (Volkner and Werners, 2002). This simulation capability allows one
to make experiments on the computer display, and to test different solutions (scenarios)
for their effectiveness before going to the hospital floor for the actual implementation.
According to Banks et al. (2000), a few guidelines can be mentioned here however,
namely that simulation should not be used if:
• the problem can be solved using common sense;
• the problem can be solved analytically;
• it is easier to perform direct experiments;
• the costs exceeds the savings;
• resources are not available;
• time is not available;
• data is not available;
• verification and validation cannot be performed;
• managers have unreasonable expectations;
• system behaviour is too complex, or cannot be defined.
2.3.1 The Advantages of Simulation
Based on Banks et al. (2000), Banks (2000), and Law and Kelton (1991), the
advantages o f simulation are here summarized as:
• Cost: It enables cost reductions and/or avoids costs.
• Time: It reduces ramp-up time of production and possibly development lead-
time.
• Complexity: It enhances understanding of relationships, interactions,
dependencies, etc.
• Dynamics: It captures time-dependent behaviour.
• Replicability: experiments can be repeated at any time.
• Visualization: It provides visual-analysis capabilities.
2.3.2 The Disadvantages of Simulation
According to Banks, Carson and Nelson (1996) the disadvantages of simulation are:
• The need for special training: building a simulation model is an art that is
learned over time and through experience. Although simulation software may
look simple, simulation requires a lot of work both before and after running the
model.
• The difficulties of interpreting the results: Since most simulation outputs are
random variables, it can be difficult to distinguish between system
interrelationships and randomness in the results. In most cases, a significant
amount of knowledge of statistical theory and methods is required.
• Time and cost: Modelling and analysis can take a lot o f time and may be
expensive. There is usually a clear trade-off between the resources allocated for
modelling and analysis, and the quality of the resulting simulation-model in
terms of how well it mimics reality.
• Inappropriate, use: Simulation is sometimes used when an analytical solution
would have been possible or even preferable, or in any of the other cases
described previously (see Section 2.3).
• Non-optimized results: Simulation is not optimization, and even when near-
optimal results are achieved, there is a risk of sub-optimization.
2.4 Steps in a Simulation Study
Simulation is a multi-stage process. Over the course of years, simulation experts have
number of steps (Law and Kelton (2000), Banks et al. (2000), Law and Kelton (1991),
Shannon (1998), Pegden et al. (1995), Benjamin et al. (2000)). The steps in a
simulation study may be varying in different studies because of factors such as the
nature of the problem and the simulation software used (El-Haik and Al-Aomar, 2006).
However, the building blocks of the simulation procedure are typically common among
simulation studies. All of the above approaches to simulation-modelling consist of 10 to
12 steps which can also be grouped into three major generic phases; i.e. defining the
simulation-problem, building the simulation-model, and conducting simulation
experiments. Banks et al. (2000) introduced a set of steps to guide a model-builder in a
thorough and sound simulation-study. His procedure is selected to present in this
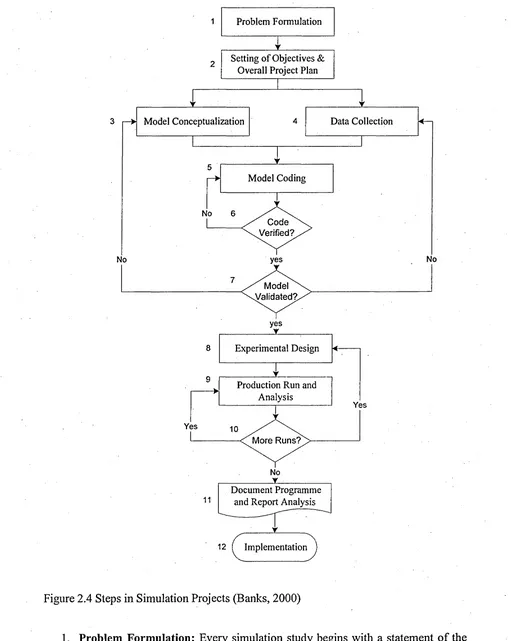
research, as one of the most quoted procedure in simulation literature. Twelve major steps
involved with this approach are shown in Fig. 2.4 and their major tasks are briefly
depicted below it. Similar figures and their interpretation can be found in other sources
such as Pegden et al. (1995) and Law and Kelton (2000).
No
Code Verified?
No
No yes
yes
Yes
Yes
M ore Runs? M odel A/alidated?
Experimental Design Problem Formulation
Model Coding
Production Run and Analysis
Data Collection Setting o f Objectives &
Overall Project Plan
Model Conceptualization
11
No
V
Document Programme and Report Analysis
[image:39.614.44.555.16.657.2]12 ^ Implementation
Figure 2.4 Steps in Simulation Projects (Banks, 2000)
1. Problem Form ulation: Every simulation study begins with a statement o f the
problem prepared by either client or simulation analyst. If the statement is
that the problem is clearly understood. If a problem statement is prepared by the
simulation analyst, it is important that the client understand and agree with the
formulation.
2. Setting of Objectives and Overall Project Plan: Here, the modeller establishes
which tool should be used (e.g. a simulation or other analytical tool) as well as a
set of assumptions. Also, the goals and definition of the project are defined,
along with methods to evaluate the effectiveness of alternatives.
3. Model Building: This refers to devising a conceptual model of the system under
study. This means a more or less simplified, abstracted representation of the
processes to be studied consisting of the essential components only.
4. Data Collection: Data about the system is gathered if possible. If no data is
available, rules o f thumb or personal experience are used to approximate
distributions. Data requirements may change as the model and its complexity
progresses.
5. Coding: Once the conceptual model is established and the data gathered, the
conceptual model is translated into executable code, i.e. into the actual
simulation program.
6. Verification: This stage is necessary to assure the coded model does not contain
any bugs and performs as expected and intended. If this verification fails, the
code needs to be reviewed and corrected until it passes verification.
7. Validation: Here, the focus is on verifying whether the model represents the
system to be modelled with sufficient accuracy. If the model does not represent
the behaviour of the real system with sufficient accuracy, the conceptual model
and/or the data gathered needs to be reviewed.
8. Experim ental Design: This involves designing the alternatives to be studied,
along with the number of replications, the replication length and warm-up
periods.
9. Production Runs and Analysis: This phase consists of running the experiments
designed in the previous step and analysing the results thus obtained.
10. M ore Runs?: At this stage, the modeller has to verify whether the results
obtained thus far are sufficient, or whether more runs or different experiments
have to be run.
11. Document Study and Reporting Results: The results obtained from the
simulation-runs, once analysed, have to be documented and reported/presented
to the problem owner so that the results can be implemented in the actual
system. This is also important if the simulation is to be reused and/or modified,
especially if that will be done by another analyst.
12. Implementation: Depending on how well the previous steps have been
conducted, the implementation of the results from the experiments will be more
or less successful.
2.5 Simulation Software
Nowadays many simulation software-packages are available (ProcessModel, ProModel,
Arena, Simul8, etc) which provide a user-friendly interface that makes the efforts of
building a realistic simulation-model not more demanding than the efforts needed to
make simplifications, adjustments and calibrations to develop a rather complex but
approximate queuing-model.
packages, with no specific application area in mind. Currently, more than sixty
different simulation software are available on the market from various vendors at
different prices ranging from less than US$99 up to US$45,000 and almost all of them
are PC-based and Windows-compatible (Swain, 2007).
The software to be used must be able to cope with both simulation-modelling process
issues, as well as other conventional user and modeller requirements. Hlupic (2000)
surveys academic and industrial simulation-software users. His surveys revealed that
Simul8 and Witness are the two most commonly-used by academics and Witness is the
most widely-used among participant industrial users. The survey also reveals that the
most important features of software are ease of use, ease of communicating with other
programming tools, and applications for building a user-interface. Abu-Taeh et al.
(2007) have investigated 56 simulation-packages with the aim of tackling the trends that
simulation packages are pursuing; and to address the issues around the prevalent
technology.
2.6 Simulation Applications
Computer-simulation has existed for almost 40 years and has been used in every
industry to study systems where there are resources at locations acting upon people or
products (Nance and Sargen, 2002). Typical DES applications include: staff and
production scheduling, capacity planning, productivity improvement, cycle time and
cost reduction, throughput capability, resources and activities utilization, and bottleneck
finding and analysis. A few examples of simulated-systems are manufacturing-plants,
banks, airports, or business organizations (Ferrin, Miller, and Giron, 2000). Kuljis et al.
(2007) also reported that discrete-event simulation has been used mainly for testing
different strategies for increasing dispatch-bay productivity, reducing transport costs by
minimizing the waiting-times for vehicles, job-shop scheduling, logistics and operations
in construction, and analysis of the construction inspection-process.
Simulation is being used for a wide range of applications in both manufacturing and
business operations. According to El-Haik and Al-Aomar (2006), as a powerful tool,
simulation-models of manufacturing systems are used:
• To determine the throughput capability of a manufacturing cell or assembly-line;
• To determine the number of operators in a labour-intensive assembly process;
• To determine the number o f automated-guided vehicles in a complex material-
handling system;
• To determine the number of carriers in an electrified monorail system;
• To determine the number of storage and retrieval machines in a complex
automated storage and retrieval system;
• To determine the best ordering policies for an inventory-control system;
• To validate the production plan in material-requirement planning;
• To determine the optimal buffer sizes for work-in-progress products;
• To plan the capacity of sub-assemblies feeding a production mainline.
Simulation models are also being used for the following wide range of applications in
business operations:
• To determine the number of bank-tellers, which results in reducing customer-
waiting-time by a certain percentage;
• To design distribution and transportation networks to improve the performance
of logistic and vending systems;
o To analyze a company’s financial system;
time-in-system and increase customer-satisfaction;
• To evaluate hard-ware and software requirements for a computer network;
• To design the operating policies in an emergency room to reduce patient-waiting
-time and schedule the working-pattems of the medical staff;
• To assess the impact of government regulations on different public services at
both the municipal and national level;
• To test the feasibility of product development processes and to evaluate their
impact on a company's budget and competitive strategy;
• To design communication systems and data-transfer protocols.
2.7 Simulation in Healthcare
It is well-known that the use of modelling and simulation is widespread in business and
manufacturing, and essential in the management o f any type of organization. Over the
last thirty years a growing number of studies have used simulation in modelling
healthcare and ED performance. In the literature, two extensive reviews on the use of
simulation in healthcare are found and both have been done until 1999 (Jun et al., 1999;
Fone et al., 2003). Jun et al. (1999) surveys, the application of simulations in healthcare
over nearly a 30 year period, from 1960s to the late 1990s. They review 117 journal
articles and classify them according to their objectives but only a few successful
implementations are reported. Fone et al. (2003) also review more than a hundred
papers related to the use of simulation-modelling in healthcare until 1999. Their review
aimed to assess the quality of published studies and to consider their influence on policy
rather than on operations. They opine that the quality of the papers has increased over
the survey-period; however, few papers provide enough detail of
model-implementation. Although the application of simulations has increased over the last
three decades, simulation is still not widely accepted as a viable modelling-tool in
healthcare systems. Adriana (2000) reported that the healthcare industry has adopted
simulation very slowly compared to other industries such as manufacturing. Eldabi et al.
(2007) also report that the healthcare literature contains a large range of numerical and
simulation techniques, but their application does not appear as widespread as in other
sectors, which have long adopted such methods as part of their core operation, reaping
significant benefits.
Jun et al. (1999) searched for studies of more complex, integrated and multi-facility
systems and concluded that there seems to be a lack of such work reported in the
literature. They suggest that the major reasons for this shortage are first, the level of
complexity and resulting data requirements of the simulation model, and secondly, the
resource-requirements including the time and money needed to conduct such research.
They suggest that the main dilemma in such work is deciding on the appropriate level of
detail. Increased detail leads to more realistic representation, which should increase the
confidence of stakeholders. However, increased detail requires extensive, validated data
and this may be expensive and time-consuming to collect. Washington and Khator
(1997) state that the reason simulation-models are not used more often in healthcare
settings is management’s lack of incentive to do so. Management often does not realize
the benefits to be gained considering the time and cost that have to be invested in order
to build a detailed simulation-tool. To overcome the resistance against simulation,
Lowery (1994) suggests that hospital management should be directly involved in the
development of the simulation projects in order to build the model's credibility; and the
use of visual aids or animation to create more confidence in the model’s ability.
Gunal and Pidd (2005) conducted a study on performance assessment o f the hospitals
uses o f discrete-event-simulation for the development and improvement o f health
policy. Some researchers reported that simulation has been successfully used to model
and analyze numerous emergency departments around the world (Mahapatra et al.,
2003). Some other published material (Blasak, 2003 and and Samaha, 2003) shows that
emergency departments are utilizing simulation-modelling with the purpose of
developing specific solutions tailored to resolving their respective issues. Gunal (2007)
also reported that most simulation studies in the healthcare domain are aimed at solving
specific problems in particular healthcare facilities. The commonalities in these studies
are their objectives o f improving performance such as reducing waiting-times or using
resources more efficiently. Because they are specific, these studies guide a modeller as
to how a specific problem can be solved.
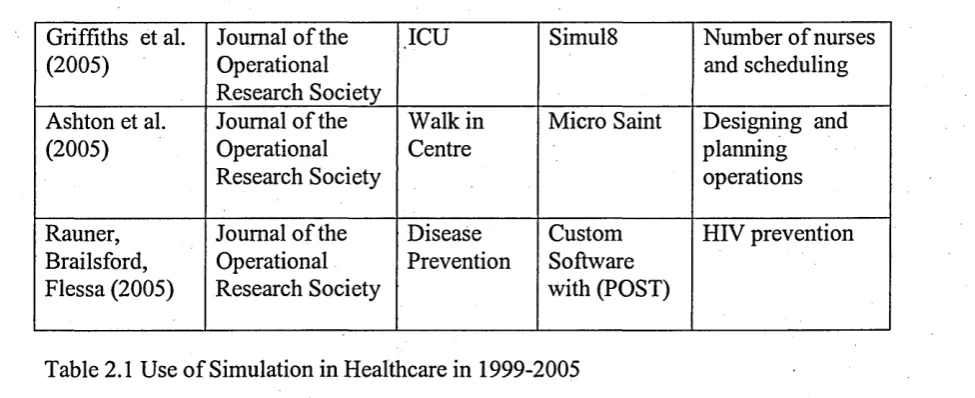
This research includes a comprehensive literature survey of the use of simulation in
healthcare from 1999 to early 2005 to fill the gap from 1999. 35 research papers that
used simulation in healthcare were found from various journals and conference
publications in this time-period. All of these papers are carefully reviewed and
presented in Table 2.3 including the publisher, location of model in healthcare, software
used and the aim/s of study. The table shows that simulation is used to model almost all
the important areas in healthcare but the majority is used to model the emergency
department and healthcare clinics. This review also revealed that simulation is used to
model healthcare systems for different objectives such as performance improvement
including waiting-time, resource-scheduling, capacity planning and utilization, and
facility design.