An integrated framework for optimisation of oil field
production area.
OMER, Alsanosi I. E.
Available from Sheffield Hallam University Research Archive (SHURA) at:
http://shura.shu.ac.uk/20146/
This document is the author deposited version. You are advised to consult the publisher's version if you wish to cite from it.
Published version
OMER, Alsanosi I. E. (2009). An integrated framework for optimisation of oil field production area. Doctoral, Sheffield Hallam University (United Kingdom)..
Copyright and re-use policy
1 0 1 9 2 3 0 5 1 7
s A r i c c f f c r I services
%fJePjre a*y
CampusS1 1WB
ProQuest Number: 10697453
All rights reserved
INFORMATION TO ALL USERS
The quality of this reproduction is dependent upon the quality of the copy submitted.
In the unlikely event that the author did not send a com plete manuscript and there are missing pages, these will be noted. Also, if material had to be removed,
a note will indicate the deletion.
uest
ProQuest 10697453
Published by ProQuest LLC(2017). Copyright of the Dissertation is held by the Author.
All rights reserved.
This work is protected against unauthorized copying under Title 17, United States C ode Microform Edition © ProQuest LLC.
ProQuest LLC.
789 East Eisenhower Parkway P.O. Box 1346
An Integrated Framework for Optimisation of Oil
Field Production Area
Alsanosi Ibrahim E. Omer
A thesis submitted in partial fulfilment of the requirements of
Sheffield Hallam University
for the degree of Doctor of Philosophy
Preface
Preface
This thesis is presented as part of the requirements for the award of the degree of Doctor of Philosophy from Sheffield Hallam University in UK. The reports for research and works carried out by the author were supervised by Professor Sameh Saad from Faculty of Arts, Computing, Engineering and Sciences at Sheffield Hallam University between March 2005 and June 2009.
Acknowledgements
Acknowledgements
I would like to show my profound gratitude to my supervisor Prof. Sameh Saad, my colleagues King Hua Lau and Aririguzo Julian, and those who were not mentioned here for the extensively invaluable advice and help from them. Thanks to them for providing the good working environment; I learnt a lot from their experiences.
Prof. Sameh Saad provided the opportunity by offering this project to me. Much constructive and critical advice was given and inspired my thought in this thesis. He offered a lot of his valuable time and effort whenever I faced any difficulty in carrying out the work and directed me towards the right path whenever I strained from the point.
Abstract
Abstract
Publications itom the Thesis
Publication from the Thesis
Table of Contents__________________________________________ __________ __
Table of Contents
Preface ... ...i
Acknowledgements ... ... ii
Abstract ...iii
Publication from the thesis ... iv
Table of Contents ... v
List of Tables .... ... ... ... ... ...x
List of Figures ... xii
Nomenclature... xvii
Chapter One Introduction and Company Background...1
1.1 Introduction to the Project and Problem-definition... 1
1.2 Company Background... 3
1.3 Aims and Objectives of the Thesis... 5
1.4 The Thesis's Structure... 6
Chapter Two. Literature Review ... 8
2.1 Introduction... ..8
2.2 Crude Oil Transportation ... 8
2.3 Crude Oil Transportation Methods ... 9
2.4 The Background to Oil Production... 10
2.4.1 What is Crude O il?... ...10
2.4.2The Crude Oil Separation Process... 11
Table of Contents
2.6 Conclusion ... ... 25
Chapter Three...Research Methodology and Proposed Framework... 27
3.1 Introduction ... . 27
3.2 Mathematical Programming Histories... 27
3.3 Transportation Model... ..29
3.3.1 The Problem with Mathematical Solutions in Crude Oil Production...30
3.4 Methods Available for Research in General... ... ...30
3.4.1 Mathematical Modelling... ...30
3.4.2 Heuristic Modelling... ... ... 32
3.4.2.1 The Disadvantage of Mathematical Modelling and Heuristic Modelling... .32
3.4.3 What is a Modelling?... ...33
3.4.4 Computer Simulation Modelling... ... ...34
3.4.4.1 The Advantages of Computer Simulation ... 35
3.5 The Computer Simulation Method ...37
. 3.5.1 The Purpose of Simulation.... ...38
3.5.2 Types of Simulation... ...39
3.5.3 Issues Related To Simulation and When Simulation Is Used? ... 40
3.5.4 The Simulation Process... :... 41
3.5.5 Simulation Tools Available... ...43
3.6. ARENA Simulation Tool... ... 45
Table of Contents
3.8 Conclusion... 52
Chapter Four Oil-Wells Optimisation Model...53
4.1 Introduction... ...53
4.2 Model Presentation... ...53
4.3 Proposed Mathematical Optimisation Model ... 54
4.4 Modelling the Bu-Attifel oilfield. ... 56
4.5 Implementation of the Proposed Mathematical Model Using Lingo/ Lindo 64 4.5.1 In the case of supply equals the demand... ...65
4.5.2 The Supply is Greater Than the demand.... ... 66
4.5.3The Supply is less than Demand ... 67
4.5.4 Demand grater than supply (Dummy solution) ... 68
4.5.5 The Supply Greater than Demand (Dummy solution).. ...69
4.6 Results Analysis and Discussion... 70
4.6.1 Introduction of Dummy Supply and Demand... 72
4.7 Conclusion ... 73
Chapter Five Modelling and Analysis of the Oil Separation Area...75
5.1 Introduction... 75
5.2 Conceptual Model... 75
5.2.1 Objectives of the Simulation Modelling... .'76
5.2.2 Process Flowcharts... 76
5.3 Data Collection and Assumptions... ....81
5.3.1 Input and Experimental Factors... 81
Table of Contents
5.3,3 Assumptions and Model Simplification... 82
5.4 Model Building and Descriptions ... 88
5.4.1 Tank Modelling... 90
5.4.2 Separation Process from Manifold to Stage 1 (SI) Separators (SP)...91
5.4.3 Separation Process from Stage 1 Separators to Stage 2 Separators...97
5.4.4 Separation Process through Stage 2, 3 and 4... 99
5.4.5 Separation Process from Stage 4 Separators to Stage 5 Storage Tanks.102 5.4.6 Separation Process from Stage 5 Separators to the setting up the Delivery... ...105
5.5 Verification and Validation... 108
5.5.1 Methods for Verification ... 108
5.5.2 Verification and Validation Carried Out in the Model... 110
5.6 Conclusion... . 113
Chapter Six... Experiments and Results... 114
6.1 Introduction... 114
6.2 Experiments and results ... 115
6.3 Conclusion...124
Chapter Seven... Results Analysis and Discussions... ..125
7.1 Introduction. ... 125
7.2 Input- rate and Number of Production- line Versus Quality of Crude Oil... 126
7.3 Input- rate and Number of Production- lines Versus SP Capacity... 132
7.4 Results Analysis... ..139
Table of Contents
7.4.2 ANOVA (analysis of variance)... ...139
7.5 Conclusion..._... 15 0 Chapter E ight... Conclusions, Contribution to Knowledge, Limitation and Further W orks ... .152
8.1 Conclusion... 152
8.2 Contribution to Knowledge ... ...155
8.3 Limitation and Further Works... 156
References... 158
Appendix A Oil Wells Optimisation model ... 169
Appendix B... ARENA Model Logic Diagrams... 198
Appendix C ...VBA Code... 209
List of Tables
List of Tables
Table 2.1 Top World Oil Producers... 14
Table 2.2 Top World Oil Consumers ... ...15
Table 4.1 Bu-Attifel Oilfield oil-wells information ... 58
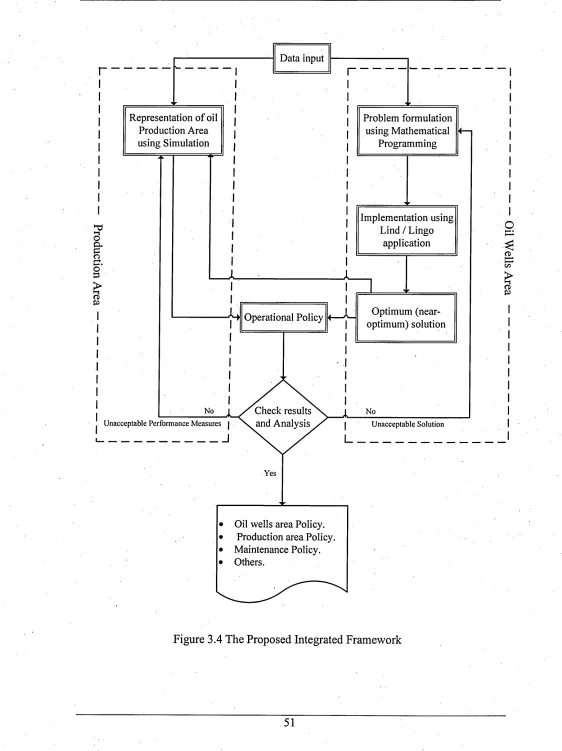
Table 5.1 Data Provided ... 84
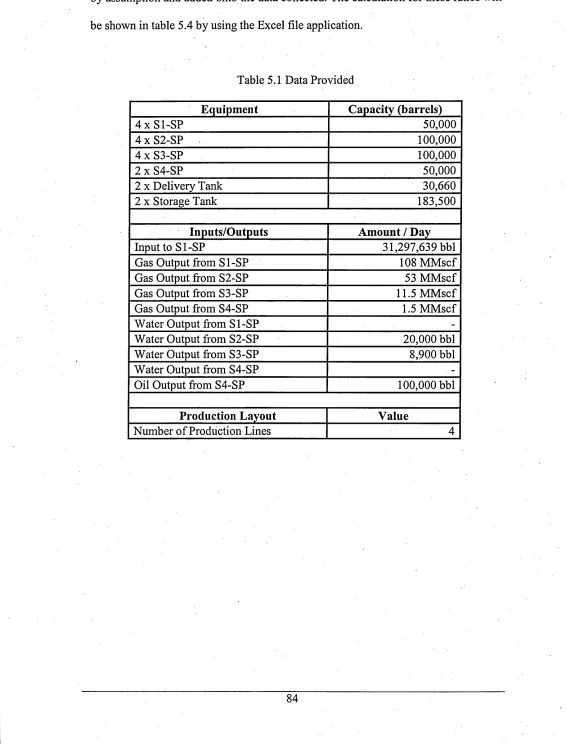
Table 5 2 Component list for model ... 85
Table 5.3 Calculation of the oil output-rate at each stage... ,..86
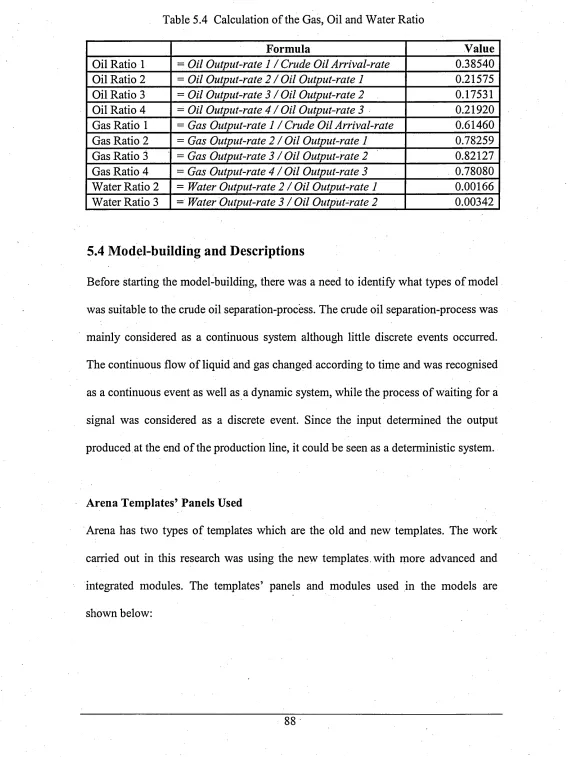
Table 5.4 Calculation of the gas, oil and water Ratio... ...88
Table 5.5 Flow Process modules used... .89
Table 5.6 Basic Process modules used... 89
Table 5.7 Advanced Process module used... 89
Table 5.8 Block used... 89
Table 6.1 Symbols and Values... 115
Table 6.2 Set 1 Different Production-line and water-content with U1 input-rate... 116
Table 6.3 Set 2 Different Production-line and water-content with U2 input-rate. ..117
Table 6.4 Set 3 Different Production-line and water-content with U3 input-rate... 118
Table 6.5 Set 4 Different Production-line and water-content with U4 input-rate... 119
Table 6.6 (a) Experiment for Changing Input- rate with fixed SP capacity. ...120
Table 6.6 (b) Experiment for Changing Input-rate with fixed SP capacity ...121
Table 6.7 Set 5 Different Production-line and SP capacity with U1 input-rate.. 122
Table 6.8 Set 6 Different Production-line and SP capacity with U2 input-rate... 123
List of Tables
List of Figures
List of Figures
Figure 2.1 Example of crude oil wells distribution ...9
Figure 2.2 (a) Horizontal Separator; (b) Vertical Separator... 12
Figure 2.3 Horizontal three-phase separator schematic... 12
Figure 3.1 Framework in Simulation Study ... 43
Figure 3.2 Important Criteria for the Proposed Model... 45
Figure 3.3 Arena Window for the Simple Processing System... ...48
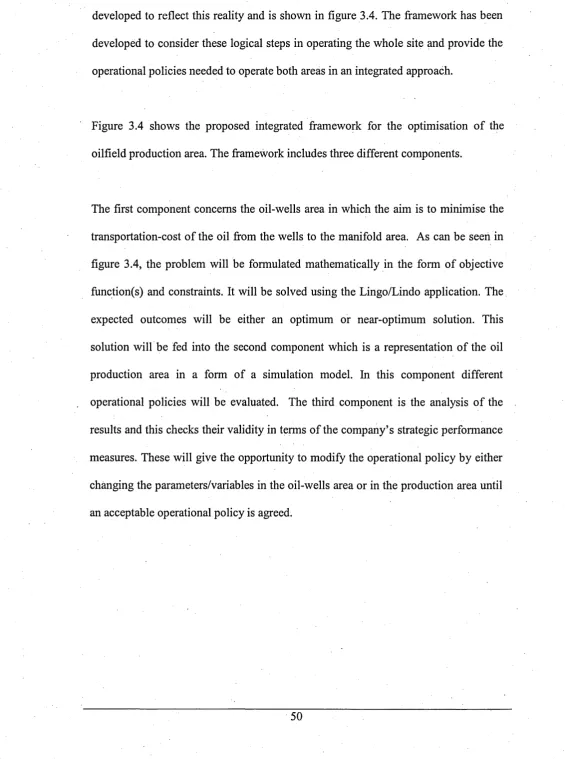
Figure 3.4 The Proposed Integrated Framework... 51
Figure 5.1: Process Flow-Chart of Crude Oil Separation ... 79
Figure 5.2 Crude Oil Separation-Process Layout Diagram... ...80
Figure 5.3 ARENA Flow-chart of Manifold Refill... 90
Figure 5.4 Flow-chart of Crude Oil Separation from Manifold to Stage 1 Separators ... 95-96 Figure 5.5 Flow-chart for Separation from Stage 1 to Stage 2...98
Figure 5.6 Flow-chart of Separation from Stage 2 to Stage 3... 100
Figure 5.7 Flow-chart of Separation from Stage 3 to Stage 4...101
Figure 5.8 ARENA Flow-chart of Separation from Stage 4 to Stage 5 1 0 4 Figure 5.9 Flow-chart of Oil Transfer from Storage Tank (Line 1&2)...106
Figure 5.10 Flow-chart of Oil Transfer from Storage Tank (Line 3&4)...107
Figure 5.11 Basic Model-building and Testing...111
List of Figures
Figure 7.2 Out-put against Water Content with four Production-lines with
Input- rate U2... ...129
Figure 7.3 Out-put against Water Content with four Production-lines with Input-rate U3... 129 Figure 7.4 Output against Water Content with four production-lines with
Input-rate U4... ;... ...130 Figure 7.5 Output against Water Content with combining Figure 7.1
to Figure 7.4... 131
Figure 7.6 Oil output with different Input-rate... 133 Figure 7.7 SP Utilisation... ... ... ... 133 Figure 7.8 Output against SP Capacity with four Production-lines with
Input- rate U1 ... .135 Figure 7.9 Output against SP Capacity with four Production-lines with
Input-rate U2... 136
Figure 7.10 Output against SP Capacity with four Production-lines with
Input-rate U3... 136 Figure 7.11 Output against SP Capacity with four Production-lines with
Input-rate U4 ... ..137
Figure 7.12 Output against SP Capacity with combining Figure 7.8 to
Figure 7.11... 138
List of Figures________________ ______________ ;______________ .
Figure 7.15 Estimated Marginal Means of Total oil output
at Water-content - 0.75... 143
Figure 7.16 Estimated Marginal Means of Total oil output at Water-content - 0.50... .144
Figure 7.17 Estimated Marginal Means of Total oil output at Water-content - 0.25... ...144
Figure 7.18 Estimated Marginal Means of Total oil output at Water-content 0.0... 145
Figure 7.19 Estimated Marginal Means of Total oil output at Water-content 0.25... 145
Figure 7.20 Estimated Marginal Means of Total oil output at Water content 0.50... 146
Figure 7.21 Estimated Marginal Means of Total oil output at Water-content 0.75... .146
Figure 7.22 Snap-shoot of the SPSS Data-view Sheet...147
Figure 7.23 Snap-shoot of the SPSS Variable-view Sheet... ..147
Figure 7.24 Estimated Means of Oil output at Different Capacity, Input-rate and Number of lines... 150
Appendix A Oil-wells Optimisation Model...169
Figure 1 Lingo Output when Supply Equal the Demand...170
Figure 2 Lingo Output when Supply Greater than the Demand... 174
List of Figures _________________ ;____ ________
Figure 4 Lingo Output when Demand > Supply (Dummy Solution)...182
Figure 5 Lingo Output when Supply > Demand (Dummy Solution)...186
Figure 6 Supply > Demand (Dummy Solution)... ...192
* Appendix B... ARENA Model Logic Diagrams... 198
Figure 1 Model Logic of Crude Oil Separation from Manifold to Stage 1 Separators... ... ...199
Figure 2 Model Logic of Crude Oil Separation from Stage 1 to Stage 2 Separators... 200
Figure 3 Model Logic of Crude Oil Separation from Stage 2 to Stage 3 Separators... 201
Figure 4 Model Logic of Crude Oil Separation from Stage 3 to Stage 4 Separators... 2002
Figure 5 Model Logic of Crude Oil Separation from Stage 4 Separators to Stage 5 Storage Tank... ....203
Figure 6 Model Logic of Oil Delivery from Stage 5 Oil Storage Tanks to Stage 6 Oil Centre... 204
Figure 7 Model Logic of Manifold Refill... 204
Figure 8 Tank Modules for Separators, Manifold and Storage Tanks... 205
Figure 9 Animation.... ... 206
Figure 10 Interface for Changing Separators Utilisation... ....207
Figure 11 Interface for Changing the Capacity of the Separators...207
Figurel2 Interface for Selecting the Production Line...208
Figure 13 Interface for Choosing the Water Contents in Crude Oil...208
List of Figures
[image:20.613.33.574.4.780.2]Appendix D... Pictures... 251
Figure 1 Manifold... 252
Figure 2 API Oil - Water Separator.... ... ....252
Figure 3 Horizontal Separators... ...253
Figure 4 Vertical Separators... .253
Nomenclature
Nomenclature
A
Al Number of production lines
A2 Number of production lines
A3 Number of production lines
A4 Number of production lines
ANN Artificial Nerve Network
atm Atmosphere, a unit of atmospheric pressure
B
bbl Barrels, unit for fluid
C
Cl Capacity of separator
C2 Capacity of separator
C3 Capacity of separator
CFD Computational Fluid Dynamic
Ct Capacity of oil well i
c t Total oil wells capacity
D
dj Demand at manifold (j)
Nomenclature
dt Change of time
dx Change of distance
F
f(x) Derivative function
FORTRAN Formula Translation, a high level programming language
FTP Flowing tubing pressure
G
gas ratio Ratio of gas content in one barrel of crude oil
GPSS
General Purpose Simulation System, programming language for
discrete event simulation
I
i Number of wells
J
JAVA A type of object oriented programming language
J Number of Manifold
L
LP Linear Programming
Lingo & lindo Software used to solve the mathematical model
M
Nomenclature
MDP Mixed Integer Programming
MMscf Million standard cubic feet, unit for gas
MRP Material Requirements Planning
O
oil ratio Ratio of oil content in one barrel of crude oil
P
PIMS Process Industry Modelling System
R
RPMS Refinery and Petrochemical Modelling System
S
S'j Distance from oil wells (i) to manifold (j)
SI Stage 1
S2 Stage 2
S3 Stage 3
S4 Stage 4
S5 Stage 5
SIMAN SIMulation ANalysis, manufacturing system simulation language
SEMSCRIPT General-purpose programming language
SLAM Discrete system modelling programming language
Nomenclature
ST1 Delivery tank 1
ST2 Delivery tank 2
ST3 Storage tank 1
ST4 Storage tank 2
SUM Equation symbol used in Microsoft Excel representing summation
T
TOC Theory of Constraint
V
VB
Visual Basic, programming language used for Windows
application
VBA
Visual Basic for Application, common language for customising
software applications, and extension of VB
VNS Variable neighbourhood search
VSP Vertical separator
w
W1 Level of crude oil quality
W2 Level of crude oil quality
W3 Level of crude oil quality
W4 Level of crude oil quality
Nomenclature
W6 Level of crude oil quality
W7 Level of crude oil quality
water ratio Ratio of water content in one barrel of crude oil
X
Chapter One Introduction and Company Background
Chapter 1
Introduction and Company Background
1.1 Introduction to the Project and Problem-definition
Crude oil is the important principal source of energy in the world, and is used as a resource in many areas of our daily life.
Many countries have tried to obtain this resource and have paid vast amounts of money to explore for oil. Whilst the exploration for oil is needed, it can be an expensive process, which includes the sourcing of the oil through to processing and finally delivery to the customer. Therefore, companies are working hard to optimise their project-operations.
Decreasing the oil-production cost begins with the exploration of the reservoir. This includes the different operations which are used to determine the location of the reservoir, and start-up costs of drilling the first oil-well which is a difficult and high- cost operation. Once the location and initial drilling are complete, the crude oil is produced from different oil-wells which are drilled in the reservoir and transferred to the surface.
In the oil field there are many problems related to the oil wells area and production area, for example enhanced of oil wells production these includes all the operations which should be carried out in the oil wells (e.g. water injection or gas injection) to
Chapter One Introduction and Company Background improve the oil production. In other hand, there are other problems in the production area for example maintenance planning for separators, pumps, valves and tank.
One of the of the important problems involved is how to minimise the transportation- cost of the crude oil and at the same time guarantee a high-quality product which is requested by the customers, in order to fulfil particular demand over a particular period of time.
The oil-field contains many oil-wells with different capacities and quality of oil, and also with different distances from the oil-wells to the manifold.
The first problem this research will focus on is how to minimise the transportation- cost and to decide on the most suitable operational policy for the oil-well area.
Chapter One Introduction and Company Background thorough planning just by traditional design and analytical methods. Highly- automated and computer-controlled oil-production systems are not capable of achieving high performance and to integrate the complex systems. The risks and costs are too great and too high for implementation which is not completely tested and analysed for its effectiveness. Mismatches and unexpected factors are really worrying for most of the process and operations planning, and failures in the systems can cause enormous losses both in time and financially.
However, there is another challenge: to keep this equipment operating smoothly without a break. In this case maintaining this equipment is vital and the maintenance tasks, as well as the procedure that should be followed in case of unexpected break down, and how to cope with the subsequent incident should all be considered and planned carefully
1.2 Company Background
Eni is one of the prestigious energy companies operating in 70 countries over the world. Its head-quarters are located in Italy. Eni is generally involved in oil and gas, electricity generation and sale, petrochemicals, oilfield services, and the construction and engineering industries. Eni (Libya) is one of the branches setup in Libya and consists of four oilfields, which are Bouri oilfield, Bu Attifel oilfield, Rimal oilfield and El Feel oilfield. They are mainly involved in crude oil production throughout the African continent. This research will be applied to the Bu Attifel onshore oilfield which is located in the A100 concession in the Libyan Desert. The field was discovered in 1968 and the production began in October 1972 (Eni, 2008).
Chapter One Introduction and Company Background The current installation of Bu-Attifel field includes:
Oil Centre Facilities: which consist of the oil wells, manifold, horizontal and vertical separators, tanks and delivery pumps. These parts will covered in this study by applying the mathematical model to optimise the transportation-cost (in terms of reducing the distance from the oil-wells to the manifold) and the simulation technique will applied in the separation area.
Gas-processing Plant: this plant is used to increase the pressure of the gas which is removed from the separation area at different stages. The gas-pressure in the first stage is 700 psi and this gas is delivered direct to the Natural Gas Liquids plant (NGL). The gas-pressure in the second stage is 350 psi and this needs to be increased to 700 psi in the gas plant before it is sent it to the NGL. In the third stage the gas- pressure is 30 psi and this also increased to 700 psi by the gas plant too, and delivered to NGL.
Natural Gas Liquids Plant (NGL): this plant is designed to work with the gas which is removed from the oil in the separators area; therefore the gas is changed to liquid (condensate) under high pressure and delivered to the customer as condensate.
Chapter One Introduction and Company Background Oil and gas delivery pipelines: these big-size pipe lines are used to deliver the oil and condensate to the customer from the field to the port.
There are many other facilities in the field which are considered as very important, for example the chemical laboratory, maintenance department and communication department.
The layout details of the production will be discussed in Chapter 5.
1.3Aims and Objectives of the Thesis
Oil production or refinery has several processes and stages which involve transportation, separators and storage-tanks. The overall aim of this study is to develop an integrated framework to optimise the oilfield production area. In this environment there are two challenges to deal with, the crude oil transportation and crude oil production area.
The first objective is to optimise the crude oil transportation cost from the oil wells to the manifold in term of distance.
Additionally, the number of wells which will be used or will need to be closed depends on the capacity of the oil-wells and market demand. This situation needs to be optimised in order to fulfil particular demand over a particular period of time in the most cost-efficient way.
Chapter One Introduction and Company Background The second objective of the thesis is to optimise the productivity and profitability of crude oil area by examining the effect of the some parameters on the performance measures of the production area to increase its productivity and profitability.
The number of production lines, in particular, will be tested to find out not only the number of lines needed to fulfil the demand but also the number of lines necessary to handle the maintenance activities in the real system by distributing the production load on the other working lines.
1.4 The Thesis's Structure
The rest of the report will discuss more about the background of the research and what has been done previously using different methods for the crude oil transportation and crude oil separation. Theories regarding the production operations and methods used by various authors in the past for analysing the transportation-cost and productivity improvement will be discussed more in Chapter Two. Also, in this Chapter, definitions for some of the oil-production jargon will be explained. Chapter Three emphasises the methodology and how the project was carried out, including the general methods that could be used and justification of the used methods.
Chapter One Introduction and Company Background Experiments are designed in Chapter Six, and results from the simulation will be analysed and discussed further in Chapter Seven. Chapter Eight will finally conclude the whole project and make recommendations for improvements on the current production systems and operations, followed by ideas for future work on further improvements.
unapter iwo literature review
Chapter 2
Literature Review
2.1 Introduction
The previous Chapter introduced the thesis and defined the problems which it will address, followed by information about the Eni Oil Company and Bu-Attifel oilfield which is used as a case study in this thesis. Some ideas were specified about the oilfield facilities and departments. At the end the aim and objectives of the thesis were explained.
The preface to the crude oil transportation, oil-production, crude oil separators and works carried out by previous scientists and engineers for optimisation of crude oil transportation and productivity through different methods will be researched in this Chapter.
2.2 Crude Oil Transportation
Chapter Two Literature Review Figure (2.1) shows example of the distribution of oil wells in the reservoir.
M an ifo ld
Figure 2.1 Example of crude oil wells distribution
2.3 Crude Oil Transportation Methods:
The major transportation methods, which provide lower-cost transportation of large volumes over long distances, are tankers and pipeline.
• Pipeline: a very economical method which can be used to cover long distances, but limited as to route and destination.
• Tanker: tankers are used to carry large volumes of crude oil across international waters to link exporting and importing nations.
Chapter Two .Literature Keview > Crude oil type.
> Cost and availability of alternatives.
Typical total unitary crude transportation-cost is in the range of U$$ 1.50-3.00 per barrel of crude (Cheng et. al. 2004).
To enhance the decision-speed and decrease the transportation-cost, different techniques will be used. One of these techniques is linear programming.
2.4 The Background to Oil Production
Oil and gas have been the main driver of civilisation since the 19th century before the nuclear and computer age started, and they are still playing a significant role in the development of the modem world. They are among the most important commodities in our life as one third to half of the energy consumed is produced from oil and gas. The world is in a technology era and all technology products need energy to function. Energy is needed for the lights, heating, food-growing, industrial applications, transportation, entertainment, etc.
2.4.1 What Is Crude Oil?
heating-Chapter iwo Literature Keview oils, diesel fuels, kerosene or paraffin, naphtha, petrol, petroleum gases, butane, propane and natural gas methane are all products from the processed crude oil.
They can be classified from densest fractions and lighter fractions depending on their characteristics. According to British Petroleum (1977), crude oil or petroleum naturally contains various individual chemical compounds such as volatile liquid hydrocarbons, otherwise known as gas condensates or non-volatile liquid hydrocarbons, which cannot be distilled due to high molecular weight constituents.
Crude oil found in different zones over the world has its own uniqueness where the proportions of the mixtures and compounds vary from one place to another. Some crude oil has . higher viscosity since it contains more semi-liquid hydrocarbons while some contains more gases or water which results in lower viscosity. The quality of the crude oil depends on the proportion of water in it which can give more oil output from the production. There are other factors that dictate the quality of crude oil such as impurities contents, pressure, temperature, etc.
2.4.2 The Crude Oil Separation Process
Chapter Two Literature Review
(a) (Source: COMPACT, Horizontal Conventional Mist Pad Separators, Compact,
Figure 2.2 (a) Horizontal Separator; (b) Vertical Separator
(b) (Source: COMPACT, Vertical Conventional Mist Pad Separators, Compact,
Oil, Water and Gas Separation
P r e s s u r e Co nt ro l V a l v e
Mist Extractor
Inlet D i v e r t e r i— [XI— ► G a s O ut
Gravity S e t t l i n g S e c t i o n
Oil & Emulsion Pad Water Pad
Weir
Gas/Liquid Interface
Oil/Water Interface
W a t e r Out (X)— Oi l O u t
L e v e l Co nt ro l V a l v e s
(Source: Arnold and Stewart, (1999), pg. 137, altered contents by A. Omer)
Chapter Two .Literature Keview Crude oil arriving from the manifold is flashed into the separator at high pressure from the inlet and hits the inlet-diverter. This is where the liquid and vapour in the crude oil separate at high momentum. The vapour which contains different chemical compounds flows to the top of the vessel and is extracted from the separator through the mist-extractor. The liquid flows down to the oil/water interface by the down- comer directed from the inlet-diverter.
There are droplets within the gas, oil and water. The gas will contain some liquid droplets which are not yet separated by the inlet-diverter but which will be separated by the mist-extractor and drop into the liquid by gravity-force. The oil droplets in the water will rise above the oil/water interface and the water droplets in the layer of ‘oil pad’ will settle down below the oil/water interface. The weir is used to maintain the oil level so that the oil is skimmed over the weir. The level controller valves control the level of water and oil downstream of the weir. These processes are repeated through different separators at different pressures until the oil is completely separated from the water and gas at atmosphere pressure. The more detailed processes will be discussed in the rest of the reports. The figures regarding the separators, manifolds, storage-tank and API separator can be referred in Appendix D.
Chapter Two .Literature Keview crises in the years 1973, 1979 and also price increases in the years 2004 to 2006. Engineers have been trying to come out with better and more advanced technology to refine petroleum over decades ever since industrialisation in the 18th and 19th centuries. While the level of oil reserves are decreasing throughout the world, higher optimisation of oil production systems and facilities is an important solution to the problem, along with sourcing renewable energy which has not yet fully replaced the conventional energy-sources.
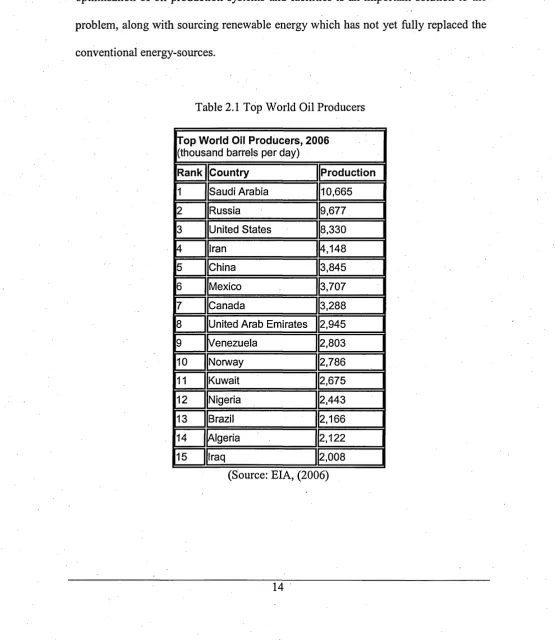
Table 2.1 Top World Oil Producers
Top World Oil Producers, 2006 (thousand barrels per day)
Rank Country Production 1 Saudi Arabia 10,665
2 Russia 9,677
3 United States 8,330
4 Iran 4,148
5 China 3,845
6 Mexico 3,707
7 Canada 3,288
8 United Arab Emirates 2,945
9 Venezuela 2,803
10 Norway 2,786
11 Kuwait 2,675
12 Nigeria 2,443
13 Brazil 2,166
14 Algeria 2,122
15 Iraq 2,008
[image:39.613.23.579.145.786.2]inapter iwo literature Keview
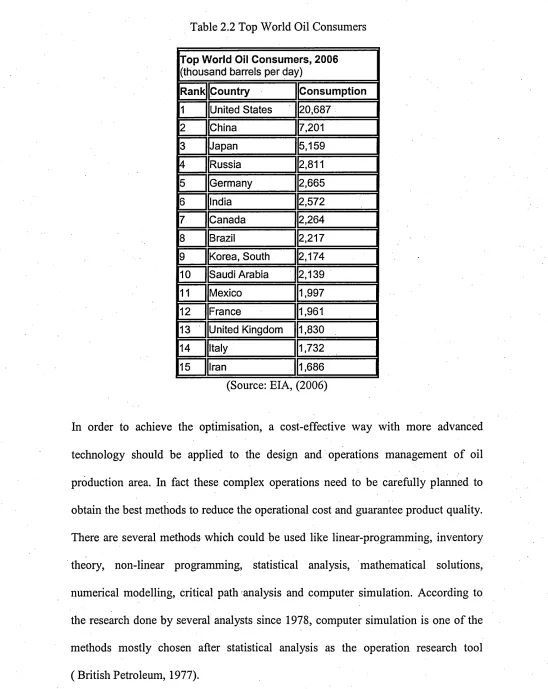
Table 2.2 Top World Oil Consumers
Top World Oil Consum ers, 2006 (thousand barrels per day)
Rank Country Consumption 1 United States 20,687
2 China 7,201
3 Japan 5,159
4 Russia 2,811
5 Germany 2,665
6 India 2,572
7 Canada 2,264
8 Brazil 2,217
9 Korea, South 2,174 10 Saudi Arabia 2,139
11 Mexico 1,997
12 France 1,961
13 United Kingdom 1,830
14 Italy 1,732
15 Iran 1,686
(Source: EIA, (2006)
Chapter Two Literature Keview
2.5 Related Literature
"Optimisation or mathematical programming is a mathematical procedure for determining optimal allocation of scarce resources" (Schrage, 2002). Mathematical programming is widely used for modelling with the objective of maximising the profitability or minimising the cost of a process.
Linear programming (LP) is one type of mathematical programming and also is used mostly as a research technique in production and operations management. The term linear programming was firstly introduced by George Dantzig, an American mathematician in 1940. Linear programming techniques were used on very large computers for the operational-phase, supply-phase and planning-phase in BP supply planning (British Petroleum, 1977). The linear programming models were used for the planning of maintenance shut-down, stock-control, etc by refiners to improve productivity and a series of marginal cost-savings was generated in relation to all the refined products to improve profitability.
Chapter lwo .Literature Keview Giliberti et. al. (1995) presented the methodology to optimise the dynamic simulation of the giant Bu Attifel oilfield (Libya) producing under-water injection for 21 years. Oil-displacement by water and gas flooding was studied by using a two-dimensional numerical black oil model.
Shah (1996) used mathematical programming techniques for crude oil scheduling. Shah showed that it is possible to apply mathematical programming approaches to this economically-important problem. This allowed the specification of a variety of optimisation criteria and a general set of constraints that may be increased or reduced according to the details of individual installations. Since the refinery production plans are usually developed using optimisation techniques, there is also scope for integrating these two facets of decision-making. These techniques may be used in a hybrid approach, where the user could modify interactive schedules proposed by the optimisation.
Carvalho et. al. (1996) developed a numerical model to simulate the operation of a sub-sea separation and boosting system called Petroboost. A computer simulator was built based on the mathematical model developed.
Chapter Two literature Keview Jalali et. al. (1997) suggested that the advantages can be identified from the utilisation of process-simulation during the operational phase of an oil and gas separation process. On-line optimisation could also contribute to troubleshooting and surveillance, operation-training and upstream-downstream integration.
Optimal production-planning is one of the most useful tools for a company to stay competitive in the market. A linear programming model for integrated steel production and distribution planning was introduced by Chen and Wang (1997) to formulate the production and transportation planning problem based on the company's system-structure and production-practice. The model was illustrated by a smaller-sized sample and tested by a large-sized realistic problem. Critical analysis was conducted to obtain in-depth knowledge of the system.
Yueming and Halijum (1998) developed a grey integer program model for oilfield development projects on the basis of the theory of the grey system and integer program method. The result showed that the production measures for oilfields could be programmed by using the integer program method. Artificial Nerve Network (ANN) was used with Monte-Carlo stochastic model to program the measures. Linear programming problems needed to be solved for many times in the brand-and- bound method.
Chapter Two .Literature Keview environments, named OPTI_PRE, to simulate and evaluate the separation process with the three mentioned techniques.
In the field of oil and gas optimisation, Fichter (2000) discussed the application of Genetic Algorithms in oil and gas portfolio optimisation. He showed that Genetic Algorithms are excellent at handing accurate and complex non linear business models. Genetic Algorithms are capable of generating multiple good solutions providing an opportunity to explore alternative characteristics of the portfolios, including value and risk measure. This class of algorithms is capable of scaling upwards of a thousand projects, well beyond the reach of traditional methods.
Fraedrich and Goldberg (2000) introduced a methodological framework for the validation of scientific simulation. This framework synthesised the principles from several diversified fields and contained five functional phases for a simulation validation and improvement project. Within this framework, the requirements of the objectives of each phase were stated, and procedures from the model verification and validation literature were cited, where appropriate. Where conventional techniques were not appropriate or optimal, methodological procedures from other field were suggested.
m apter iwo imeraiure review Li et al. (2002) proposed a solution algorithm and effective mathematical formulations for short-term scheduling of crude oil unloading, storage, processing with many oil types, multiple berths, and multiple processing-units. Mathematical programming has been extensively studied and implemented for long-term plant- wide refinery planning. Some commercial software has applied a linear programming model, such as RPMS (Refinery and Petrochemical Modelling System) and PIMS (Process Industry Modelling System), which have been developed for refinery production planning.
Gothe-Lundgren et. al. (2002) described a production planning and scheduling problem in an oil refinery company. The problem was in a distillation unit and two hydro-treatment units. The aim of the scheduling was to decide which mode of operation should be used in each processing-unit at each point in time. Scheduling tools have been developed based on a tabu search heuristic to solve the model, and the schedules obtained have been analysed by experienced planners reflecting on the actual planning situation.
Chapter Two .Literature Keview Khang et. al (2004) introduced a synergetic statistical approach based on field-data to analyse the oscillations of pressure by determining simultaneously the Hausdorff Dimension "D", the Hurst Index "H" and the Entropies "E" as a useful tool for managing the multiphase pipeline transportation system. The results showed that the dimension characteristics of fractal curves, such as the Hausdorff Dimension "D" and the Hurst Index "H" could allow diagnosis of the hydraulic behaviour of oil and gas flows. The synergetic method helped to analyse the dynamic behaviour of oil and gas flows in pipelines based on information collected from daily operations without the need to conduct a costly field-test. Crude oil blending was an optimisation operation, based upon extensive process-knowledge and experience.
Yu et. al. (2004) introduced a new approach to solve the problem of bending optimisation based on historical data, and gave a thorough analysis of the neural optimisation, and real data of oilfields was also used to show the effectiveness of the proposed method. Several authors have pointed out the need to improve the design procedure of conventional oil-water separation.
Chapter Two Literature Keview Pettersson and Soderman (2005) presented a model for structural and operational optimisation of a Distributed Energy System (DES). The problem was formulated as a mixed integer linear programming (MILP) problem where the objective was to minimise the overall cost of DSE, for example, the sum of the running costs for the included operations and the annually investment costs of the included equipment. The developed model gave realistic solutions that could be used as a basis for the design of regional distributed energy systems. The application range of simulation techniques has increased in recent years and, consequently, a great deal of high- quality simulation software has emerged in the marketplace with different characteristics and purposes.
Kokal and Al-Ghamdi (2005) discussed challenges related to emulsions that have been encountered in a large Saudi Arabian field. This paper presented the results of a comprehensive study that was initiated to understand the main causes of emulsion formation in the field and investigate ways to optimise oil-water separation. A comprehensive study was undertaken earlier to understand the main causes of emulsion-formation in the field and many factors were investigated, for example water-cut and temperature. The results showed a strong correlation of asphaltene content in the crude oil with emulsion tightness.
Chapter iw o .Literature Keview oil industry and it was used to examine four commercial software systems that might fulfil the technical requirements established by the organisation.
Ghoniem et al. (2005) described the construction and use of general optimisation and allocation models for the Khafiji field which simulate the combined performance of the reservoirs, wells and surface-gathering network. Individual well-models and surface-gathering networks have been built from the middle of perforations to separators at gas/oil separation platforms (GOSP). The more accurate multiphase flow correlation has been selected to generate performance curves. These models were calibrated and validated against actual field-data with -1.2% average percentage error, 2.5% average absolute percentage error and 3.5% standard deviation, then lift gas was automatically re-distributed between wells.
Constant-Machado et al. (2005) studied the flow behaviour of crude oil in a battery of industrial crude oil/gas separators in oil industry. The residence time distribution (RTD) of the crude oil has been determined by an impulse injection o f 113m IN at the inlet of each separator and the concentration has been continuously recorded at the outlet. The RTD of the crude oil has been simulated by a model composed of a few mixing cells in series representing the effect of the deflector located at the entrance and a plug flow party due to the high viscosity of crude oil.
Chapter Iwo .Literature Keview Mixed Integer Programming (MIP) problem that maximised the net present value which included the revenues as well as the installation, drilling and connection costs. The solution of the MIP was computationally expensive and required different alternative techniques.
Tavares et al. (2006) assessed different strategies for the expansion of Brazilian oil refinery segments, using criteria that range from energy security (reducing imports and vulnerability for key products) through to maximising the profitability of this sector (boosting the output of higher value oil products) and adding value to Brazil's oil production (reducing exports of heavy acid oil). Four criteria were adopted for adding new refineries to the current segment; the initial criterion (energy vulnerability) referred to the logic of minimising the energy vulnerability of the oil chain. The second criterion (minimum-processing) was designed to boost the profitability of domestic oil production. The third criterion (maximum profitability) followed the strategy of maximising the profitability of a refinery on a stand-alone basis, fine-tuning its output for gasoline. Finally, the fourth criterion (petrochemical integration) sought to integrate the refinery with the petrochemical industrial complex refinery focusing on petrochemicals, particularly propane.
Chapter iwo .Literature Keview purposes. Today, there are many higher-level programming languages created like GPSS, Simscript, SLAM, SIMAN, C/C++ Code and VBA, which provide better functionality to create the simulators. By applying these languages in the simulation tool, a more user-friendly interface and more advanced model can be created.
2.6 Conclusion
In this chapter the transportation of crude oil was studied by giving an account of different kinds of crude oil transportation, and how the transportation-cost of crude oil from the oil-wells to the manifold could be decreased by using linear programming technique.
Crude oil production is discussed which includes the different kind of separators that are used in crude oil production. Top world oil-producers and consumers were studied by introducing the largest producer and consumer countries in the world. Also in this chapter the previous studies which were carried out by scientists and engineers in the field of mathematical programming and simulation were described to prove how these techniques were used widely to solve many problems or to improve productivity in different fields.
Chapter three Research Methodology ana proposed trame worn
Chapter 3
Research Methodology and Proposed Framework
3.1 Introduction
In the previous chapter, works carried out by previous scientists and engineers for the optimisation of crude oil transportation and production by different methods were reviewed. The different kinds of separators which are used in crude oil separation were discussed.
In this chapter, research methodologies in general and the carefully chosen methods used in this thesis are presented. In addition, the proposed framework for the
optimisation of the oilfield production-area is introduced.
3.2 Mathematical Programming Histories
Optimisation or constrained optimisation, or mathematical programming, is a mathematical procedure for determining optimal operational policies for the available resources. The most popular special form of optimisation is Linear Programming (LP). The petroleum industry was an early intensive user of LP for solving fuel-blending problems (Schrage 2002).
Chapter inree Kesearcn Metnoaoiogy ana proposed irame worn of model which arises in the industry is the refinery optimisation. This technique is also used in the chemical industry in different operational methods similar to those used in the petroleum industry. In the manufacturing industry Linear Programming is frequently used for resource-allocation. Resources to be allocated are usually processing-capacity, raw materials, and man-power. A multi-period problem of this type, measured in relation to the. engineering industry, is the factory planning. Other common applications of LP in manufacturing are in the steel industry (blending and blast-furnace burdening). Also the problem of distribution can often be formulated as LP models.
In finance due to Markowitz (1959) a very early application of mathematical programming was in the portfolio section. This was given a sum of money to invest; the problem was how to spend it between a portfolio of shares and stocks. The purpose was to keep a certain expected rate of return from the investment but to minimize the difference of this return.
Agarwala and Goodson (1970) proposed how LP can be used by governments to design an optimum tax package to achieve some essential aim (in particular a development in the balance of payments). This was an example of LP usage in finance, but it is used for many other purposes.
unapter inree Kesearcn iviemoaoiogy ana proposed irame worn should manpower and machinery be deployed to best effect? In manpower planning, by using linear programming it is possible to move people between different types of job and to control recruitment, promotion, retraining, etc The food industry makes
wide use of linear programming, blending (sausages, meat, pies, margarines, ice cream, etc.) is a clear application regularly giving rise to very small and easily-solved models. In Energy, both the electricity and gas supply industry use mathematical programming to deal with problems of resource-allocation. Linear Programming was used in the manufacture of paper in resource-allocation. In addition, recycling waste-paper has also been examined by Linear Programming as described by Glassey and Gupta (1974). Linear Programming is also used in media-scheduling problems e.g. television commercials, newspaper advertisements, etc (Williams 1999).
Further to this introduction about Linear Programming usage, please note that the main aim of the different kinds of industry is to enhance their productivity and profitability by using different techniques which lead to a reduction in costs.
In the oil industry it is vital to decrease the cost of oil-production from the extraction of crude oil from the reservoir to delivery to the customer.
In fact these complex operations need to be carefully planned to obtain the best methods to reduce the operational cost and guarantee product quality.
3.3 Transportation Model
Chapter Three Research Methodology and proposed irame worK The objective of using the transportation model is to determine the shipping schedule that minimises the total cost of shipping (Taha 2003).
In this part of my study the transportation model will be applied to minimise the cost of the transportation of crude oil from different oil-wells (the source) to the manifold (the destination). The decision was taken to use Mathematical Linear Programming because mathematical programming is superlative for crude oil transportation, and during the study of the problem it presented linear equations. Also the software (Ling & Lindo) which will be used to solve the equations is available at the university.
3.3.1 The Problem with Mathematical Solutions in Crude Oil Production
Crude oil wells are drilled in the reservoir in different situations and at different distances from the crude oil facility. Therefore, the wells are connected by pipes from the wells to the crude oil facility. The distance and also the productivity of every well is different and the oil could be of different quality. A mathematical model will be used in this thesis to optimise the transportation-cost in terms of the distance between the oil-wells and the manifold (crude oil facility) by using two variables, distance and oil-well capacity.
3.4 Methods Available for Research in General
3.4.1 Mathematical Modelling
cjnapter 1 nree Kesearcn iviemoQoiogy ana proposed irame worK specifically in defining the undefined terms, axioms and abstract thinking; in short, the abstract systems. Logical models can be analysed numerically by using the mathematical models through mathematics, theories, differential equations, and partial-differentiation equations. Mathematical models consist of system elements such as variables, symbols, parameters and factors that are relevant to the modelling of real systems, and normally expressed in terms of equations. However, it is not necessary to use equations at all times. There are scenarios where some of the system elements are unquantified and can be represented by using diagrams and tables. A mathematical model is also a set of processes with approximations and assumptions attempting to match observations with logical or symbolic statements.
Mathematical models can be studied analytically by using calculus or numerically by using computation programming or coding, called computational models. The mathematical models can be created to explain the observations, to predict different kinds of goals, to facilitate decision-making or a combination of any of these. For example, the first order differential equation of speed f(x) = dx/dt, where dx is the change of distance and dt is the change of time.
Chapter Three Research Methodology and proposed irame worK 3.4.2 Heuristic Modelling
The word ‘heuristic’ comes from a Greek word ‘heuriskein’ which means to find or discover. Archimedes used this word ‘eureka’ which means ‘I have found (it)’ long ago. In engineering, ‘heuristic’ refers to the methods or ways that are used to seek immediate solutions in a short time. A heuristic technique can be defined as “a technique which seeks good (i.e. near optimal) solutions at a reasonable computational cost without being able to guarantee either feasibility or optimality, or even in many cases to state how close to optimality a particular feasible solution is” (Reeves, 1993).‘Heuristic’ means using, or obtain solutions by, informal methods or reasoning from experience, often because no precise algorithm is known or is relevant. It involves trial and error, as in iteration. Also a huge amount of work has been done on heuristic methods for solving combinatorial problems. It has been used as a new method in forecasting oil-production throughout the world, as a variable neighbourhood search (VNS) heuristic for scheduling work on oil-rigs, and it is also popular in Social Science modelling (Aloise et. al, 2006).
3.4.2.1 The Disadvantages of Mathematical Modelling and Heuristic Modelling
Chapter Three Kesearch Methoaoiogy ana proposed irame worK et.al, (2007) mentioned, most of these complex systems may not be worked out by exact mathematical models, but simulation can help.
A heuristic model could give quick solutions to the problems or be useful in the preliminary modelling design but there is concern that it is likely to be erroneous and unable to guarantee accurate solutions to problems.
3.4.3 What is Modelling?
A group of objects, ideas and the behaviours of different systems and processes can be represented in various ways. Modelling is one of the ways to represent them and it is no longer a new terminology to us. A model is a set of objects which represent the real process or systems, which could be physical or logical. There are also other definitions of the word ‘model’ from different people. According to Neelamkavil (1987: pp. 30), “a model is a simplified representation of a system (or process or theory) intended to enhance our ability to understand, predict, and possibly control, the behaviour of the system”.
Chapter Three Research Methodology ana proposed irame worK maps, variables and constants representing equations and formulations. Checkland (1981) identified four main types of systems which are natural systems (e.g. weather systems), designed physical systems (e.g. a train), designed abstract systems (e.g. mathematics) and human activity systems (e.g. a community). Maki and Thompson (2006) on the other hand differentiated the types of model in more detail by the nature and behaviour of the systems and processes to be imitated. They included physical models, theoretical models, logical models, computational models, simulation models and mathematical models.
3.4.4 Computer Simulation Modelling
Computer simulation is a process of designing a digitised model representing a real or proposed system for the purpose of experimentation and understanding of the system’s actual behaviour with given factors and scenarios. Compared to other approaches such as the mathematical model and heuristic model discussed before, computation simulation can be used to study simple systems but it is preferable when dealing with more complex systems. “Simulation involves the modelling of a process or system in such a way that the model mimics the response of the actual system to events that take place over time” (Schriber, 1987). Once the system’s behaviours are studied and analysed, improvements can be carried out by simulating the model using different input-data, in short the pilot-testing, which is also called the 'what-if?' analysis tool.
unapier inree .Kesearcn iviemoQoiogy ana proposed irame wuei and simulated for prediction of the future weather. It could be a few hours or days ahead. The latest version of data provided will decide the accuracy of the weather systems model due to major uncontrollable inputs from nature. The simpler the model is, the less accurate the end results shown. Historical data can be added for analysis of the predicted weather.
3.4.4.1 The Advantages of Computer Simulation
In experiments carried out on real systems and simulations, the competencies of simulation tools versus the other approaches and the quality of decision making are the main areas where the benefits of simulation can be explored.
1. Cost Saving
In real systems, experiments for testing the improvements designed could be costly and time-consuming, especially in production operations systems. If the experiments are taken place in the real crude oil production systems, some of the production-lines might need to be closed down. In the oil production plant, the cost for closing down production-lines can be sky-high, estimated at over millions of pounds.
2. Time-saving
Chapter Ihree Research Metnoaoiogy ana proposed irame worK for special systems like ecology. Some of the high-level simulators showed significant time-saving compared to the simulation by programming languages.
3. A Comparison o f Different Scenarios
While simulating the models, different scenarios can be set up and tested. These experiments can be repetitive and compared with their performance and results throughout the operations. For example, two types of production plant layout could be simulated and compared simultaneously or by analysing the results at the end of simulation for comparison.
4. The Impossibility o f Real System Construction
There are cases where the real system is not yet constructed, therefore the simulation is needed here to carry out the testing and experiments for validation beforehand to avoid failures and profit-loss. Before a chemical plant is constructed, all kinds of processes and equipments within the plants have to be planned, designed and tested to ensure they are working.
5. Wide Areas o f Implementation
Chapter Ihree Research Methodology and proposed trame worK
6. Answering ‘What-If? ’ Questions
A simulation can be used to simulate the model and make changes to the model to run for ‘what-if?’ questions. For example in crude oil production, for questions like ‘What if one of the production-lines closed down, would the output be affected?’ the simulation model data can be altered to predict the output for this question.
7. The Competencies and Ease o f Use for Supporting Decision-making
Most of the modelling will need certain assumptions when designing the complex systems due to their inability to add in numbers of variations. Although simulation does need some assumptions made, it is possible to insert any kind of distribution to model complicated systems while still giving satisfying results and predictions. Animation displays in simulation tools could enhance the application for non experts and facilitate the decision-making for the managers. Users are able to stop or run the simulation step by step for more interaction and understanding of the process and events happening in the model.
unapter inree Kesearcn Memoaoiogy ana proposed irame worK
3.5 The Computer Simulation Method
Through the analysis of the disadvantages of . other modelling methods and the advantages of simulation-modelling, the simulation-modelling method or, to be more precise, computer-simulation was chosen for this project due to its powerful ability in dealing with complex systems. The use of computer-simulation in the oil and gas industry allows managers or engineers to obtain a system-wide view of the effect of local changes to the production area; and computer-simulation played a vital part as a real-time controller for the design, analysis, development and implementation of the proposed integrated framework for this project.
3.5.1 The Purpose of Simulation
The operation of a system is subject to variations either predictable or unpredictable (Robinson, 2003), which both might give changes to the system when altered. In simulation, these variations are called 'variability'. Presence of more variability in a system brings on more complexity to the modelling. Modelling designers normally tend to simplify the system or study only one particular aspect of the system due to the complexity caused if all interconnections of the variability in the system are taken into account. There are also some 'variables' included in the simulation for representation of time, ratio, and any kind of numerical data. However, if the model of the system is simplified to ease the design, it is more likely that the study will be inaccurate as a result.
Chapter Three Kesearcn Metnoaoiogy ana proposea irame worn which contains offshore oil production wells, a floating structure production facility, shipment facility, sea vessel, and land equipment considering the weather conditions.
Computer-simulation has the ability to cope with the complexities of complicated real systems. Several reasons for implementing such simulation can be concluded as below:
1. It is a less-expensive research and study method compared to experiments carried out in real systems.
2. Advances in software-technology and programming-language improve the software power for rapid and valid decision-making.
3. Training can be carried out without affecting the real operations for operators. 4. Animation in simulation models advances the visualisation of operations
systems for better understanding.
3.5.2 Types of Simulation
Time and variability are the two most important aspects when designing a simulation model. Kelton et.al, (2007) has classified the types of simulation into three main classes which are static vs. dynamic, discrete vs. continuous and deterministic vs. stochastic.
1. Static vs. Dynamic Simulations
Chapter Inree Research Metnodoiogy ana proposed irame worn example, throwing a dice need has no relation with time but number of throws. On the other hand, the dynamic model, like the opening of a post office, has an opening time and closing time. Time is playing a role in this model.
2. Discrete vs. Continuous Simulations
The main difference between discrete and continuous models is the type of change in the system either over time or at specific time. Events in a discrete model will only change at a specific defined time, for example, bread is cooked for 30 minutes. There will be a starting time and ending time here. In the continuous model, the event will change over time according to the rate of change. This is normally used in a case like weather changes. The pressures and speed of wind change continuously over time. There are occasions where the discrete and continuous models are combined, for example "the refinery with continuous changing pressure inside vessels and discretely occurring shutdowns (Kelton et.al, 2007)."
3. Deterministic vs. Stochastic Simulations
inapter inree ■Kesearcn iviemoQoiogy ana proposeu irame wuik
3.5.3 Issues Related To Simulation and When Simulation Is Used
There are some issues to be considered before deciding to use computer-simulation in the systems where operations taken place. In the past, simulations were not often adopted in business due to expensive and specialised tool requirements. A huge amount of time and investment were needed in simulations-implementation. But they might be used in big organisations; heavy duty and automotive industries adopted simulations to solve only the serious problems which arose in the operations.
Nevertheless, thanks to the advancement of the software and computer-technology, the simulation tools were designed to be more user friendly. There was greater integration with other software packages like spreadsheets, word-processors, and databases over the years where simulations could be applied in more detail and in more specific markets or processes for collecting data, analysing data and storing data. Simulation could be developed into new system-control logic by the design or redesign of complex systems for controlling real systems, as mentioned by Kelton et.al, (2007).
Chapter three Research Methoaoiogy ana proposed irame worn
3.5.4 The Simulation Process
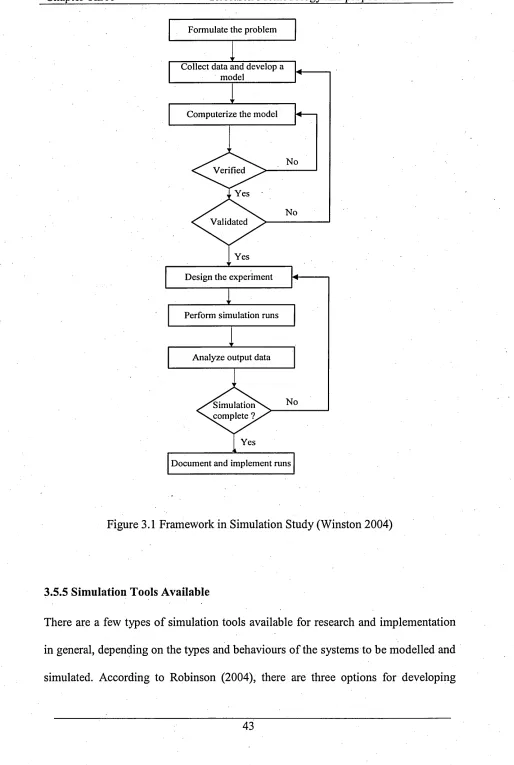
The simulation process consists of a number of different procedures. The following framework is used:
1. Problem Formulation
2. Data-gathering and Conceptual Model Development 3. Model Construction
4. Model Verification and Validation.
5. Experimental Design and Results Presentation 6. Results Analysis
inapter inree Kesearcn Memoaoiogy ana proposed irame wore
Formulate the problem
r
Collect data and develop a model
r
Computerize the model 4
---1
N o Verified
Y es
N o
< Validated >
Y es
r
D esign the experiment 4
---■ y f
Perform simulation runs
f
A nalyze output data
^ X ^ m u la ti(m sss ^com plete ? ,—
Y es
_______ __k___________
[image:68.612.54.568.6.771.2]Document and implement runs
Figure 3.1 Framework in Simulation Study (Winston 2004)
3.5.5 Simulation Tools Available
Chapter Three Research Methodology ana proposed irame worK
computer-simulation models which are spreadsheets, programming languages, and specialist software.
The programming languages allow the programmers or modellers to create some sort of logic and programmes that make it easy for the users who have no programming knowledge to perform some kind of calculations, analysis, designs, for performing repetitive jobs; or they can be used later to do simulations using computers. Programming languages like C, VB, C++, Java and VBA are high level languages and they are widely used in recent computing technology. Historically, “FORTRAN the general-purpose procedural language had been used to write computer-programs for simulating complicated systems with supporting packages written to help out in routine chores, keeping track of simulated events and statistical bookkeeping” (Kelton et al, 2007).
Spreadsheets can be used to display data in columns and rows. Formulas can be inserted for calculations. For example, when there are many numbers or data to be added up, the formula ‘SUM’ can be used to sum up all